The EIA has just released its Short-Term Energy Outlook. Some of their projections should be taken with a grain of salt because they usually change every month. Nevertheless…
All US production is Crude + Condensate. All other production numbers are total liquids. The data is in million barrels per day.
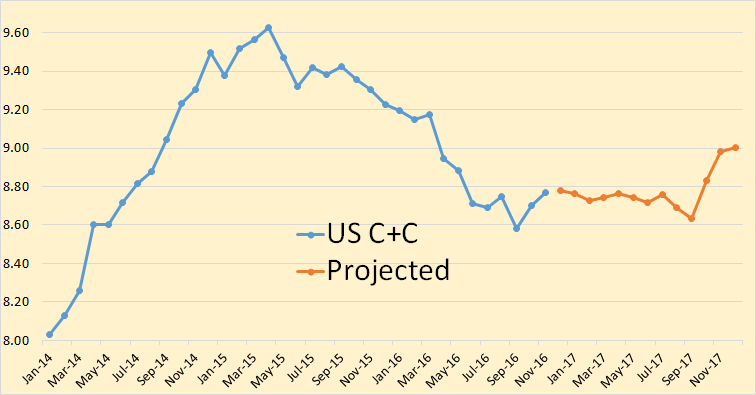
The EIA has US production leveling out at just under 8.8 million bpd until Oct. 2017.
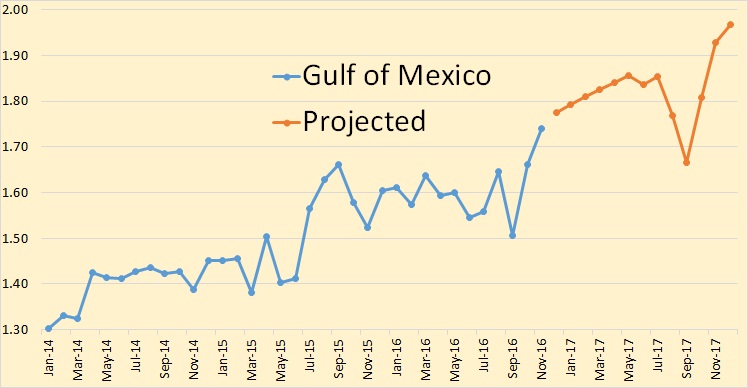
They have all large gains coming from the Gulf of Mexico.
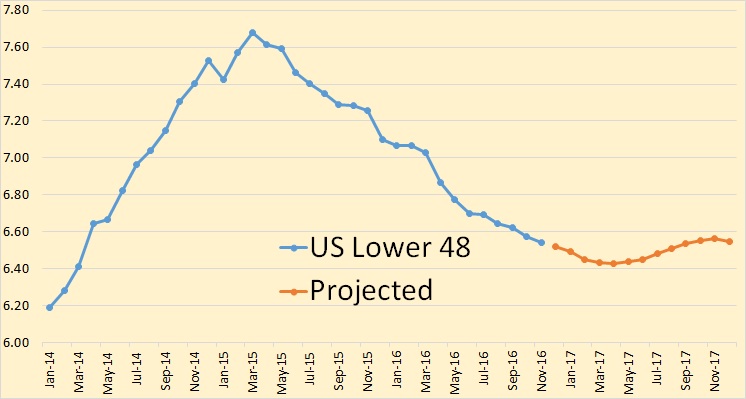
The EIA sees no big gains coming from shale plays. They have production bottoming out in March and April, then increasing only slightly the rest of the year.
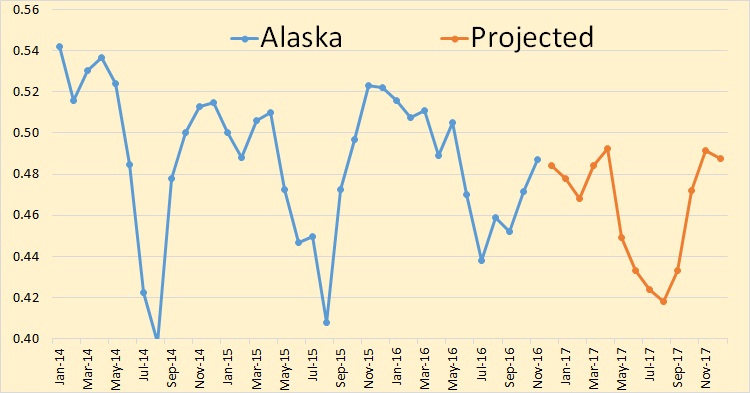
They have Alaska pretty much holding its own thru 2017.
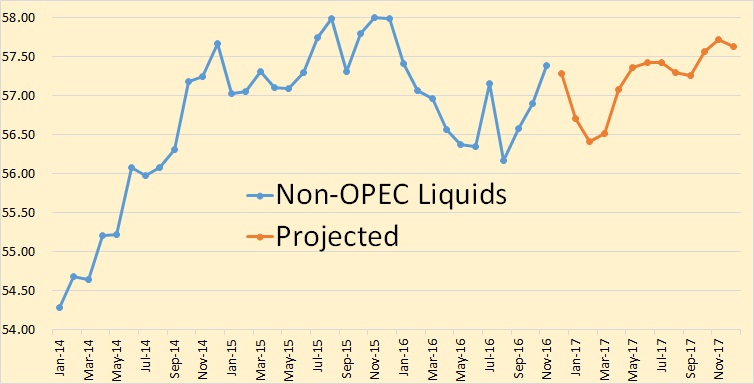
They have Non-OPEC liquids recovering in 2017 but still holding below the 2015 average.
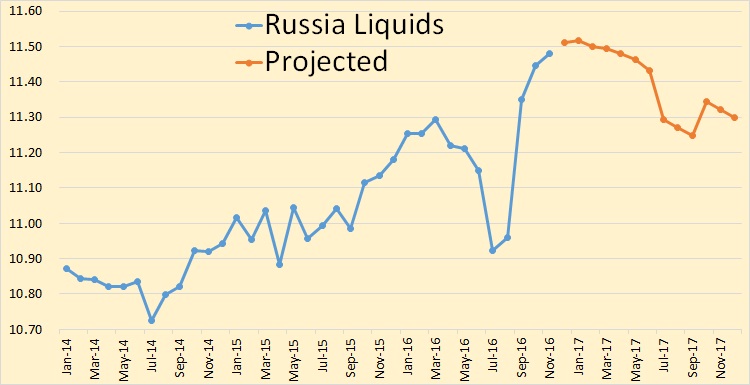
The big increase in 2017 average is supposed to come from Russia. They have Russia peaking in January then starting a slow but steady decline.
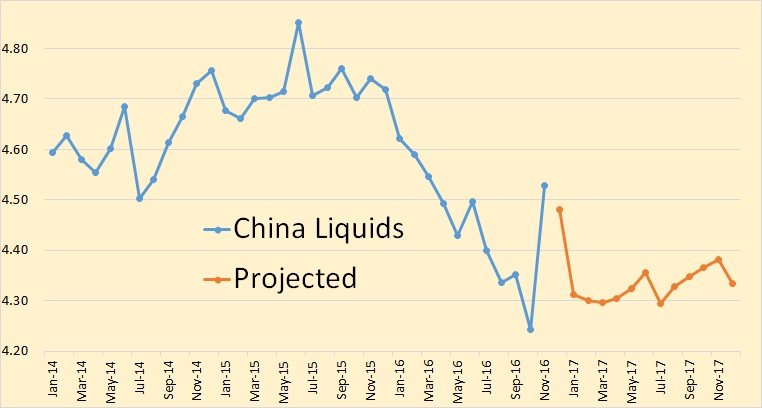
The EIA says China saw a huge increase in liquids production in November, down slightly in December before dropping again in January. I have no idea where the EIA got this November production data from. I could find nothing on the web that confirmed this data.
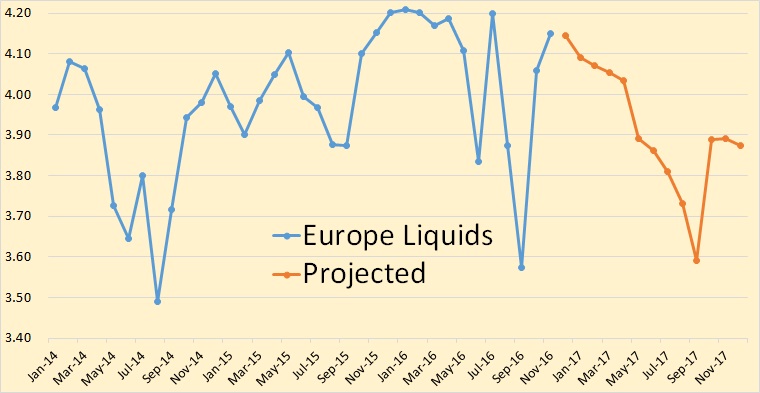
Europe consist primarily of the UK, Norway and other North Sea production. The EIA has Europe declining throughout 2017 before recovering somewhat in October.
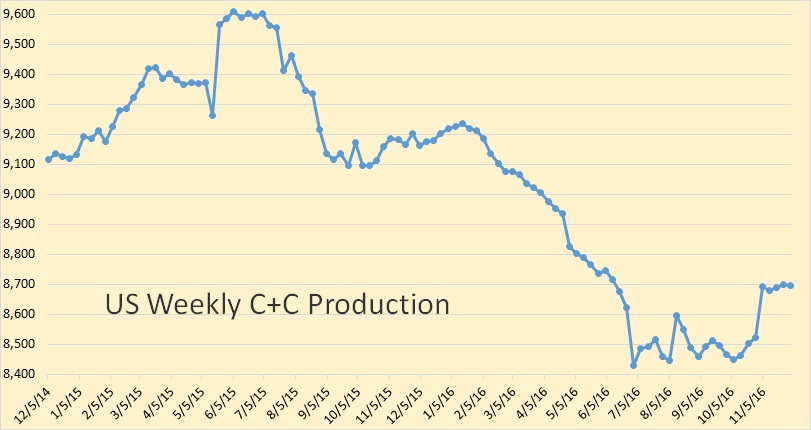
And just out, the EIA’s weekly estimate of US Weekly Petroleum Status Report with their best estimate of US C+C production as of December 2nd. This data is in thousand barrels per day.