The EIA has released its Petroleum Supply Monthly with C+C production numbers through May 2014. Of all the EIA data releases this seems to be the most accurate. However in some cases it is only as good as a few EIA employees guesses. And the more state data they have to work with, the better their guess.
The data in this report goes back to 1920 for total US production and to 1981 for individual states and offshore production. However I have chosen to shorten the time frame for my charts in order to better show what has happened recently.
US production was down 36,000 bp/d in May to 8,357,000 barrels per day. US production took off in mid 2011 when Shale production took off and has risen some 3,300,000 since. Of course there was shale production prior to this but it was only keeping US production on a relatively flat plateau.
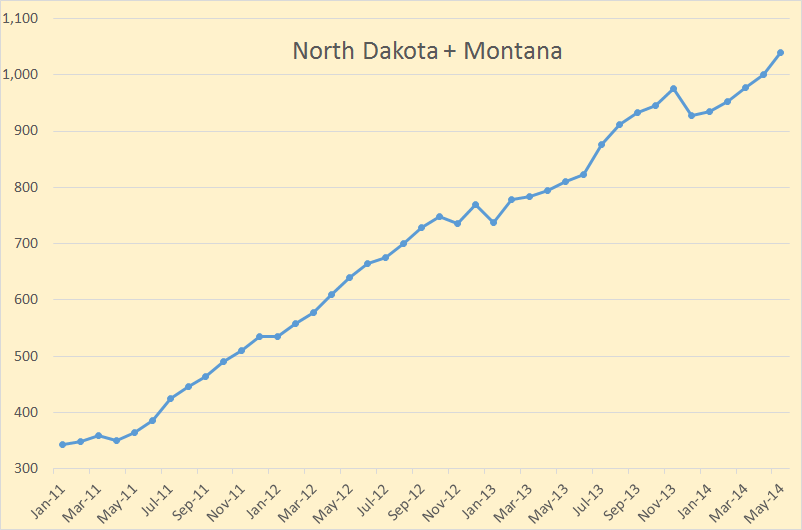
Everyone is interested in the Bakken so I have combined the two Bakken states. Of course there is production in these two states outside the Bakken but this is the best I could do. Note that when the Bakken has one bad month as they had in December, it takes several months to get back to their prior production level.
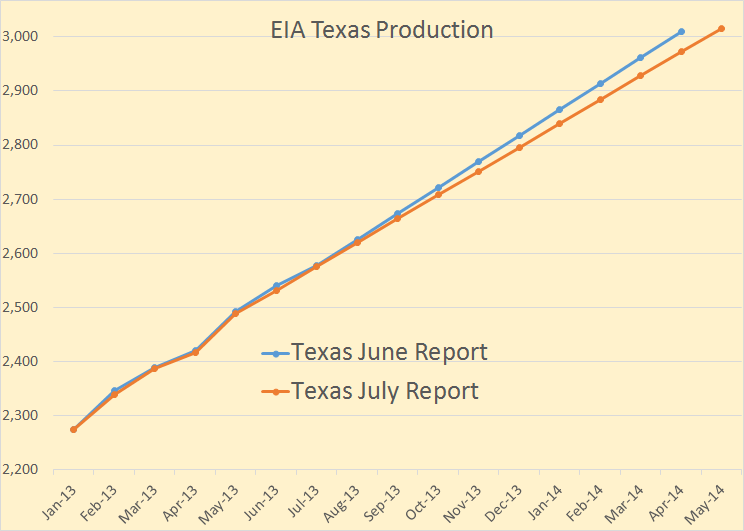
Here is the most interesting chart. The EIA has Texas C+C production growing at exactly 44,000 barrels per day for 12 months straight. But last month they had Texas growing at 48,000 barrels per day for 8 months straight. A few months before that they had Texas production growing at 50,000 barrels per day for about 8 months straight.
The reason they have to estimate Texas growth is the EIA gets all their information from the individual states, or the BSEE for all offshore production. Texas gives oil companies up to two years to report their production so therefore Texas production numbers are always incomplete… so they just estimate what they think it will be.
I estimated, last month, that Texas C+C production was increasing by about 40,000 barrels per day per month.
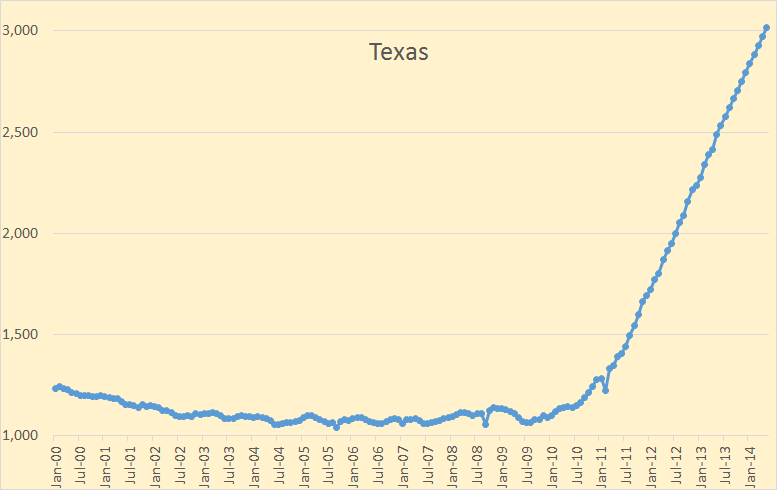
This is Texas C+C from 2000. The shale revolution started to increase Texas production in early 2010.
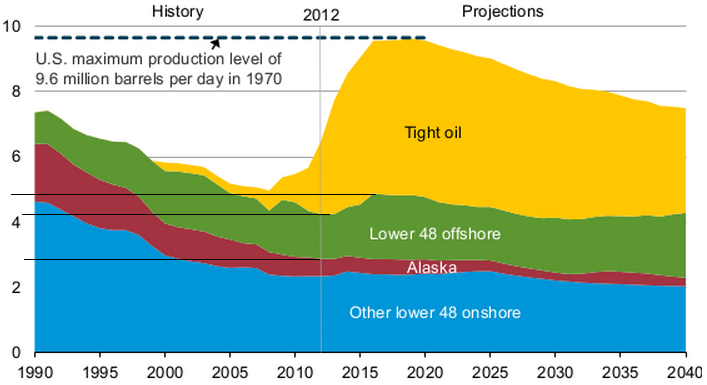
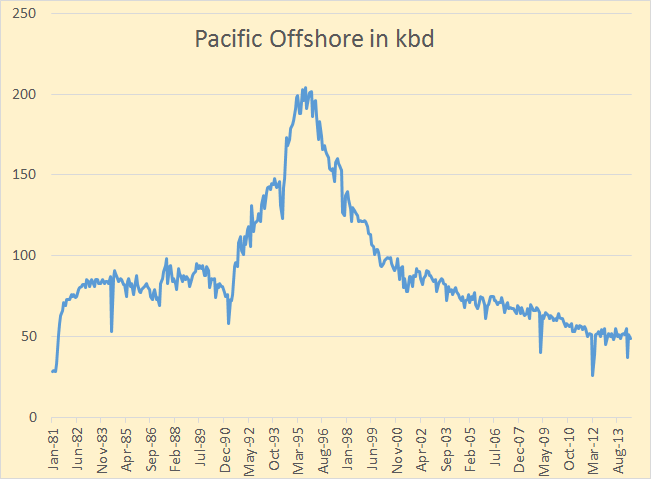
This chart shows where the EIA expects US C+C production to be when they expect it to peak in 2016. They expect C+C production to top out at about 9.6 million bpd. They expect Tight oil to be approximately half of all US production. That would be 4.8 million bpd. They expect offshore production to be 2 million bpd, up from approximately 1.35 million bpd today, 1.3 million bpd in the GOM and 50 thousand bpd in the Pacific.
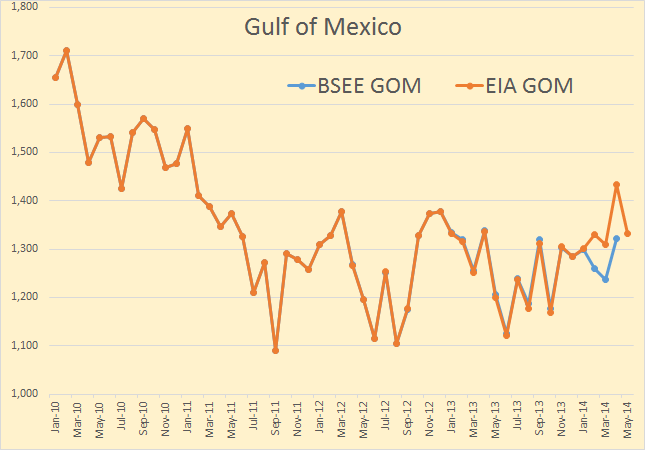
To get to 2 million offshore we need an increase of approximately 650,000 bpd by 2016.
Pacific offshore is in decline so all that increase would have to come from the Gulf of Mexico.
The BSEE, like Texas, sometimes reports incomplete data. But the BSEE data is a lot closer than it appears here. Here the EIA data is through May but the BSEE data is only through April. The EIA is showing the last four months above 1,300 kbd. However when the final BSEE data comes in, it is a very good bet that all four months will below 1,300 kbd. The EIA just appears to be wishing the numbers higher.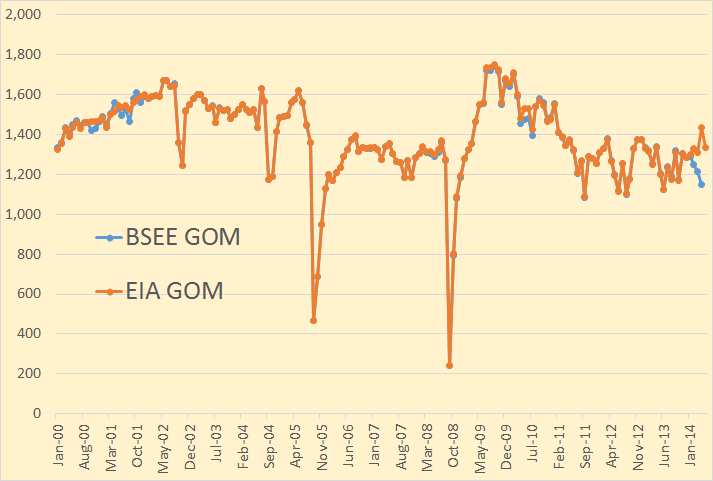
I consider it extremely unlikely that the GOM will reach 2 million barrels a day by 2016.
US production, in May, was about 1,250,000 below the point where the EIA thinks it will peak at in 2016. 9.6 million barrels per day is what they expect the average daily C+C production to be in 2016. So to get there we only need to have an average increase of about 50,000 barrels per day per month. In the past 24 months the US increase in C+C production has averaged 84,000 barrels per day per month. So the EIA believes we will not do quite as well in the next two years as we have done in the past two years.

