There has been very little data to post about recently and as everyone should know by now, I post primarily about data. So if there is no data there is not much to post about. Also I have been very busy for the a week now and have checked in only a couple of times.
A few days ago a very racist post was posted on this blog. I completely overlooked it as I seldom scan the posts because I get an email for every post so I just read the posts in the emails. But when there is a guest post, as the one last week was, I get no emails, the guest poster gets them instead. Anyway I deleted the post and banned the poster. I also banned another poster because he accused me of deliberately letting the post stay up. That outraged me. It was the same thing as accusing me of such racism.
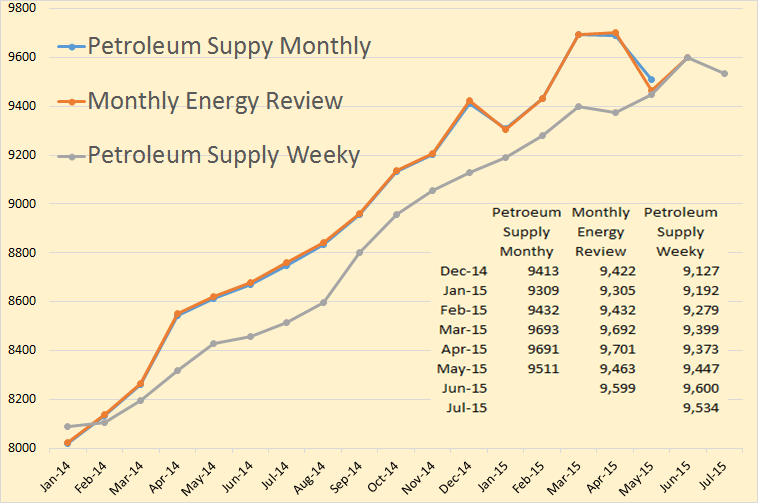
The Monthly Energy Review and the Petroleum Supply Monthly have US production peaking, so far, in March and April. The Petroleum Supply Weekly has US production peaking in June. In the chart above I have averaged the Petroleum Supply Weekly into monthly data. All data is in thousand barrels per day,
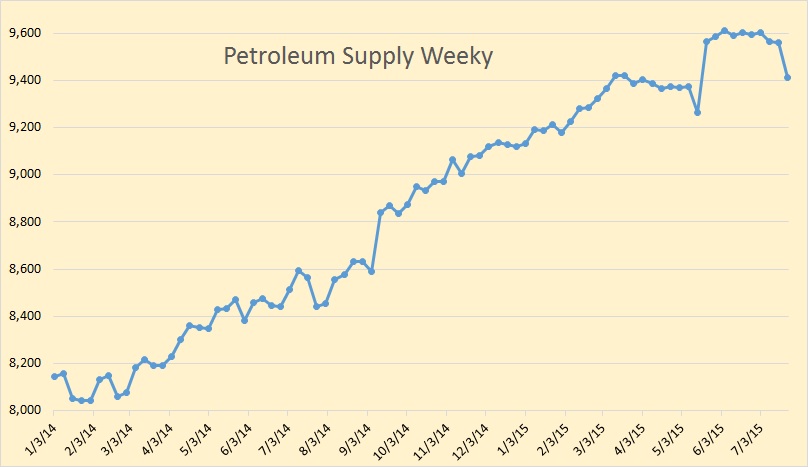
Here we have the weekly data from the Petroleum Supply Weekly. The last data point is July 24th. The huge jumps you see are basically just revisions. The huge jump you see for the week of May 22nd, was not really a jump. The EIA explained that their prior numbers were too low and the sudden increase that week was merely an adjustment.
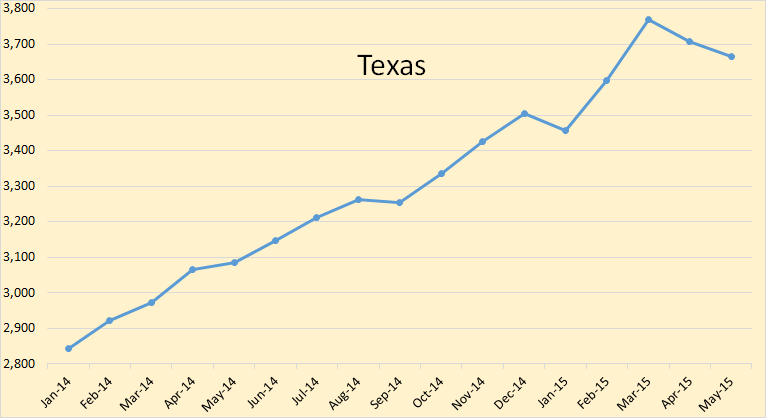
The EIA is finally getting its act together as to Texas C+C production. They have Texas peaking in March at 3,770,000 bpd and declining 106,000 bpd since then.
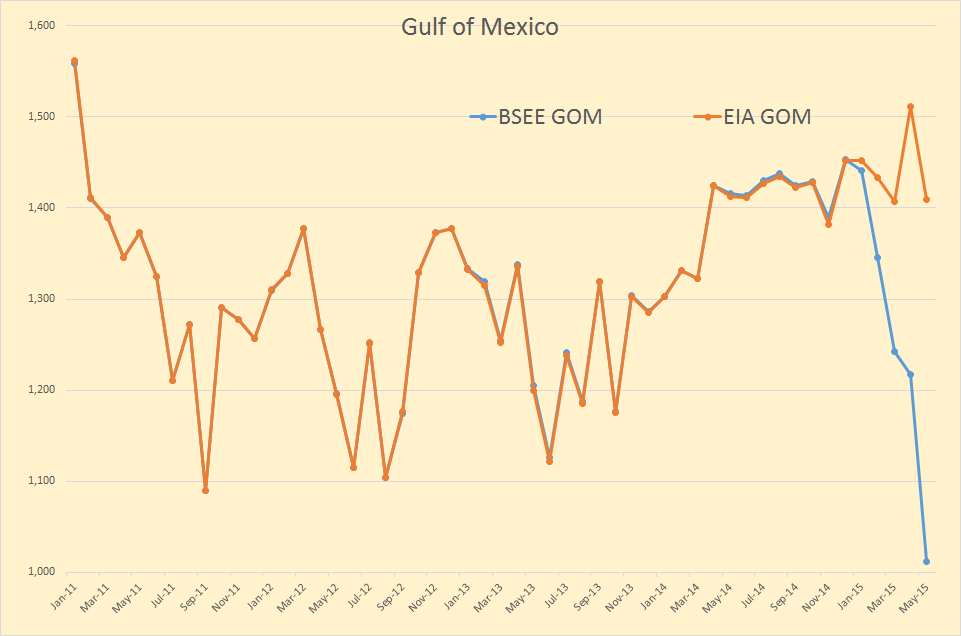
The EIA had the Gulf of Mexico spiking up in April but falling right back in May. The BSEE data, like Texas, is always delayed but only by about four months.
The EIA admits that they show different data but tries to explain it here:
EIA reports show different aspects of U.S. oil production statistics and trends
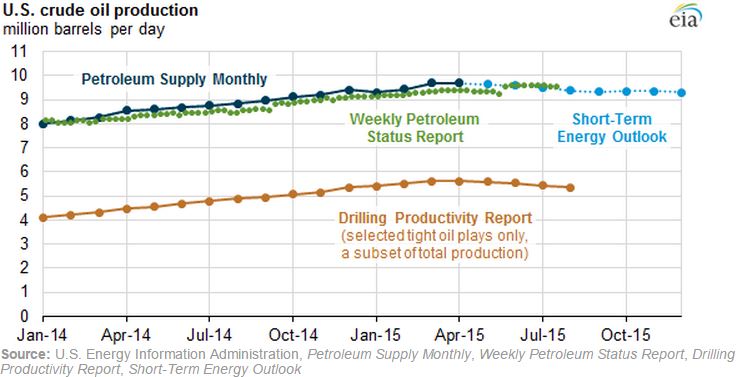 EIA publishes several reports covering current crude oil and natural gas production conditions and how recent trends may affect the near-term outlook for the oil and gas industry. Each EIA product is distinct in its purpose, methodology, timeframe, and regional coverage. Some reports are considered estimates of actual production volumes, while others focus on future production.
One analyst suggest the EIA has been fudging the data all along:
EIA Capitulates Under Cover Of Darkness
Many investors know that when a company wants to mitigate media coverage of bad news, they typically release data on a Friday after the close.
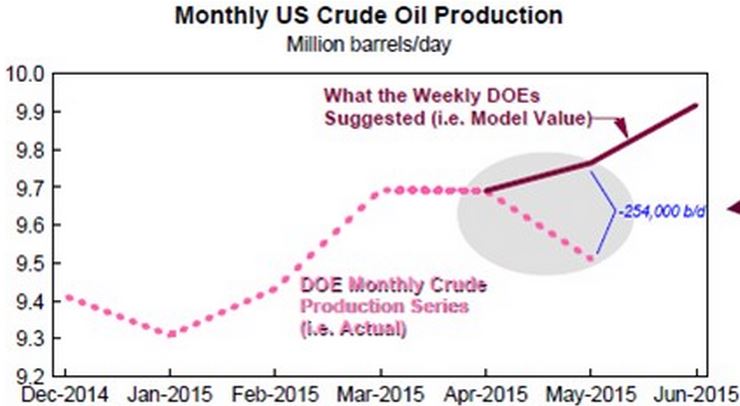
Well last Friday, that is exactly what the EIA did, admitting the very thing I and Cornerstone Analytics have been arguing all year: EIA was and still is overstating U.S. production. The amount that they admitted to so far, as of Friday afternoon, was 254,000 barrels per day (b/d) or 1,778,000 barrels per week, 7,112,000 per month or 14,224,000 for June and July alone.
This is the most incredible cover up I have ever witnessed in my decade-long investment career and I have not seen one major media outlet even mention it so far. Instead China demand & Iran output are front and center as per prior posts in an attempt to divert attention (I call it moving the goal posts) away from the fact that both U.S. production and inventories were about to fall. The chart below speaks for itself on what is occurring:
