A post by Ovi at peakoilbarrel.
Clik here to view.
Here I am again reporting on out of date US February oil production from the EIA April report after the world oil environment has been turned on its head. Fortunately the EIA also has some forward looking reports that make use of more current data to provide projections for a few months out. Also the EIA has a guesstimate for weekly oil output which certainly provides an indication of the direction of production over the next month. Also there are reports on rig counts that indicate activity in oil basins and provide clues on where oil output is going. Down, Down, Down.
All of the oil production data for the US states comes from the EIAʼs Petroleum Supply Monthly. At the end, an analysis of a three different EIA monthly reports is provided. The charts below are updated to February 2020 for the 10 largest US oil producing states (Production > or close to 100 kb/d).
Clik here to view.

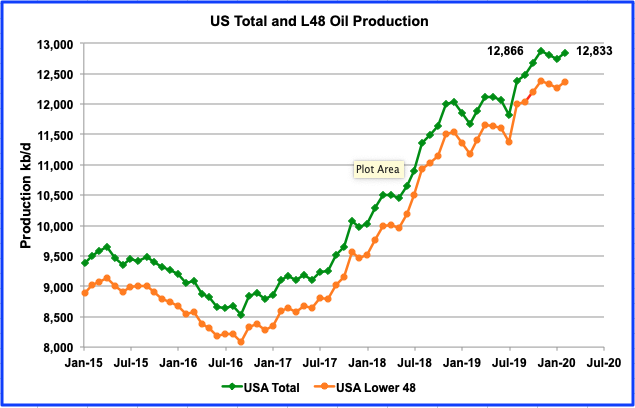
The May EIA report shows US production increased in February by 87 kb/d to 12,833 kb/d from 12,746 kb/d. For the lower 48 states only, production from January to February increased by 92 kb/d. From July 2019 to November 2019, output grew from 11,823 kb/d to 12,866 kb/d, an increase of 1,043 kb/d or an astonishing average rate of 260 kb/d/mth or 3,120 kb/yr. This astonishing rate begs/raises a few questions.
- Is it this stunning production rate of 260 kb/d/mth that lead Saudi Arabia to call for an OPEC + meeting for March that subsequently resulted in the split with Russia which resulted in the launching of Saudi Arabia’s Shock and Awe attack on the world’s oil markets?
- Will the November 2019 output of 12,866 kb/d be recorded as the new US Peak Oil date?
- Will US oil companies again challenge OPEC’s market share in the future or will they be content with taking a portion of the yearly growth, when growth returns? I have often wondered where we would be today if the US had limited their production to 2/3 of the yearly demand growth and let OPEC and Russia compete for the remaining market share. US unlimited production has only led to lower oil prices along with the demise of many US oil companies and less oil in the ground for the future.
Clik here to view.
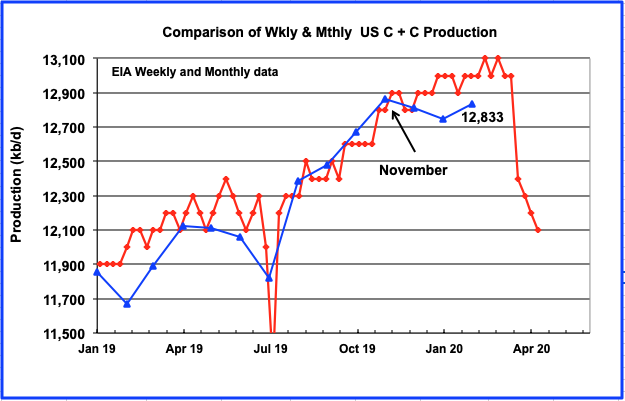
In an attempt to provide the latest production estimates for the US, above is a comparison of the EIA’s weekly and monthly production data. The weekly data is updated to the week ending April 24 and the monthly up to February 2020. While the weekly and monthly numbers are in reasonable agreement from August 2019 to November 2019, there is major divergence after that. Clearly there is some speculative oil production information coming from the EIA’s offices responsible for prediction weekly oil production. Regardless, they got the direction right for February but are 167 kb/d too high. The STEO is predicting output of 11,900 kb/d for May which appears to be where the weekly data is heading.
Clik here to view.
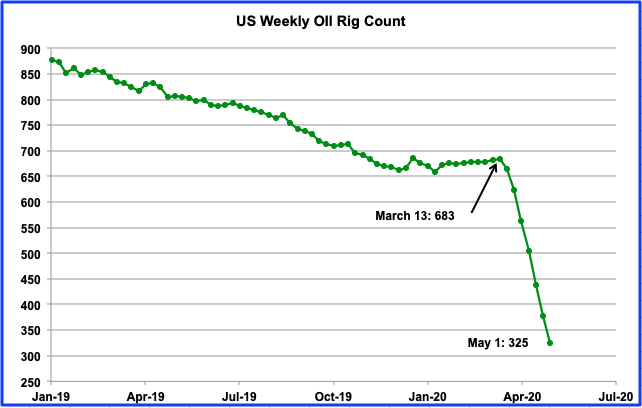
An indication of where US oil production is headed can be gleaned from this chart, showing the US weekly oil rig count. Data is provided by the weekly Baker Hughes rotary rig count report. From March 13 to May 1, 358 rigs were taken out of service, a drop of 52.5%. According to the Drilling Productivity report, each rig was capable of producing 730 bbls/d in April. So as of May 1, 260 kb/d/mth of new production is being shelved which will result in a very steep monthly production drop, as indicated in the previous chart.
Ranking Production from US Oil States
Clik here to view.
Listed above are the 10 states with production previously greater than 100 kb/d. This month Utah fell below 100 kb/d but will be retained for continuity. These 10 accounted for 10,371 kb/d (81%) of production out of a total US production of 12,833 kb/d in February 2020. US year over year production again exceeded 1,000 kb/d by 164 kb/d. Not shown in the table is the GOM which produced 2,023 kb/d in February and would rank it between Texas and North Dakota.
Clik here to view.
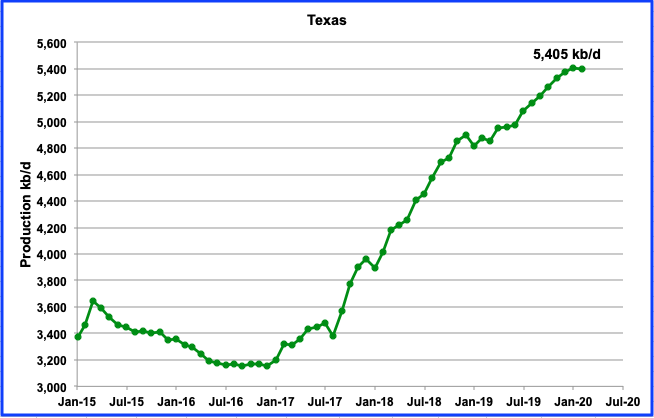
February production in Texas dropped by 5 kb/d to 5,400 kb/d from a revised 5,393 kb/d in January. There is a definite hint of slowing output in Texas.
Clik here to view.
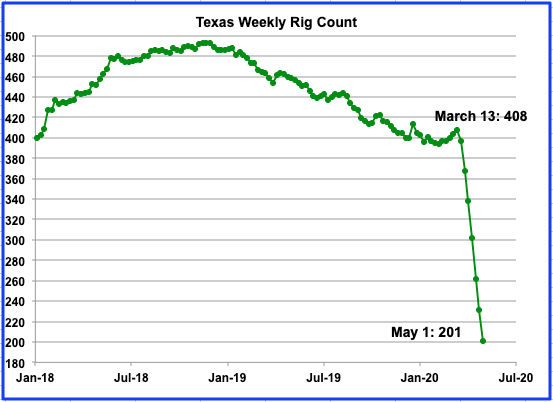
The rig count in Texas on May 1 was down to 201 rigs, a drop 207, or 50.7%, from 408 in the week of March 18.
Clik here to view.
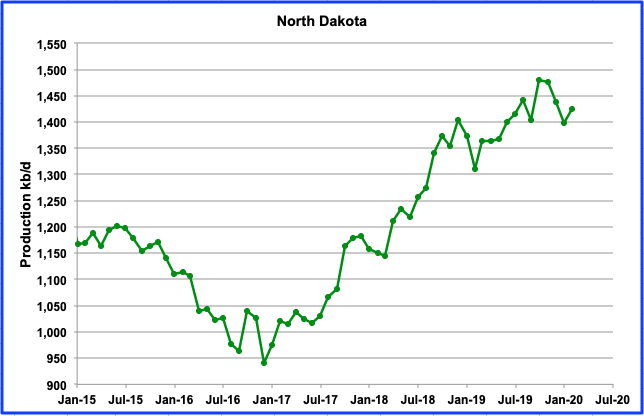
North Dakota’s oil production has been dropping since October 2019 however it increased by 27 kb/d in February to 1,425 kb/d.
According to this report, North Dakota is now drilling wells outside of its core areas. BISMARCK, N.D. (AP) — North Dakota’s oil production may peak within five years as companies finish drilling the most prolific portions of the state’s oil patch, state and industry officials told lawmakers Tuesday.
“Mineral Resources Director Lynn Helms, the state’s top oil regulator, said about 20% of drilling activity is now outside of the “core” areas of the western North Dakota’s oil producing region.”
“The end of (core area-drilling) is on the horizon; we can see it from here,” Helms told the Legislature’s interim Government Finance Committee.
From January to early March the number of rigs operating each week has remained almost constant as it wandered between 51 and 53 but by the week ending May 1, the number had dropped to 26.
Clik here to view.
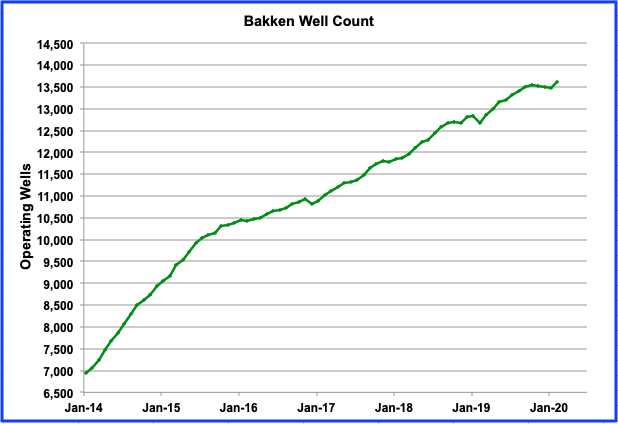
The number of producing wells in the Bakken started to decline in October 2019 from a high of 13,555 to a low of 13,482 in January 2020. However In February there was sharp jump to 13,616. It will be interesting to see what happens in March. We can expect a sharp drop in production and drilling in North Dakota, according to this report.
“Continental Resources Inc, the company controlled by billionaire Harold Hamm, stopped all drilling and shut in most of its wells in the state’s Bakken shale field, three people familiar with production in the state said on Thursday.”
Clik here to view.
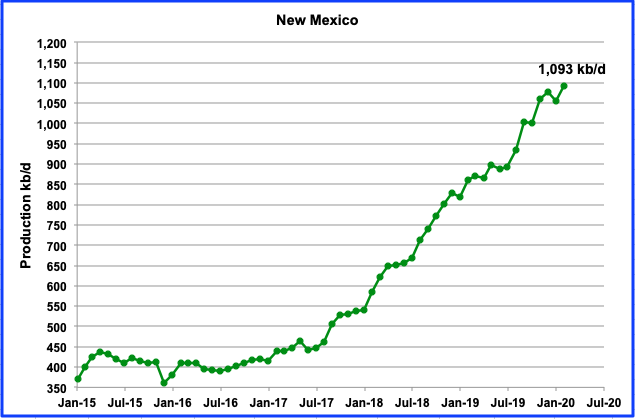
While January was the first month that New Mexico’s output declined, February resumed the upward trend. Output increased by 37 kb/d from 1,056 kb/d to 1,093 kb/d in February. While Texas has been getting all of the attention regarding its production growth, New Mexico has also increased its output and recently has exceeded the critical 1 Mb/d. On a YoY basis, New Mexico has increased its output by 232 kb/d, same as last month.
New Mexico’s production is expected to drop in March according to this report. “New drilling in the Permian Basin in southeastern New Mexico is screeching to a halt, and many producers are starting to shut in existing wells to await better times. That, in turn, foreshadows a double whammy on the state budget, as government revenue tumbles from plummeting oil prices and forthcoming production declines.”
Clik here to view.
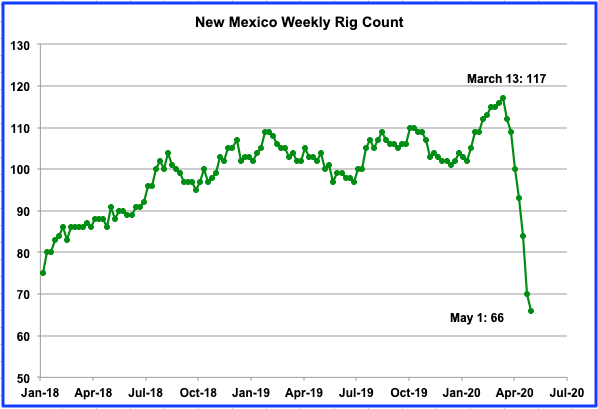
In New Mexico, the rig count fell from 117 to 66 from the week of March 13 to May 1, respectively. This should result in a production drop starting in March.
Clik here to view.
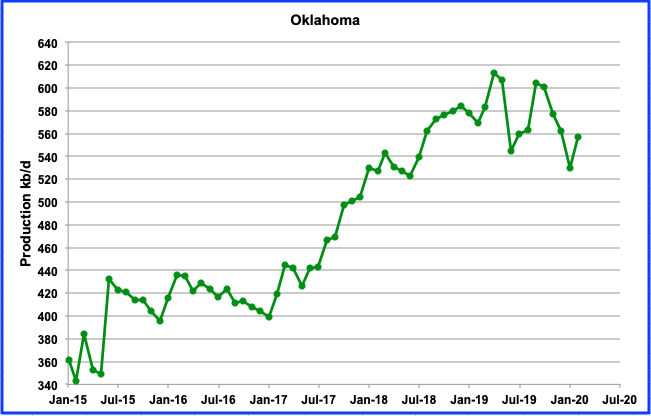
Oklahoma output rebounded in February after declining for four months in a row. Output increased by 27 kb/d to 557 kb/d. In early January, Oklahoma had 50 oil rigs in operation. In the week ending May 1, there were 13, a drop of 37, or 74%, from the beginning of the year.
According to this report, “The Oklahoma Corporation Commission approved an emergency order on April 22 that allows oil producers to stop or reduce production without losing their leases for non-production. One Oklahoma producer who testified that he operates about 600 wells in the state said he is currently losing $200,000 monthly by producing from economically challenged wells.”
Clik here to view.
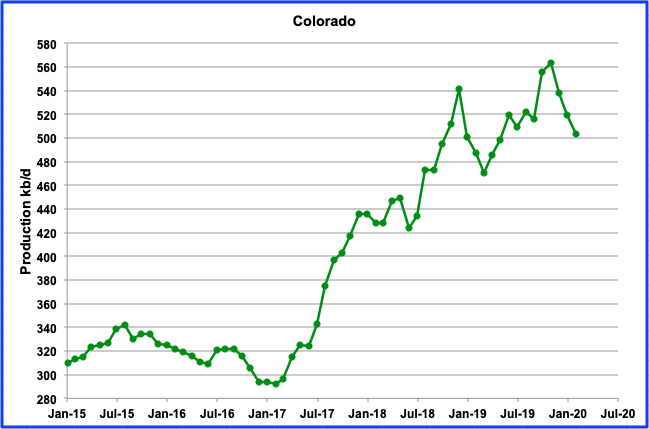
Colorado production declined by 16 kb/d in February to 503 kb/d from 519 kb/d in January. From the peak of 563 kb/d in November, output has dropped by total 60 kb/d. New environmental regulations may be beginning to take their toll on drilling activity and the resulting oil output decline. The current low oil price can only add to the drilling industry’s difficulties. However some operators have hedged their output and will continue to operate according to this report. Regardless, Colorado’s oil producers seem to resemble a tale of two cities.
“The oil and gas industry has been hit hard, including in Colorado. Halliburton and Liberty Oilfield Services have laid off workers in Colorado. Occidental Petroleum, Colorado’s No. 1 oil and gas producer, and Noble Energy, the No. 2 producer, recently announced cuts in spending and employees’ pay and hours. Denver-based Whiting Petroleum said on April 1 that it is filing for bankruptcy.”
On the other hand, “Denver-based Highpoint Resources, which operates exclusively on the northern Front Range, has not shut any of its wells. Bill Crawford, the company’s chief financial officer, said Highpoint has hedged its position in the market, meaning it has contracts locking in the price it receives for future production. About 95% of Highpoint’s production is hedged at $58 a barrel for the rest of this year.” Smart company! ???
Clik here to view.
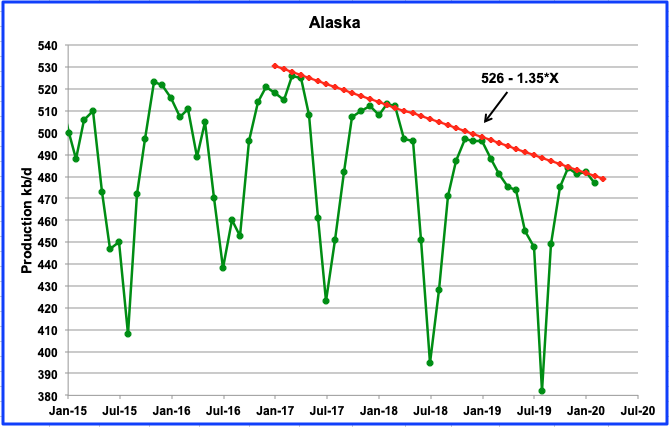
Alaska’s output continues its slow decline as shown by its annual peak production months of November, December and January touching the downtrend line. February was down by 5 kb/d to 477 kb/d. The line continues to show a decline rate of 1.35 kb/d/mth or 16.2 kb/d/yr.
An expected 20 kb/d increment near the end of the year will mostly be offset by the estimated yearly decline of 16.2 kb/d. However, the Corona virus is causing rigs to be shut down according the this report. “ConocoPhillips is demobilizing its rig fleet on Alaska‘s North Slope to try to minimize the risk of workers contracting COVID-19, a spokeswoman said Wednesday”
Clik here to view.
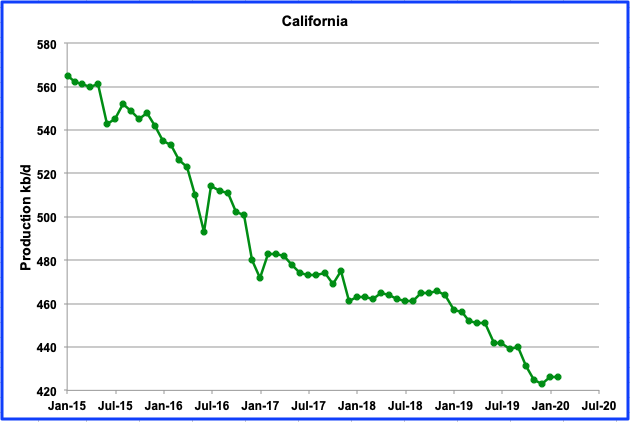
California’s slow decline has taken a pause. February production was flat at 426 kb/d and had an increase of 3 kb/d in January to 426 kb/d.
Clik here to view.
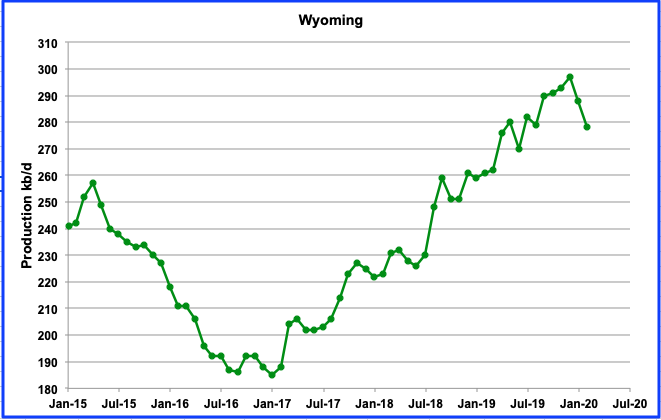
Wyoming increased its output from January 2017 to December 2019 and reached a new high of 297 kb/d in December 2019. However in January and February it had two successive drops. In February 2020 output dropped by 10 kb/d to 278 kb/d. Wyoming, like other states, is being impacted by low oil prices and the virus according to this report.
“Even with an agreement in place, the demand decline has been so sharp, and so deep,” University of Wyoming economist Rob Godby remarked. “The problem is really the coronavirus. There is so much oil on the market right now, and so much to go into storage, that really the only way to slow this down is to actually shut in wells.” Shutting in productive wells can prove costly, and there’s no guarantee activity will return to Wyoming down the road, he added.
Steve Degenfelder, land manager at Kirkwood Oil and Gas, LLC welcomed the decision by OPEC to limit production, but noted the Casper-based company will still be facing challenges in the days ahead. “We have shut in some high cost production and will consider more as time goes on,” he said.
During the week ending May 1, Wyoming had 4 oil rigs in operation, down from a high of 19 during January.
Clik here to view.
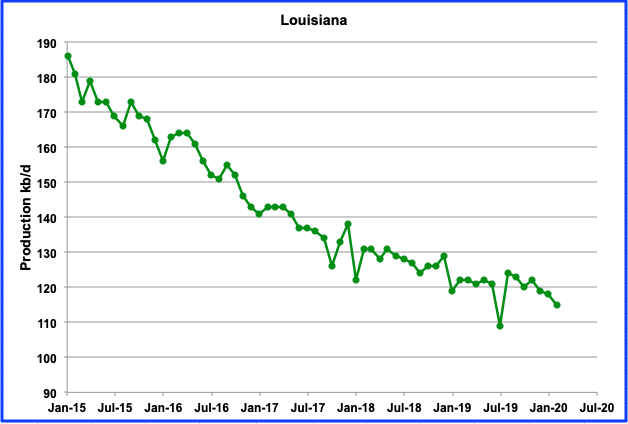
Louisiana continues its slow steady decline. After rebounding from a new low output of 109 kb/d in July 2019, the decline has begun again. February output was down by 3 kb/d from January to 115 kb/d. Louisiana’s oil rig count has had a slow decline from the beginning the year to the week ending May 1. In January, 22 rigs were operating while there were 16 in April/May.
Clik here to view.
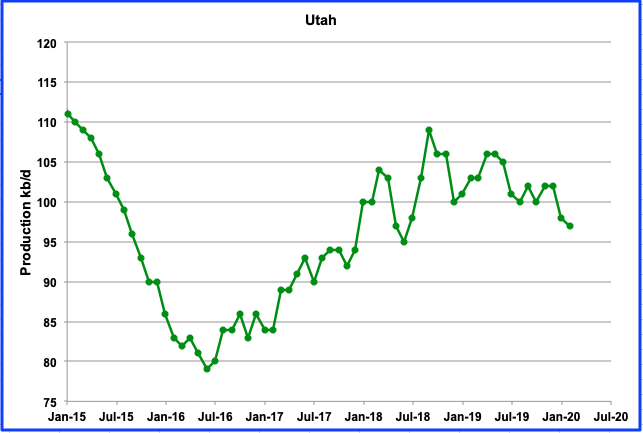
Utah’s output was holding steady since July 2019 at slightly over 100 kb/d due to its new conventional field but is now giving indications of entering a new slow decline phase. February production fell below 100 kb/d to 97 kb/d, a drop of 3 kb/d from January 2020. The last peak occurred on September 2018 at 109 kb/d.
Clik here to view.
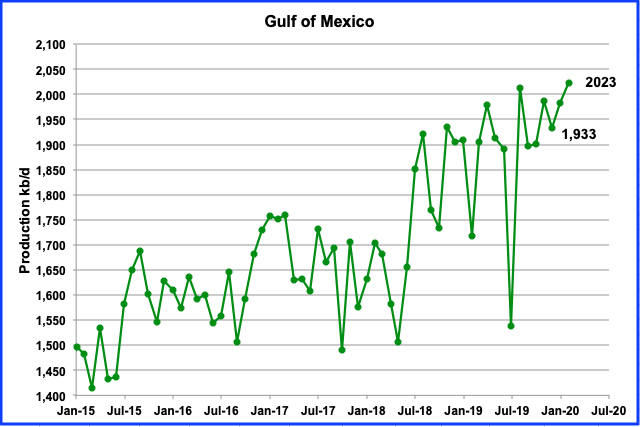
The GOM’s output continued to rise in February and exceeded 2,000 kb/d again. The last time it exceeded 2,000 kb/d was August 2019. February production increased by 41 kb/d to 2,013 kb/d.
UPDATING EIA’S DIFFERENT OIL GROWTH/DECLINE PERSPECTIVES
1) DRILLING PRODUCTIVITY REPORT
The Drilling Productivity Report (DPR) uses recent data on the total number of drilling rigs in operation along with estimates of drilling productivity and estimated changes in production from existing oil wells to provide estimated changes in oil production for the five key tight oil regions.
Clik here to view.
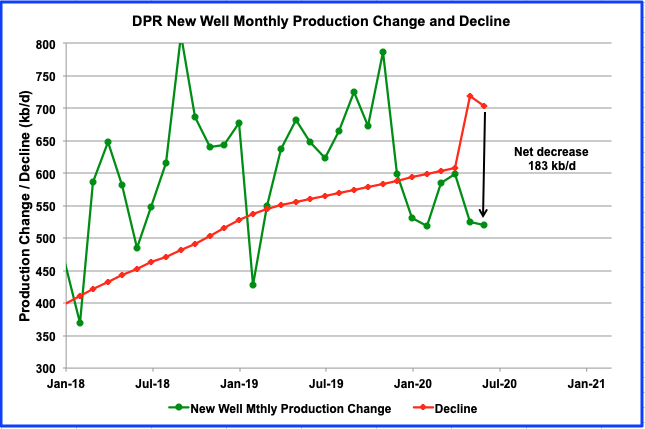
This chart shows the monthly change in new well oil production and the decline from all previous producing wells for the onshore L48 states. The difference between the two gives the projected output increase for all tight oil basins.
There has been a major change in the output projections from the March to April DPR reports. The chart shows the dramatic increase in the decline rate for March and April relative to February. For April 2020, the March report projected an increase of 17.5 kb/d. The new April report has revised the March increase to a decrease of 194 kb/d. For May, the decline rate is projected to be 183 kb/d.
Clik here to view.
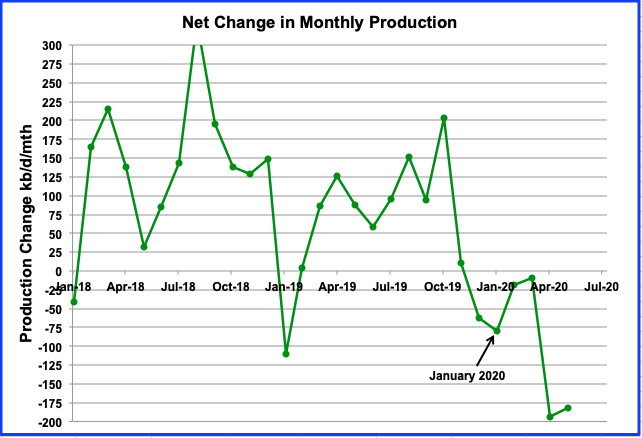
Above is the DPR net growth chart updated to May 2020 and shows the difference between the monthly change in new oil well production and the decline from all previous producing wells for the onshore L48 states. The April report indicates that oil production from the LTO basins and associated conventional wells has been in decline since January 2020. Output came close to no change in March but didn’t quite make it.
Clik here to view.
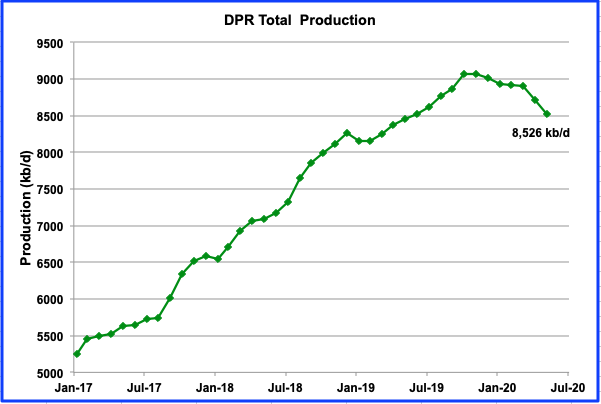
Above is the total oil production from the 7 basins that the DPR tracks. Note that the DPR production includes both LTO oil and oil from conventional wells. LTO oil and conventional oil output peaked in October 2019 at 9,062 kb/d. The projected May output is 8,526 kb/d, a drop of 536 kb/d. Note the increased rate at which production starts to drop in March.
Clik here to view.
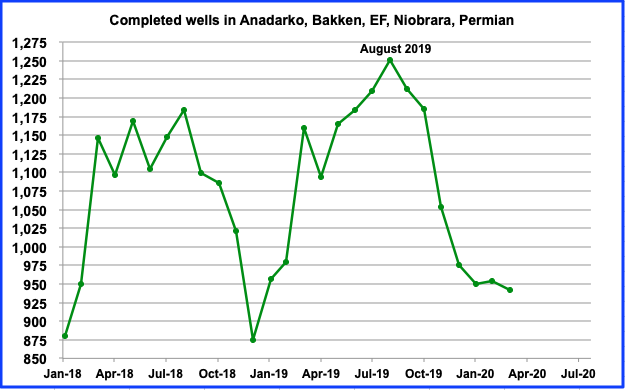
From August 2019 to March 2020 completed wells dropped from 1,251 to 942, a drop of 309. There appears to be a temporary pause in completion from January to March.
Clik here to view.
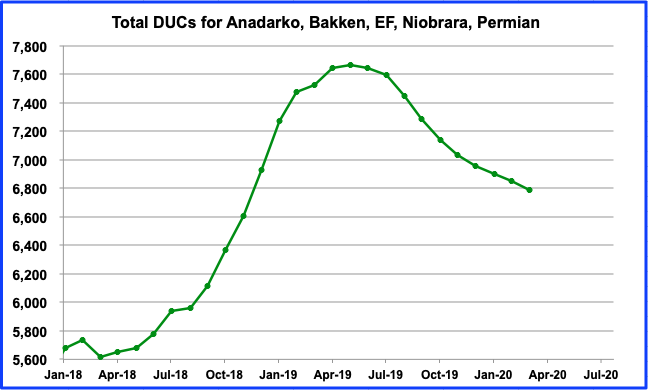
It is interesting to note that the number of DUCs is dropping very slowly. During March, only 62 DUCs were completed. Does this indicate that the majority of them are dead ducs? ????
Clik here to view.
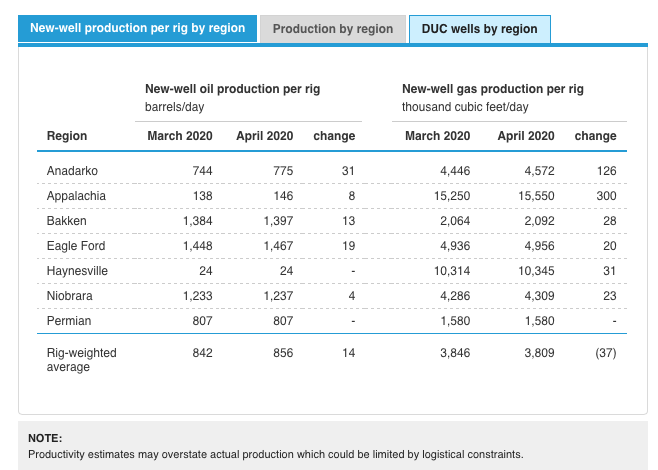
Clik here to view.
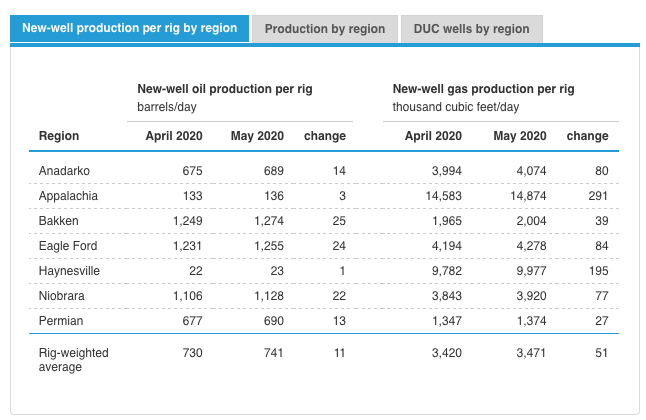
Above are two tables from the March and April DPRs. Compare how the New-well oil production per rig has dropped for each region in going from the March to April reports. The March/April productivity was close to 850 b/d/rig while April/May dropped to 735 b/d/rig. This seems to imply that in April and May, the rigs were moving into lower productive regions. Is there some other explanation?
2) Light Tight Oil (LTO) Report
The LTO database only provides information on LTO production from seven tight oil basins and a few smaller ones.
Clik here to view.
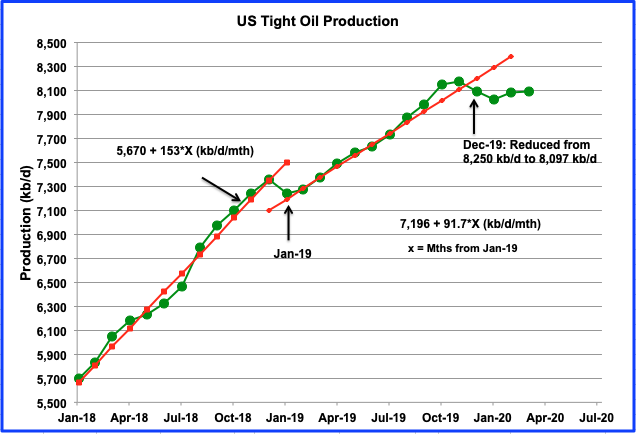
There was a significant downward revision to the LTO data in the April 2020 report. The December 2019 output was reduced from 8,250 kb/d to 8,097 kb/d. March output is 8,096 kb/d up 7 kb/d from 8,089 kb/d in February.
Clik here to view.
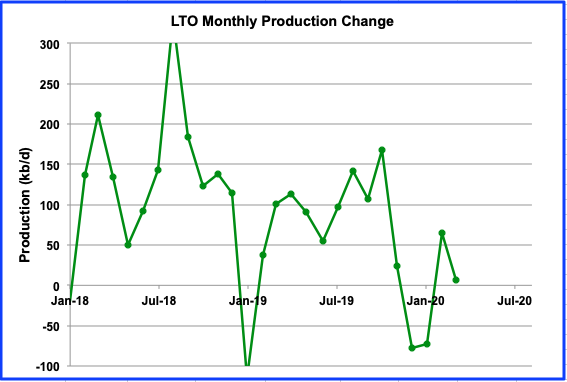
This chart shows the monthly addition to LTO output. It recovered to an output increase in February and March from decreases in December and January. The production increase in March was 7 kb/d.
Clik here to view.
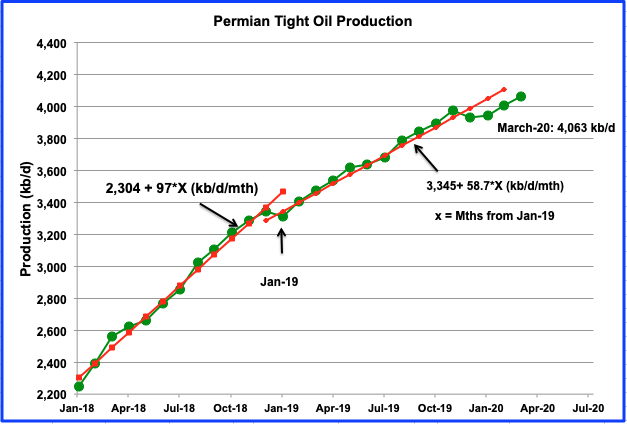
The Permian is the largest contributor to US tight oil growth. The average growth rate for 2019 is 40% lower than 2018. While output may be slowing, output from January to March continued to grow at 59 kb/d/mth, virtually continuing at the average trend of 58.7 kb/d/mth from January 2019. Output in March reached a new high at 4,063 kb/d. Will it slow in April as rigs are retired.
3) Short Term Energy Outlook (STEO)
The STEO provides projections for the next 13–24 months for US C + C and NGPLs production. The April 2020 report presents EIA’s oil output projections out to December 2021
Clik here to view.
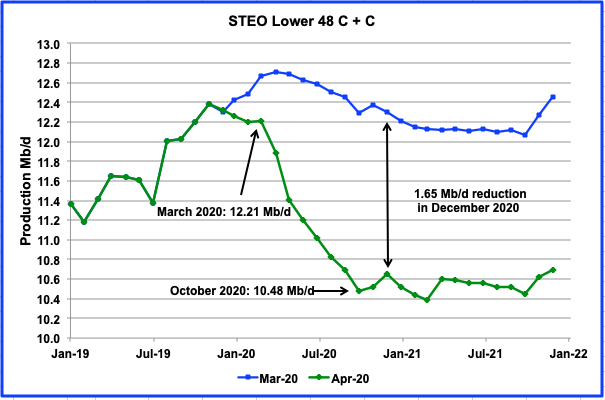
The chart compares the April 2020 STEO C + C projections with those in the March 2020 report. In the April STEO report, the estimated output for December 2020 has been reduced by 1,650 kb/d from the March report. From March to October the STEO is estimating that output would fall at an average rate of 250 kb/d with largest drop occurring over the first two months at a rate of 400 kb/d. Also note that the GOM increase in late 2021 is smaller.
Clik here to view.
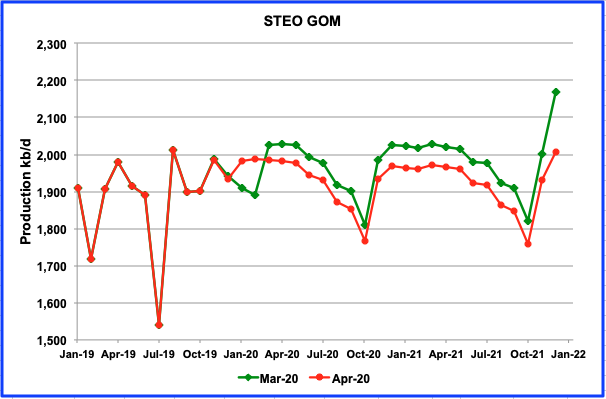
The increase in output from the GOM in December 2021 has been reduced by 167 kb/d. Could this be due to projected lower capex associated with the current low oil price environment?
Clik here to view.

This chart compares the April 2020 STEO projection with the March 2020 report for the Onshore L48. The revisions in April STEO report project that the onshore L48 output will be down by 1,602 kb/d in January 2021 as compared to estimates in the March report. The April report estimates that by December 2020, output is expected to be down from 10,230 kb/d in March to 8,680 kb/d in December, a drop of 1,550 kb/d.
Clik here to view.
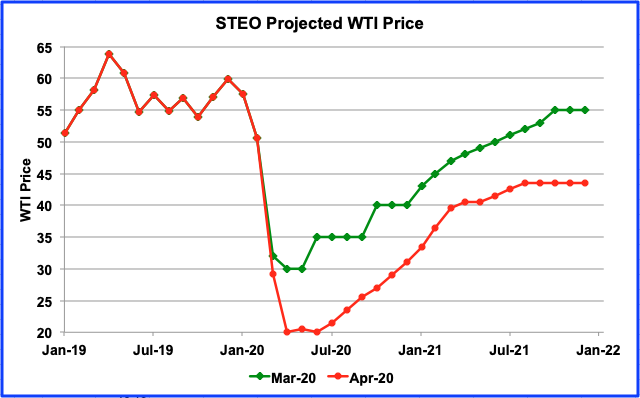
Above is a comparison of the EIA’s March and April projected price environment over the next two years. The settled price for WTI on May 1, 2020 was $19.69 for the June contract and $22.33 for July, close to the EIA estimates. The contango has been reduced to $2.64 today from $5 a few weeks ago.
World oil Production
Clik here to view.
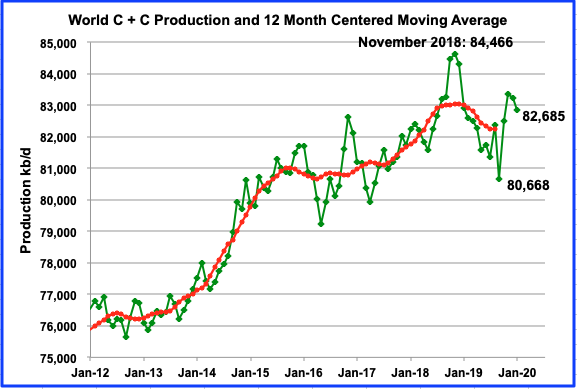
World oil production fell by 850 kb/d from 83,235 kb/d in December to 82,385 kb/d in January. The likely hood that the date November 2018 will be recognized as the date for World Peak Oil is increasing, in light of today’s slowing world economy and the time it will take to recover, possibly up to two or three years. In the mean time, new discoveries are few and small and old fields keep declining 24/7.
Clik here to view.
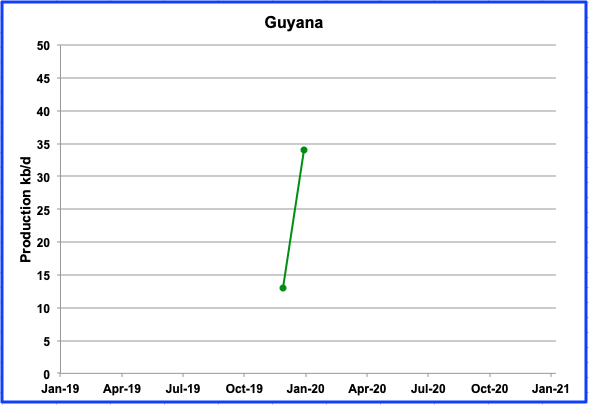
Check how fast Guyana’s production is increasing. Output in January jumped to 34 kb/d. It went from 13 kb/d in December to 34 kb/d in January, an increase of 21 kb/d or 161%. Almost puts the Texas Permian to shame. ????? .