Quantcast
Channel: Gulf of Mexico – Peak Oil Barrel
Viewing all 27 articles
Browse latest View live

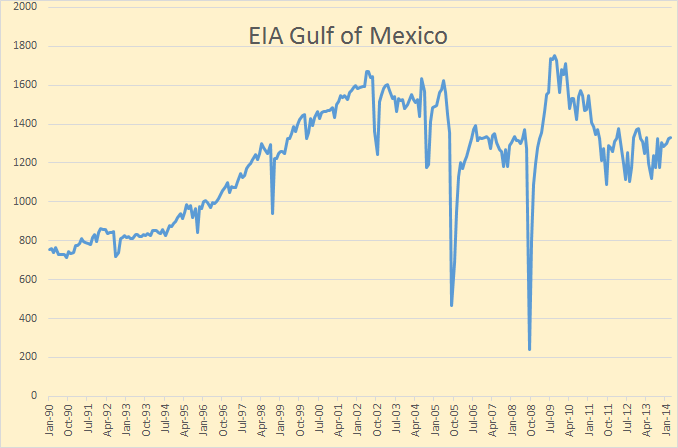
Gulf Of Mexico Crude Oil Production

0
0

Folks who follow this blog know that I am a data hog. That is I track data from the US as well as production from the rest of the world. But there are periods during the month when there is just no new data coming in. During the first 10 days or so of a month is such a time, almost no new data is posted anywhere. So I try to find something else to post. It is on the oil production in the Gulf of Mexico.

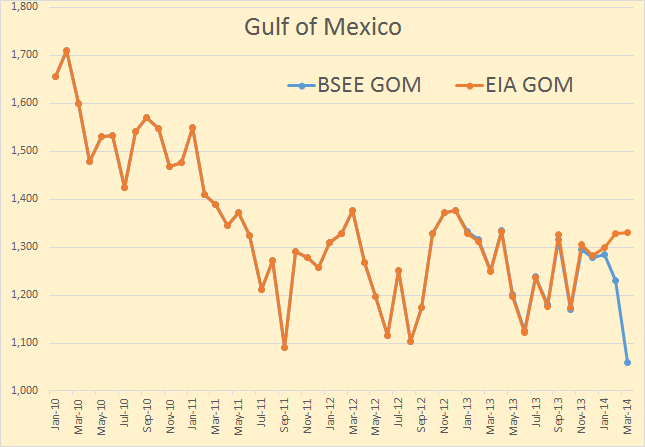
The last data point on all charts is March 2014. All data is in barrels per day except the first chart below which is in thousand barrels per day.

GOM Production

The EIA gets their data from BSEE, (Bureau of Safety and Environmental Enforcement), a branch of Department of the Interior, not the Department of Energy as you might expect.

GOM BSEE

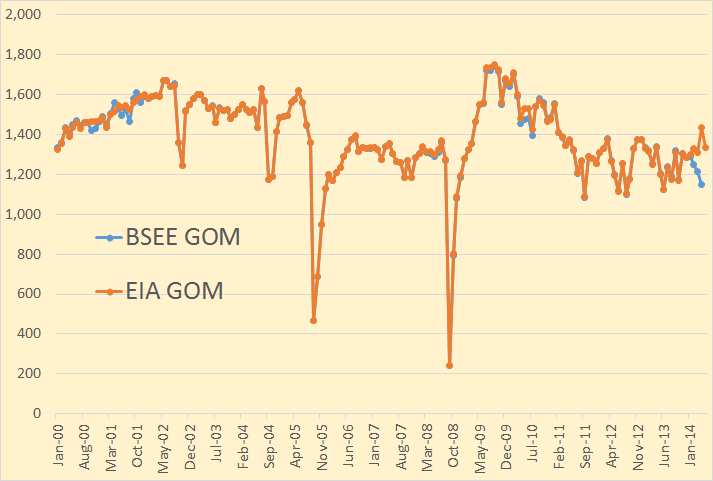
The BSEE is a little like the Texas RRC, that is they report the data they have even though they know it will be revised later. The EIA on the other hand, estimates where they think the data will be after it has all come in. So the chart above shows where they think production in the GOM will be after all the data comes in.

The few deep water leases that I follow seems to have leveled of somewhat. The charts below reflect final data for these platforms. When a company reports their production numbers it is seldom if ever revised. The problem is late reporting, not bad data reported.

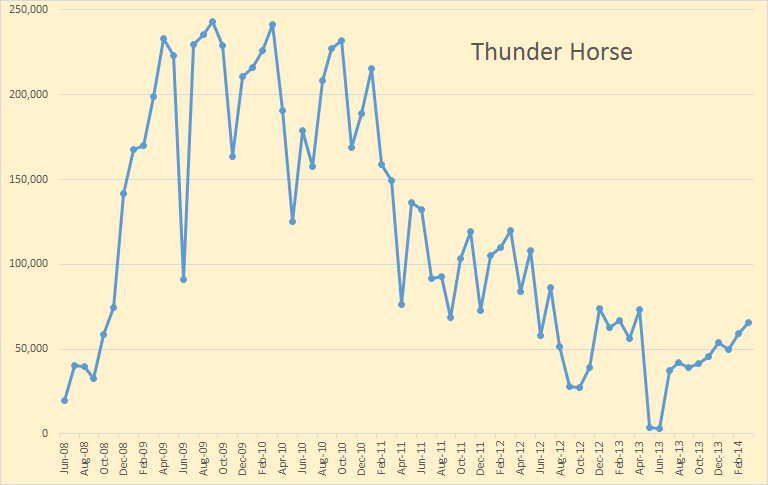
Thunder Horse

Thunder Horse peaked in 2009 and 2010 then declined pretty fast. But after shutting down for maintenance in June and July of last year they seem to have stopped the decline. Thunder Horse produced 65,563 barrels per day in March.

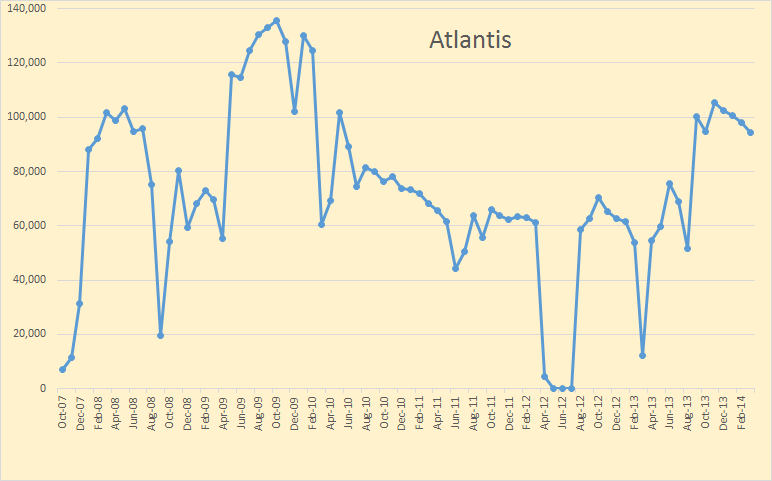
Atlantis

Atlantis has had erratic production throughout its history but as of late has increased production somewhat. Atlantis produced 94,440 bpd in March.

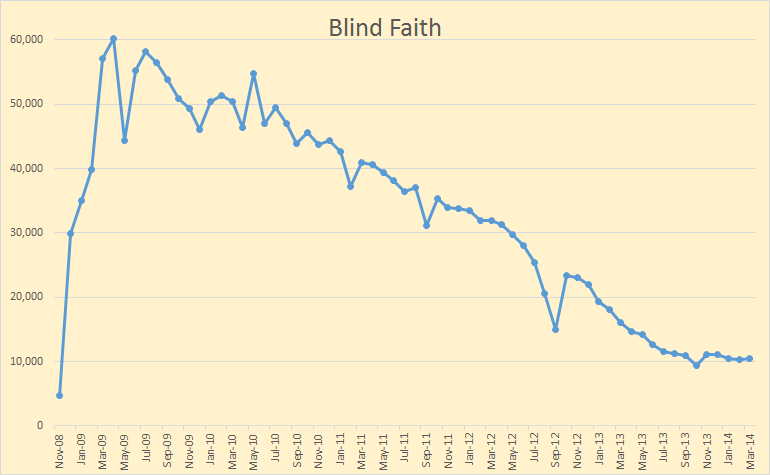
Blind Faith

Blind Faith declined steadily for about three years but has leveled out somewhat now. Blind Faith produced 10,456 bpd in March.

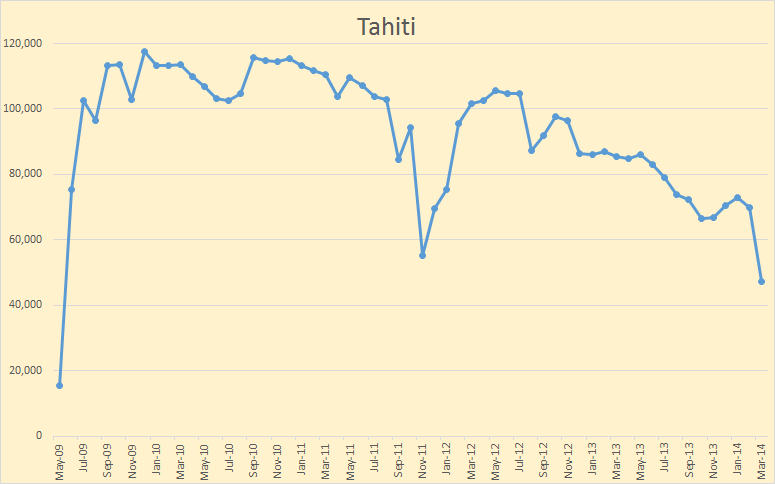
Tahiti

Tahiti held up best of all but has now started to decline a little faster. Tahiti produced 47,273 bpd in March.

News Jacking: 

This article came out last month but is important enough to bring up now.
Washington‘s Shale Boom Going Bust 
(The government, not the state.)

To read the headlines, it seems that the USA has emerged out of the blue to the point of becoming the world’s oil and gas production giant. All thanks to the Shale Revolution. Recently President Obama made various noises that the US could solve the Ukraine gas dependency on Russian gas because of the spectacular growth of extracting natural gas, and more recently, oil, from shale rock formations across the US. There’s only one thing wrong with this picture—“It ain’t gonna happen…”

I don’t recall anything about Obama and oil in the news, but the author of the article is correct, it ain’t gonna happen.

No one expects the President of the US to have the time or the scientific background to delve into the geophysical complexities of shale energy. He naturally relies on competent advisers. What if the advisers, instead of being competent, like in so many government agencies today, are in the sway (and sometimes perhaps pay) of the shale energy companies and their Wall Street investment bankers who have hundreds of billions of dollars riding on promoting the shale hype?

The current US Shale boom is being sustained on steroids, otherwise known as the Fed’s never-ending Quantitative Easing zero-interest-rate policy, a stance that shows no sign of reverting to normal interest rate levels as the economy continues to be depressed since the collapse of the 2007 real estate mortgage securitization bubble. In effect, shale drillers are able to keep in business only because Wall Street and other investors continue to throw money at them like it was falling from trees. Tim Gramatovich, chief investment manager for Peritus Asset Management LLC, an $800 million fund, notes, “There’s a lot of Kool-Aid that’s being drunk now by investors. People lose their discipline. They stop doing the math. They stop doing the accounting. They’re just dreaming the dream, and that’s what’s happening with the shale boom.”

That is really a great article. Some folks are getting the message and some are still spreading bullshit.

Tight Oil, Shale Gas to Drive Lower 48 Production from RigZone.

Wood Mackenzie estimates that 21 billion barrels of light sweet crude oil will be ultimately recovered from the Bakken and Three Forks play in the Williston Basin, higher than the U.S. Geological Survey’s (USGS) April 2013 updated estimate of 7.4 billion barrels

Got that? 21 billion barrels! That is 20 billion barrels more than the area has already produced. The Bakken, this year,reached the 1 billion barrel mark, in cumulative production, two thirds of that in the last three years. If the Bakken were to reach 1 million barrels per day, and hold production at that level, then it would take 55 years to produce that other 20 billion barrels. From Wood Mackenzie no less!

From Wiki: Wood Mackenzie is a global energy, metals and mining research and consultancy group with an international reputation for supplying comprehensive data, written analysis and consultancy advice.

It makes absolutely no sense that anyone with even the slightest knowledge of shale production in the Bakken could come up with such a very stupid estimate. Why would Wood Mackenzie make such a silly prediction? They have to know that is absurd. If they don’t then they deserve to lose every client they have.

But the IEA is slowly but surely getting the message. There have been numerous reports lately about the IEA warning of how much oil OPEC is going to have to come up with to meet the estimated future demand for oil. Here, from the IEA’s web site, is an article that estimates how much it is all going to cost, else… who knows?

World needs $48 trillion in investment to meet its energy needs to 2035

But only about half that is for oil, the other half is for power generation, transmission and $8 billion for energy efficiency. In other words we have to keep throwing money at this problem, a lot of money, about $2.3 trillion per year. What this tells me is the economies of the world, or most of them anyway, must remain sound and strong and that goes for the world currencies as well. If there is a hiccup, like the scare of peak oil throwing panic into the markets, then the whole thing could go to hell in a hand basket pretty fast.


EIA Petroleum Supply Monthly

0
0

The EIA has released its Petroleum Supply Monthly with C+C production numbers through May 2014. Of all the EIA data releases this seems to be the most accurate. However in some cases it is only as good as a few EIA employees guesses. And the more state data they have to work with, the better their guess.

The data in this report goes back to 1920 for total US production and to 1981 for individual states and offshore production. However I have chosen to shorten the time frame for my charts in order to better show what has happened recently.

USA

US production was down 36,000 bp/d in May to 8,357,000 barrels per day. US production took off in mid 2011 when Shale production took off and has risen some 3,300,000 since. Of course there was shale production prior to this but it was only keeping US production on a relatively flat plateau.

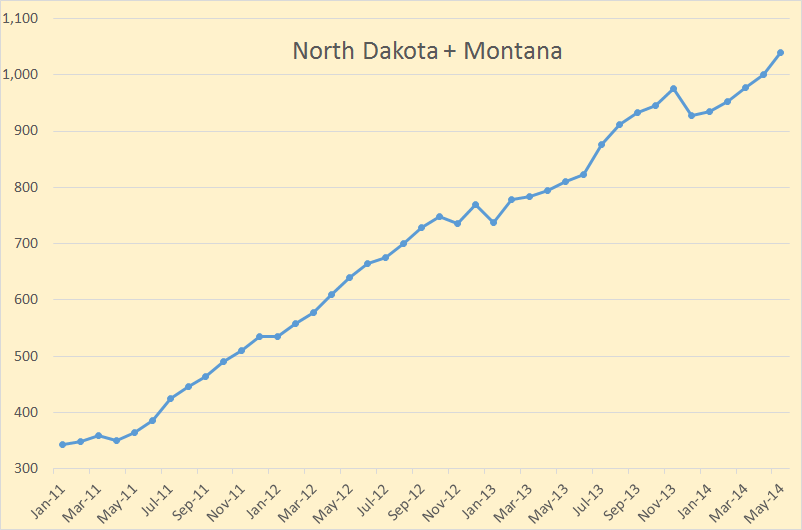
ND and Montana

Everyone is interested in the Bakken so I have combined the two Bakken states. Of course there is production in these two states outside the Bakken but this is the best I could do. Note that when the Bakken has one bad month as they had in December, it takes several months to get back to their prior production level.

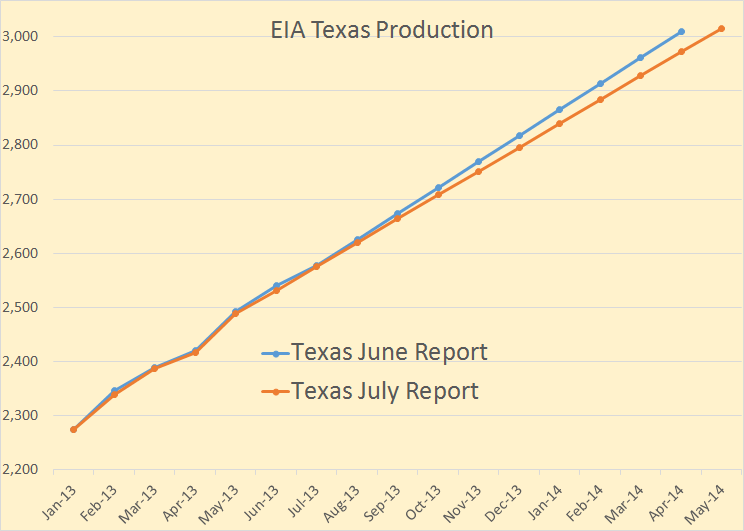
Texas 2

Here is the most interesting chart. The EIA has Texas C+C production growing at exactly 44,000 barrels per day for 12 months straight. But last month they had Texas growing at 48,000 barrels per day for 8 months straight. A few months before that they had Texas production growing at 50,000 barrels per day for about 8 months straight.

The reason they have to estimate Texas growth is the EIA gets all their information from the individual states, or the BSEE for all offshore production. Texas gives oil companies up to two years to report their production so therefore Texas production numbers are always incomplete… so they just estimate what they think it will be.

I estimated, last month, that Texas C+C production was increasing by about 40,000 barrels per day per month.

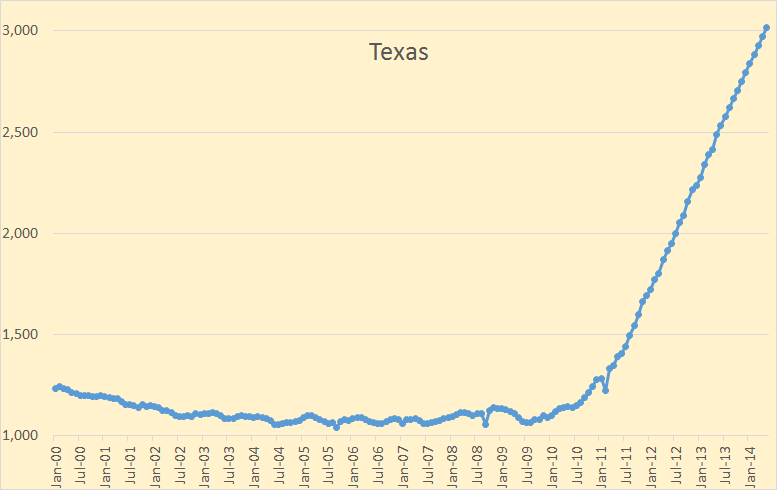
Texas 1

This is Texas C+C from 2000. The shale revolution started to increase Texas production in early 2010.

Tight Oil Prediction 2

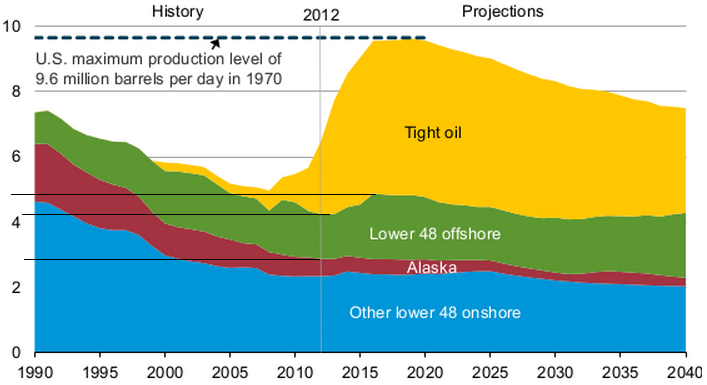
This chart shows where the EIA expects US C+C production to be when they expect it to peak in 2016. They expect C+C production to top out at about 9.6 million bpd. They expect Tight oil to be approximately half of all US production. That would be 4.8 million bpd. They expect offshore production to be 2 million bpd, up from approximately 1.35 million bpd today, 1.3 million bpd in the GOM and 50 thousand bpd in the Pacific.

To get to 2 million offshore we need an increase of approximately 650,000 bpd by 2016.

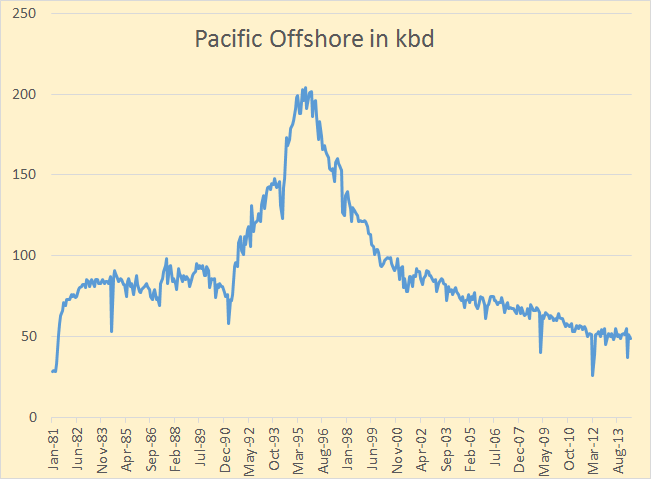
Pacific Offshore

Pacific offshore is in decline so all that increase would have to come from the Gulf of Mexico.

GOM BSEE

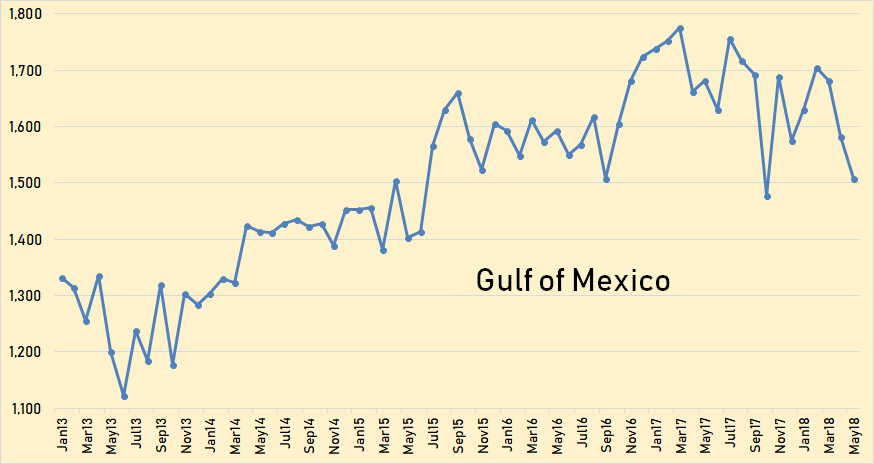
The BSEE, like Texas, sometimes reports incomplete data. But the BSEE data is a lot closer than it appears here. Here the EIA data is through May but the BSEE data is only through April. The EIA is showing the last four months above 1,300 kbd. However when the final BSEE data comes in, it is a very good bet that all four months will below 1,300 kbd. The EIA just appears to be wishing the numbers higher.GOM 2

I consider it extremely unlikely that the GOM will reach 2 million barrels a day by 2016.

US production, in May, was about 1,250,000 below the point where the EIA thinks it will peak at in 2016. 9.6 million barrels per day is what they expect the average daily C+C production to be in 2016. So to get there we only need to have an average increase of about 50,000 barrels per day per month. In the past 24 months the US increase in C+C production has averaged 84,000 barrels per day per month. So the EIA believes we will not do quite as well in the next two years as we have done in the past two years.


World Oil Output Last 3 Years

0
0

The EIA publishes every possible energy stat for the USA and hardly anything for the rest of the world. Well, anything current for the rest of the world anyway. Their International Energy Statistics is already five full months behind and working on six. December 2014 is the last international oil production data we have.

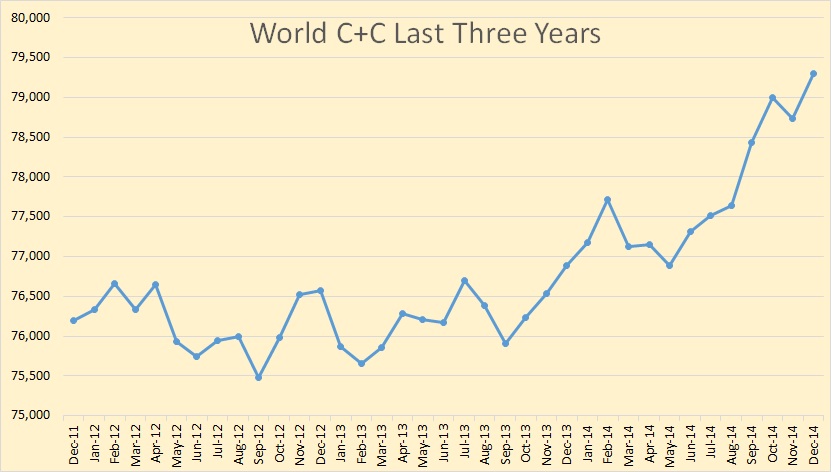
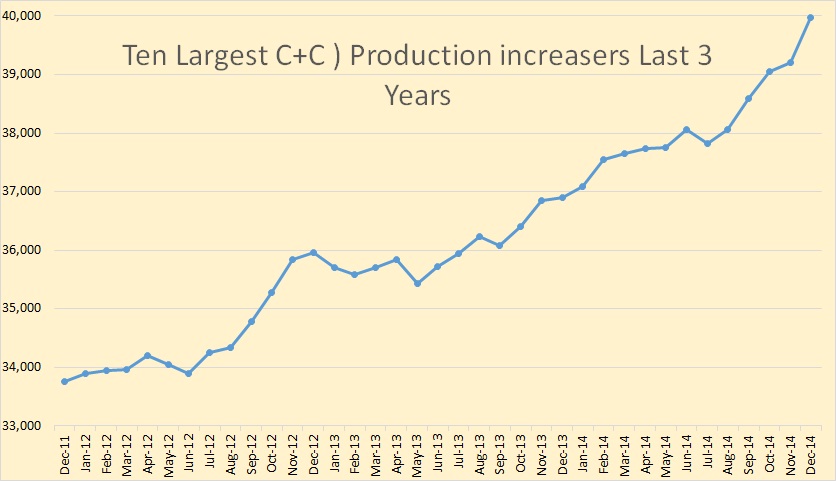
Anyway during this lull in other data I decided to look at the last three years of international data, from December 2011 to December 2014. All data is in thousand barrels per day.Post 1

World C+C production was flat for most of 2012 and 2013 but in late 2013 production took off and has increased by about 3 million barrels per day above the average for 2012 and 2013. December C+C production was 79,300,000 BPD.

Post 4

While total C+C production has increased by 3,000,000 BPD over the last three years the top ten gainers have increased just over twice as much, 6,200,000 BPD.

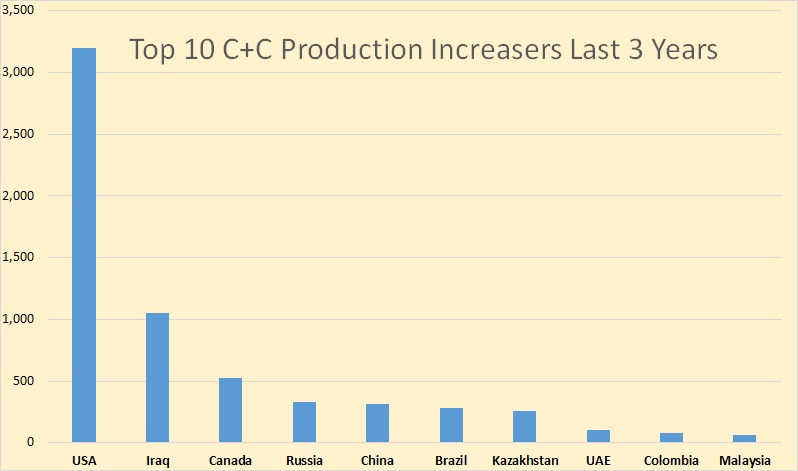
And just who were the big C+C production increasers for the last three years. Keep in mind this is the total change, or increase, over the last three years, not total production.

Post 2

The largest gainer, by a wide margin, was the USA. Iraq and Canada were runners up and the rest were also rans.

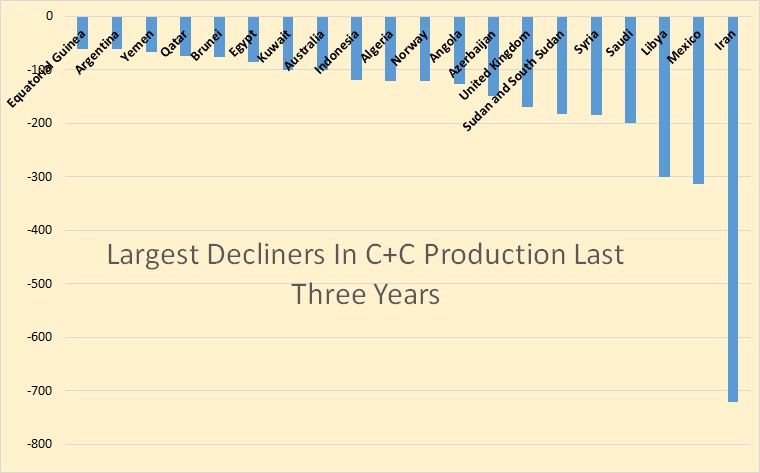
Almost everyone else had declines.

Post 3

Here are the 20 biggest decliners. Iran of course declined the most but surprisingly the second largest decliner was Mexico, not Libya. Saudi, the fourth largest decliner has, since December, increased production by about half a million barrels per day.

Post 5

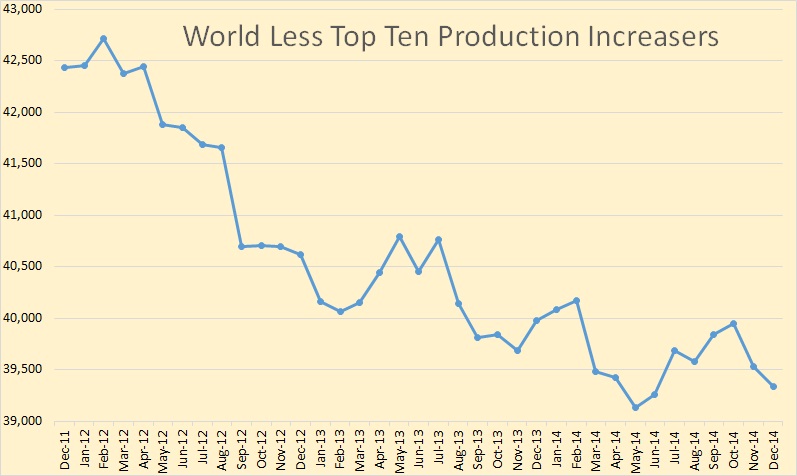
World C+C production minus the top ten gainers has declined by 3,100,000 over the three years 2012 through 2014.

Post 6

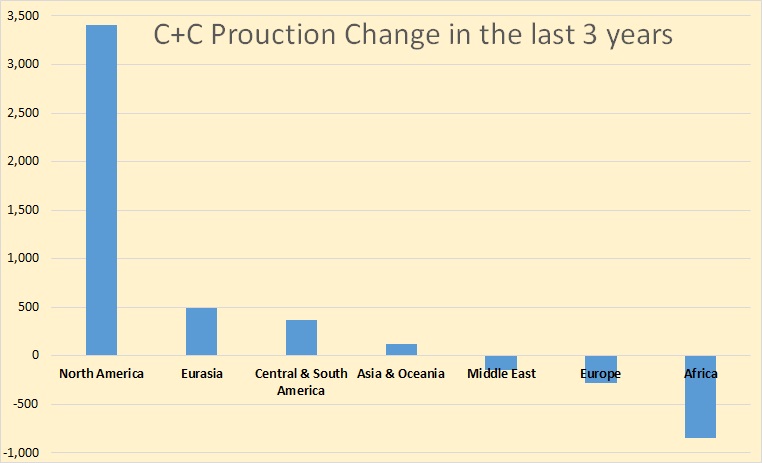
Just for kicks I decided to include production change per geological area over the three years, 2012 through 2014. As you can see it is no contest, North America wins by a large margin. However if we had the last 5 months data this chart would look somewhat different as the Middle East has had a pretty good increase over that period.

And on another subject under the “Do You Believe This” category:

Post 7

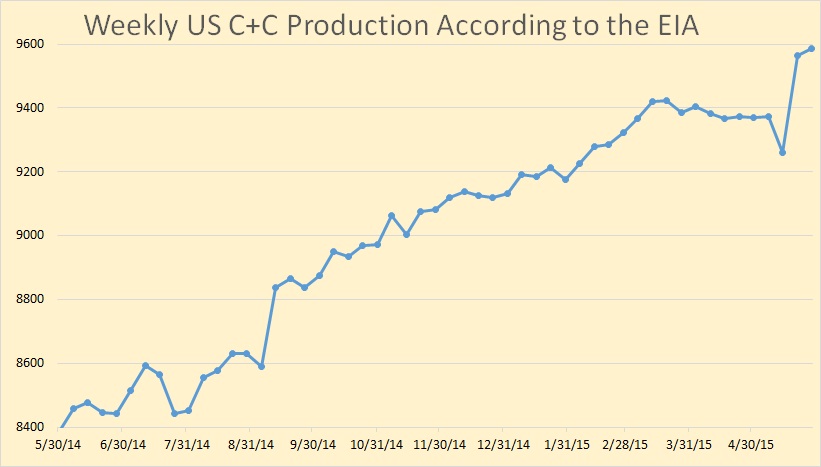
This is the US weekly C+C production for the last 52 weeks with the last data point May 29th. And no, I flat don’t believe it. Here are a few reasons why.

Crude Oil Carload Update

The AAR also reported U.S. Class I railroads originated 113,089 carloads of crude oil in the first quarter of 2015, down 17,982 carloads or 13.7 percent from the fourth quarter of 2014.

First Quarter crude oil shipped by rail is down 13.7 percent from the first quarter of 2014.

Sikorsky to Cut 1,400 Jobs, Citing Falling Oil Production

Sikorsky Aircraft Corp. says it’s cutting 1,400 jobs in the coming year as the helicopter manufacturer faces declining demand for shuttling workers to offshore oil platforms.

A helicopter maker cuts employment by 9.2 percent due to falling offshore oil production. Of course this is all over the world but definitely includes the Gulf of Mexico.

And our neighbor to the north:

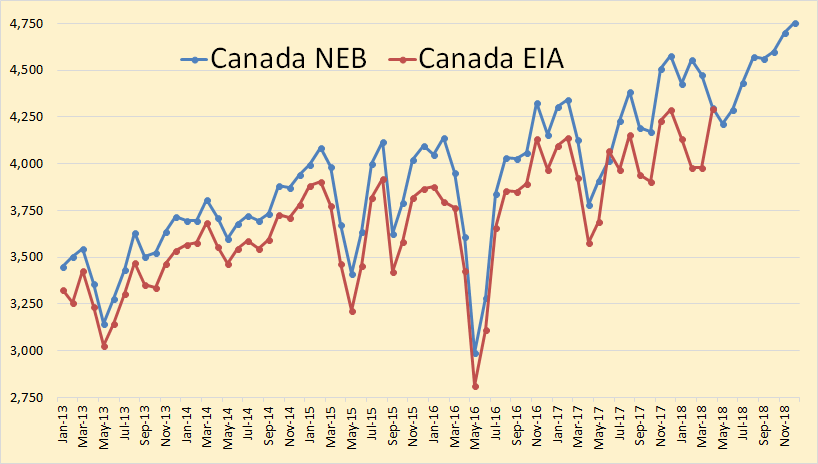
Canada’s crude oil production fell in May to lowest level in almost 2 years, Barclays says

Investment bank Barclays  says a “perfect storm” of events including wildfires and upgrader maintenance in Alberta are expected to have cut average national production to 3.98 million barrels of oil a day in May after peaking at an average of 4.59 million barrels a day in January.

In May Canadian crude production was 610,000 BPD below January production. But apparently even January production was not all that great.

Alberta oil production dropped by 8% between Q3 2014 and Q1 2015

Production of conventional oil and gas in Alberta — excluding oil sands projects – fell by 8% between the third quarter of 2014 and the first quarter of 2015, when oil prices crashed as a result of OPEC’s fight for global market share.

According to research firm CanOils, production fell by 56,880 barrels of oil equivalent a day during the period, primarily because of falling global commodity prices, though pipeline constraints and maintenance also played a role. 

Alberta conventional liquids fell by 56,880 barrels per day during the first quarter 2015 compared to the third quarter 2014. And this was before the wildfires.

One more point:

Post 8

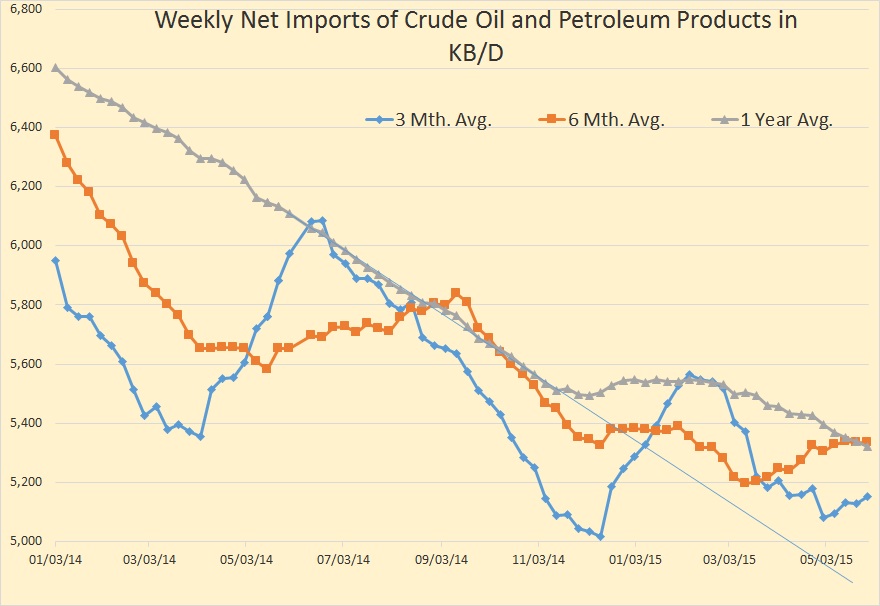
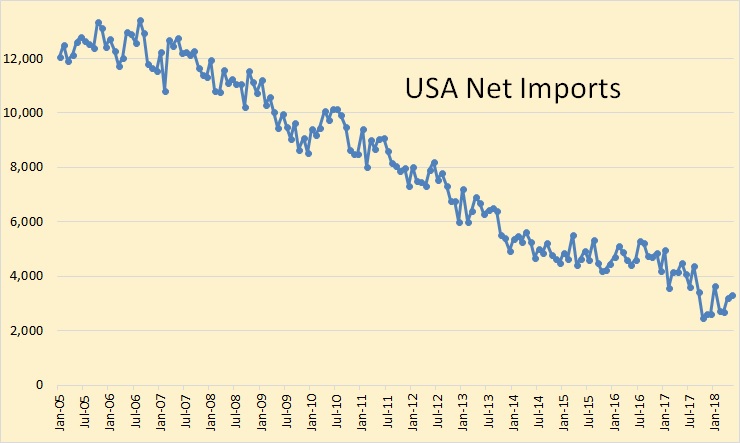
Annual net imports of crude oil plus petroleum products had been on almost a linear decline until late 2014. Now imports have almost flattened out indicating a decline in US crude oil production.

And we made the Top 10 list.

Top Oil and Gas Blogs and News Websites for 2015

___________________________________________________________

Note: If you would like to receive an email notice when I publish a new post, then email me at DarwinianOne at gmail.com .

US Oil Production Finally Starting to Decline

0
0

There has been very little data to post about recently and as everyone should know by now, I post primarily about data. So if there is no data there is not much to post about. Also I have been very busy for the a week now and have checked in only a couple of times.

A few days ago a very racist post was posted on this blog. I completely overlooked it as I seldom scan the posts because I get an email for every post so I just read the posts in the emails. But when there is a guest post, as the one last week was, I get no emails, the guest poster gets them instead. Anyway I deleted the post and banned the poster. I also banned another poster because he accused me of deliberately letting the post stay up. That outraged me. It was the same thing as accusing me of such racism.

Petroleum Supply Monthly

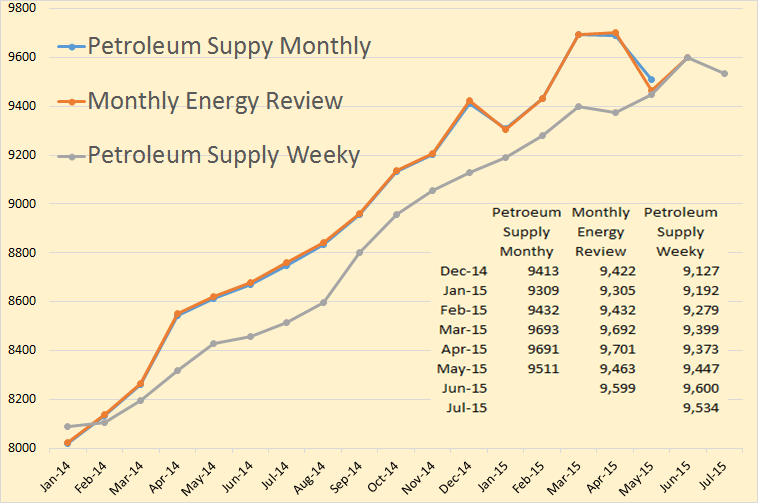
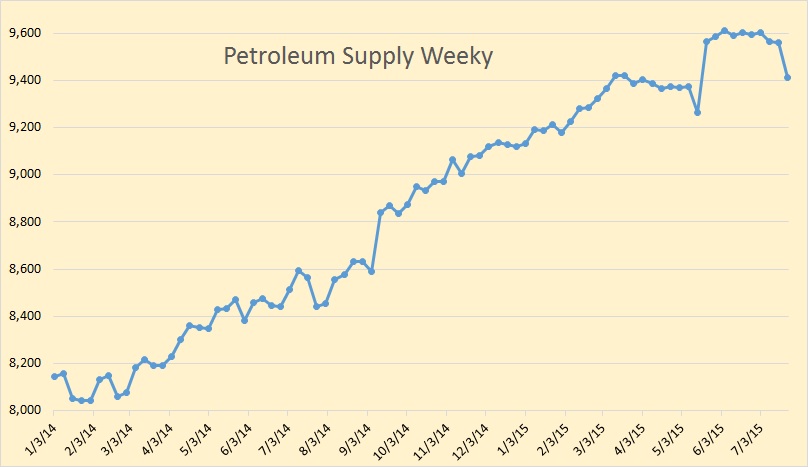
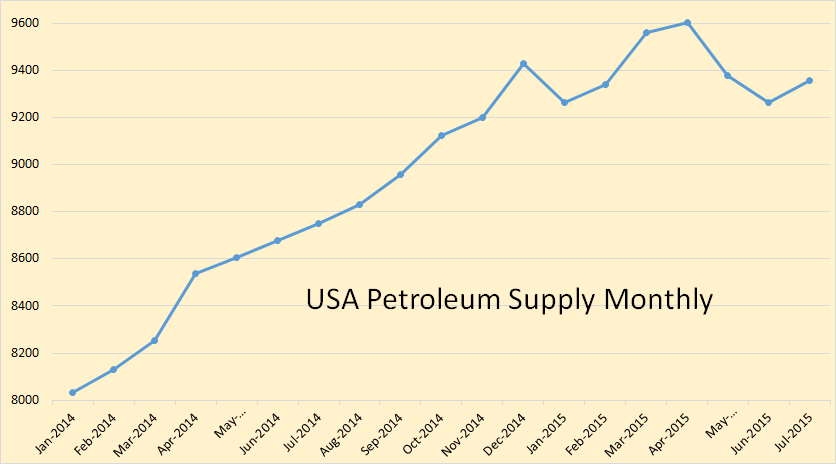
The Monthly Energy Review and the Petroleum Supply Monthly have US production peaking, so far, in March and April. The Petroleum Supply Weekly has US production peaking in June. In the chart above I have averaged the Petroleum Supply Weekly into monthly data. All data is in thousand barrels per day,

Petroleum Supply Weekly

Here we have the weekly data from the Petroleum Supply Weekly. The last data point is July 24th. The huge jumps you see are basically just revisions. The huge jump you see for the week of May 22nd, was not really a jump. The EIA explained that their prior numbers were too low and the sudden increase that week was merely an adjustment.

Texas C+C

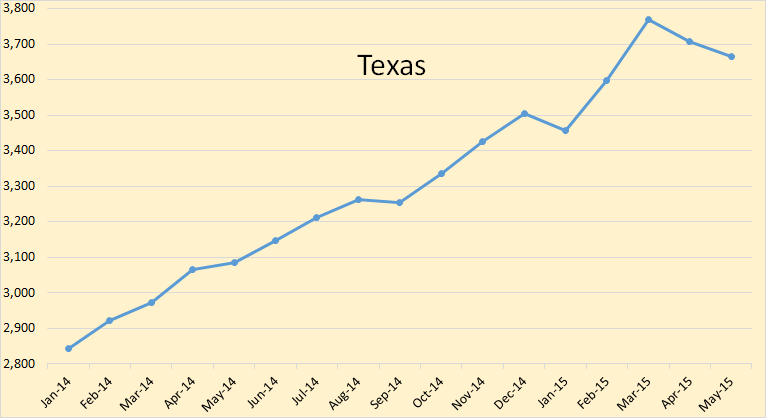
The EIA is finally getting its act together as to Texas C+C production. They have Texas peaking in March at 3,770,000 bpd and declining 106,000 bpd since then.

GOM

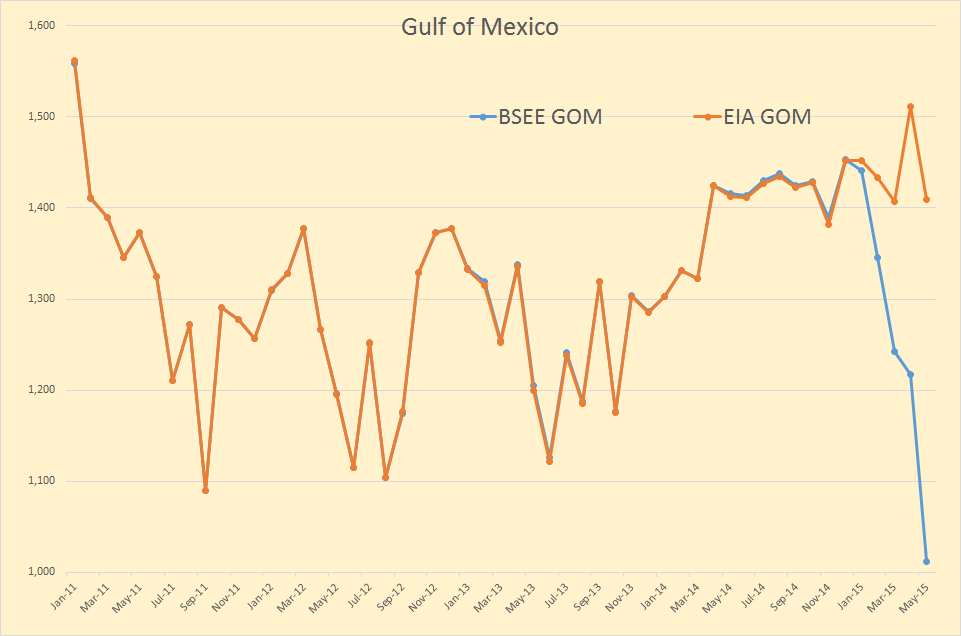
The EIA had the Gulf of Mexico spiking up in April but falling right back in May. The BSEE data, like Texas, is always delayed but only by about four months.

The EIA admits that they show different data but tries to explain it here:
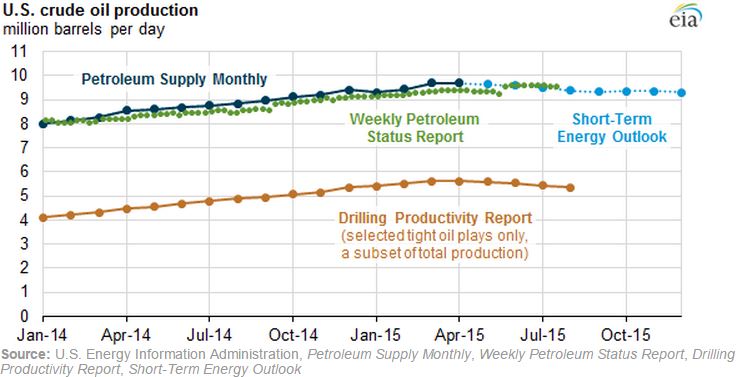
EIA reports show different aspects of U.S. oil production statistics and trends

EIA Crude Oil ProductionEIA publishes several reports covering current crude oil and natural gas production conditions and how recent trends may affect the near-term outlook for the oil and gas industry. Each EIA product is distinct in its purpose, methodology, timeframe, and regional coverage. Some reports are considered estimates of actual production volumes, while others focus on future production.

One analyst suggest the EIA has been fudging the data all along:

EIA Capitulates Under Cover Of Darkness

Many investors know that when a company wants to mitigate media coverage of bad news, they typically release data on a Friday after the close.

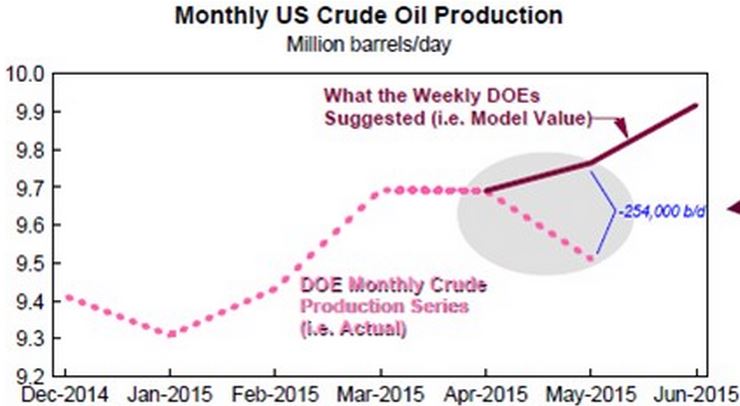
Well last Friday, that is exactly what the EIA did, admitting the very thing I and Cornerstone Analytics have been arguing all year: EIA was and still is overstating U.S. production. The amount that they admitted to so far, as of Friday afternoon, was 254,000 barrels per day (b/d) or 1,778,000 barrels per week, 7,112,000 per month or 14,224,000 for June and July alone.

This is the most incredible cover up I have ever witnessed in my decade-long investment career and I have not seen one major media outlet even mention it so far. Instead China demand & Iran output are front and center as per prior posts in an attempt to divert attention (I call it moving the goal posts) away from the fact that both U.S. production and inventories were about to fall. The chart below speaks for itself on what is occurring:

EIA Capitulates


The EIA Changes Data Collection Methods

0
0

EIA begins monthly survey-based reporting of U.S. crude oil production

With the release of today’s  Petroleum Supply Monthly, EIA is incorporating the first survey-based reporting of monthly U.S. crude oil production statistics. Today’s Petroleum Supply Monthly includes estimates for June 2015 crude oil production using new survey data for 13 states and the federal Gulf of Mexico, and revises figures previously reported for January through May 2015.

From the EIA’s Monthly Crude Oil and Natural Gas Production webpage.

Beginning with the June 2015 data, EIA is providing estimates for crude oil production (including lease condensate) based on data from the EIA-914 survey. Survey-based monthly production estimates starting with January 2015 are provided for Arkansas, California, Colorado, Kansas, Louisiana, Montana, New Mexico, North Dakota, Ohio, Pennsylvania, Texas, Utah, Wyoming, and the Federal Gulf of Mexico. For two states covered by the EIA-914—Oklahoma and West Virginia—and all remaining oil-producing states and areas not individually covered by the EIA-914, production estimates are based on the previous methodology (using lagged state data). When EIA completes its validation of Oklahoma and West Virginia data, estimates for these states will also be based on EIA-914 data. For all states and areas, production data prior to 2015 are estimates published in the Petroleum Supply Monthly. Later in 2015, EIA will report monthly crude oil production by API gravity category for the individually-surveyed EIA-914 states.

This is great news for those of us who have been complaining for years about the EIA’s poor and misleading data collection methods.Petroleum Supply Monthly

June C+C production, according to the Monthly Energy Review, was almost 9.6 million barrels per day. But the Petroleum Supply Monthly cuts that by 303,000 bpd. And they have production dropping by 316,000 barrels per day in the last two months, May and June.

North Dakota

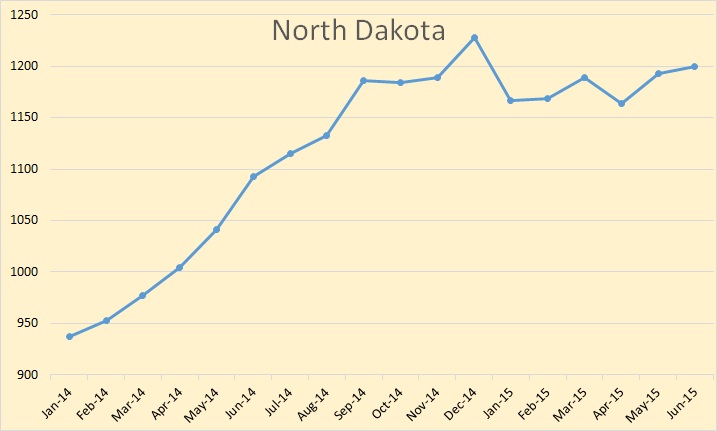
The Petroleum Supply Monthly reports the exact same data for North Dakota as the NDIC reports in their data release.

Texas

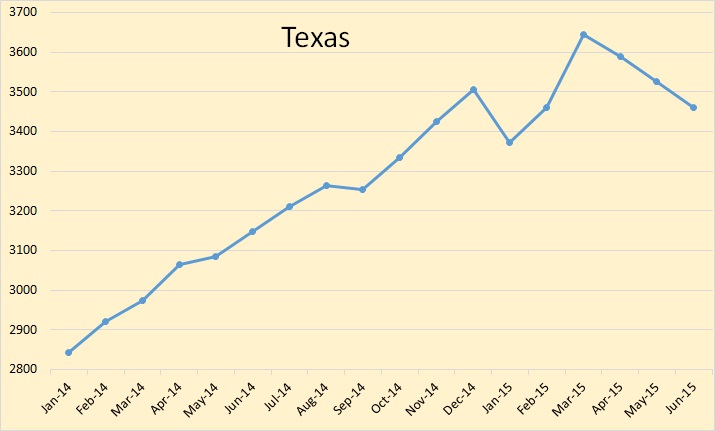
Texas peaked in March at 3,644,000 barrels per day but has since dropped by 184,000 bpd to 3,460,000 bpf.

Alaska

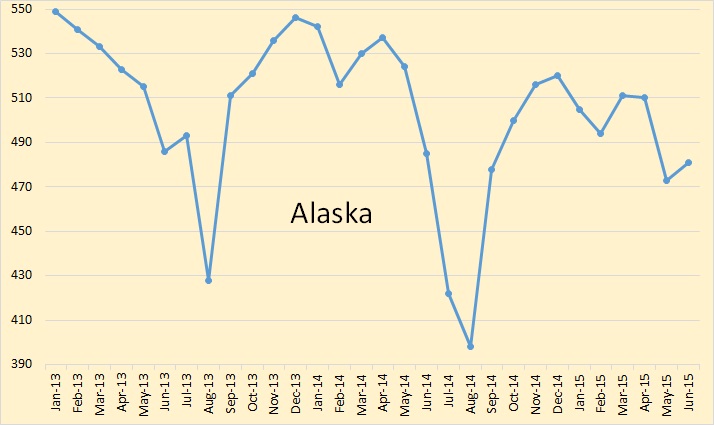
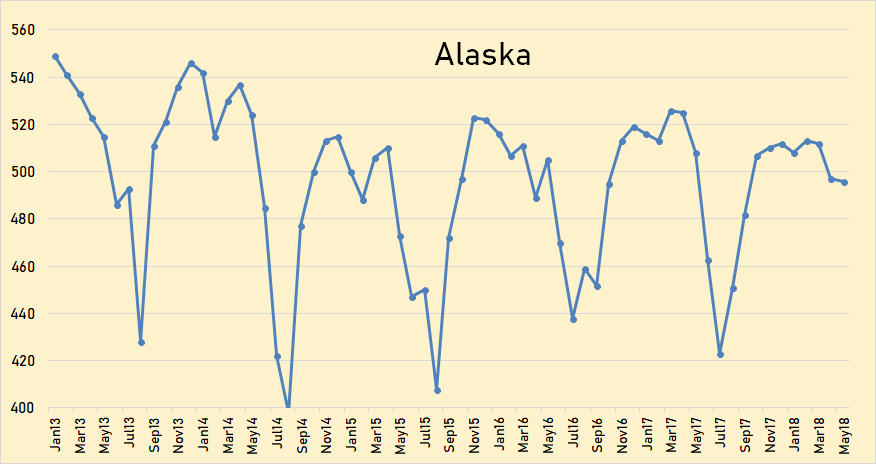
The oil price decline has had little effect on Alaska production. They just continue their sure but steady decline.

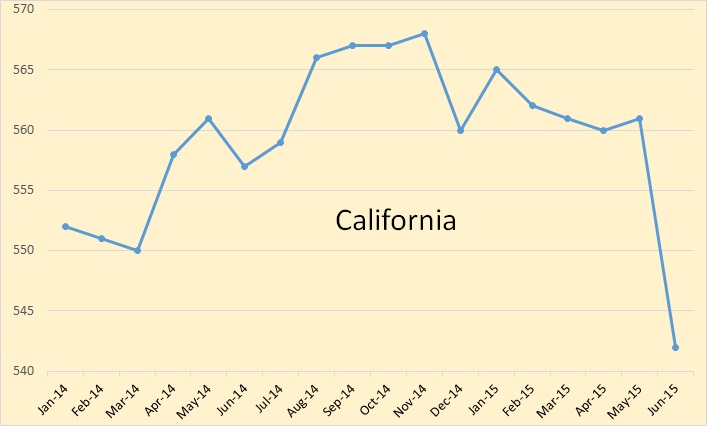
California

California dropped by 19,000 bpd in June.

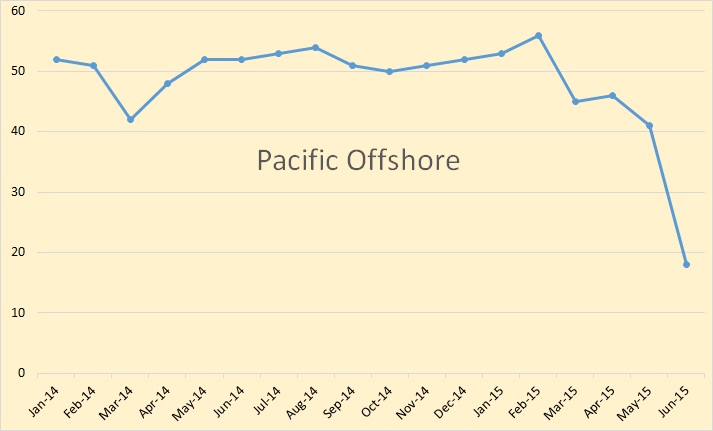
Pacific Offshore

Pacific Offshore is down to 18,000 barrels per day.

GOM

The Gulf of Mexico is trending slightly upward.

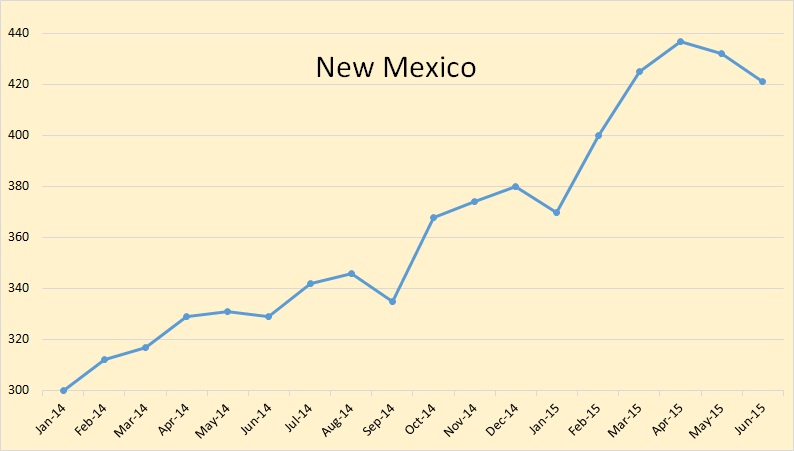
New Mexico

New Mexico, who’s production come partially from the Permian, was bucking the trend through April but has since dropped 16,000 barrels per day to 421,000 bpd.

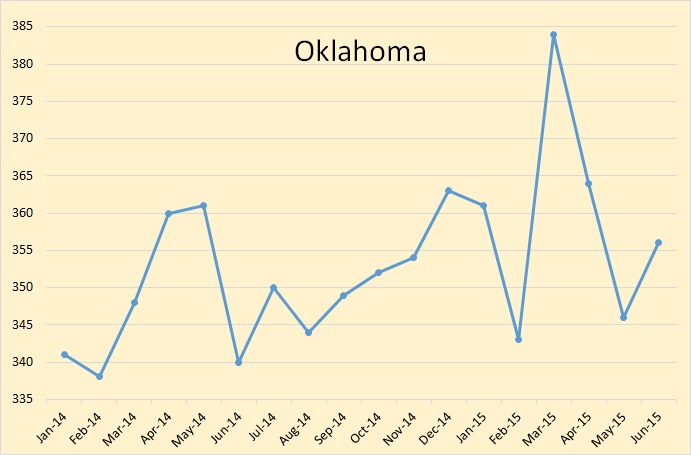
Oklohoma

Oklahoma is not yet part of the new survey method but this estimate is likely very close. They seem to be holding their own despite the price collapse.

Louisana

Louisiana continues its natural decline.

Louisiana

Louisiana once produced 560,000 barrels per day but what happened to Louisiana eventually happens to all producing states and nations.

US Weekly C+C

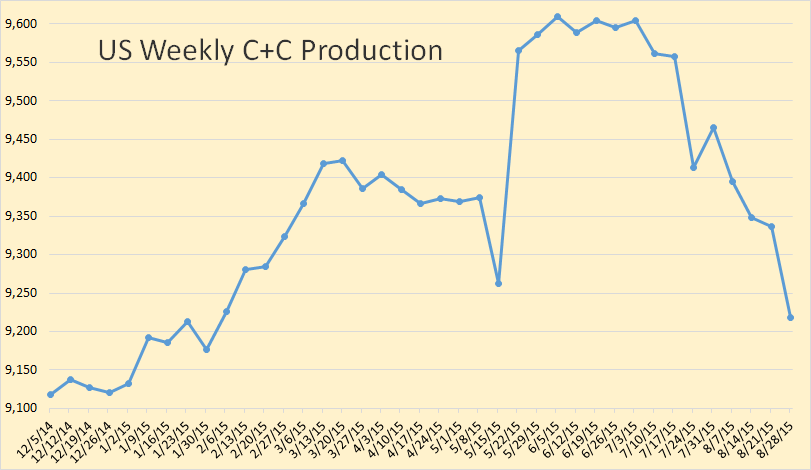
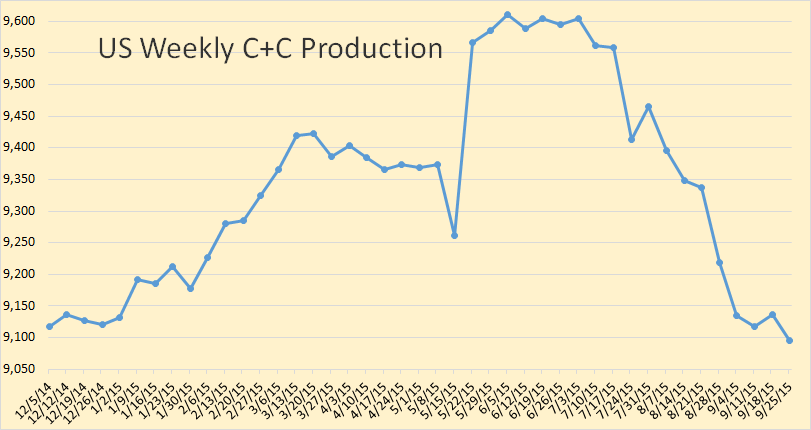
US production was down 119,000 bpd last week. However only 19,000 of that was the lower 48. Alaska was down 100,000 bpd. That was likely due to their usual summer maintenance. The EIA says US C+C production for week ending 8/28/15 was 9,218,000 barrels per day. That is approximately one million barrels per day less than either Saudi Arabia or Russia is producing.

Iraqi Oil Output Declining as of 2018 in Morgan Stanley’s View

Iraq’s crude production will start to decline in 2018 because of a slowdown in investment due to lower oil prices and a costly war on Islamist militants, according to Morgan Stanley.

OPEC’s second-largest crude producer will pump 4.18 million barrels a day in 2017, with output then falling to 4.132 million in 2018 and to 4.127 million by 2020, Haythem Rashed, a Morgan Stanley analyst in London, said in a Sept. 2 report. The bank had previously forecast rising output every year to 4.6 million barrels by 2020.

Iraq’s production has climbed 1 million barrels a day by July from a year earlier, becoming the strongest contributor to global supply, Morgan Stanley said. The removal of export constraints in the south, increased pipeline capacity in the semi-autonomous Kurdish region and the separation of heavy and light crude streams all contributed to growth, according to the report.

“With these infrastructure and crude marketing tailwinds now largely played out, we see limited prospects for further production growth,” Rashed said in the report.

Iraq was one of great hopes for cornucopian crowd. Leonardo Maugeri has Iraq at 7.6 million barrels per day in 2020. They are at 4 mbd today and I don’t expect them to ever reach 5 mbd.

Petroleum Supply Monthly, July Data

0
0

The EIA has just published their Petroleum Supply Monthly with July production data for the USA and all states and territories. There were really no big surprises.

Petroleum Supply Monthly

US C+C production was up 94,000 barrels per day in July to 9,358,000 bpd.

GOM

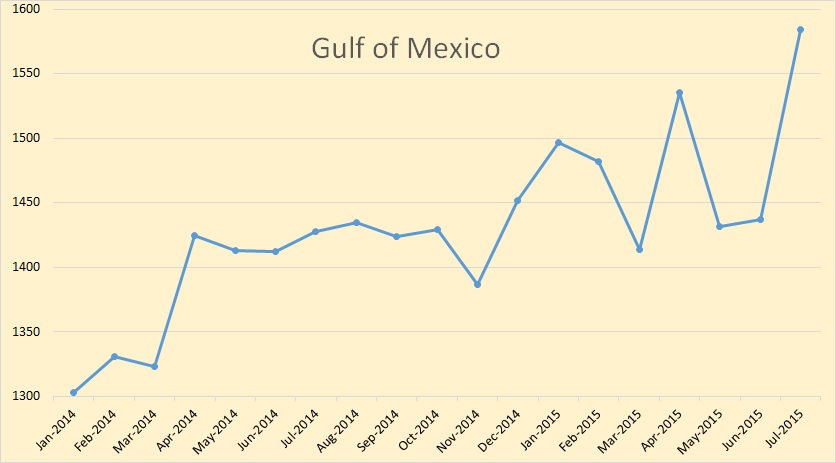
The gain came from the Gulf of Mexico. The GOM was up 147,000 bpd to 1,584,000 bpd. Without the GOM input US production would have been down 53,000 bpd.

Texas

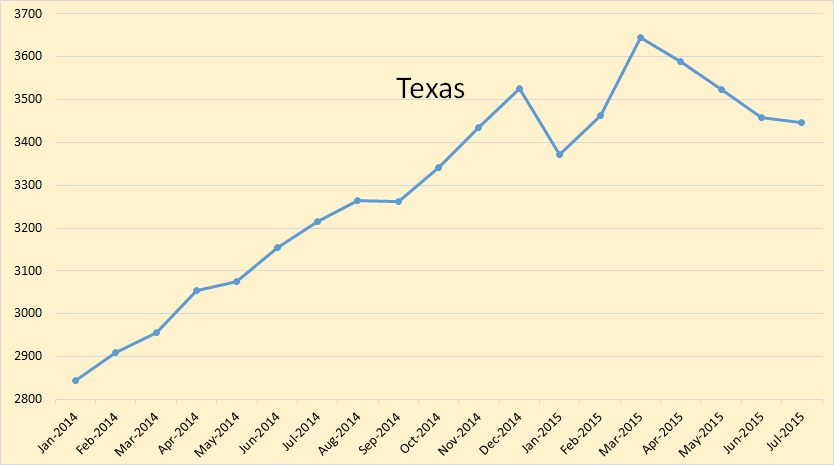
Texas was down but not by much, only 12,000 bpd to 3,447,000 bpd. That is 197,000 bpd below their high in March of 3,644,000 bpd.

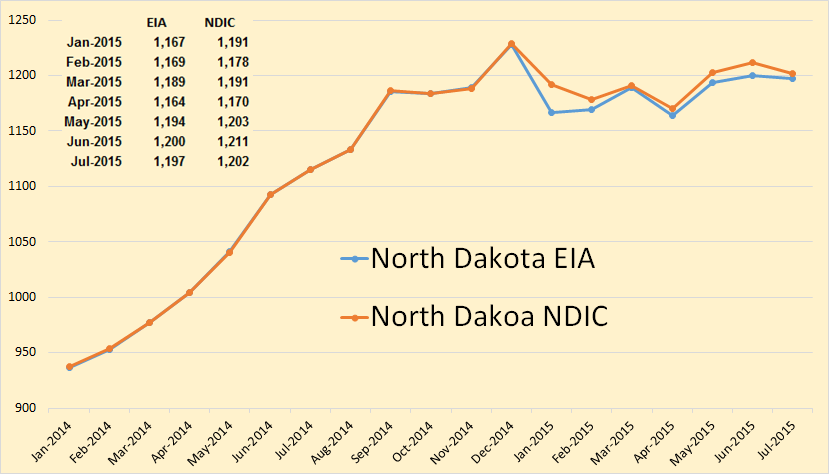
North Dakota EIA

This I don’t understand. The EIA’s now gets its estimates directly from the states yet there is a difference. Perhaps the NDIC had revised their data when the EIA called.

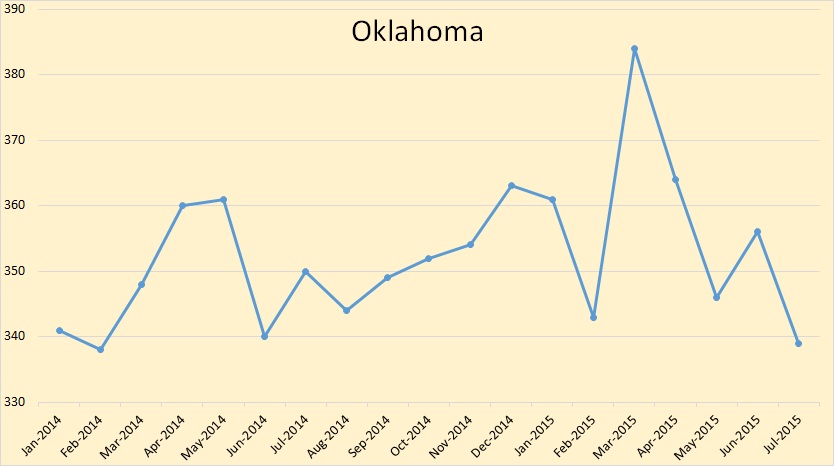
Oklahoma

Oklahoma was down 17,000 bpd to 339,000 bpd.

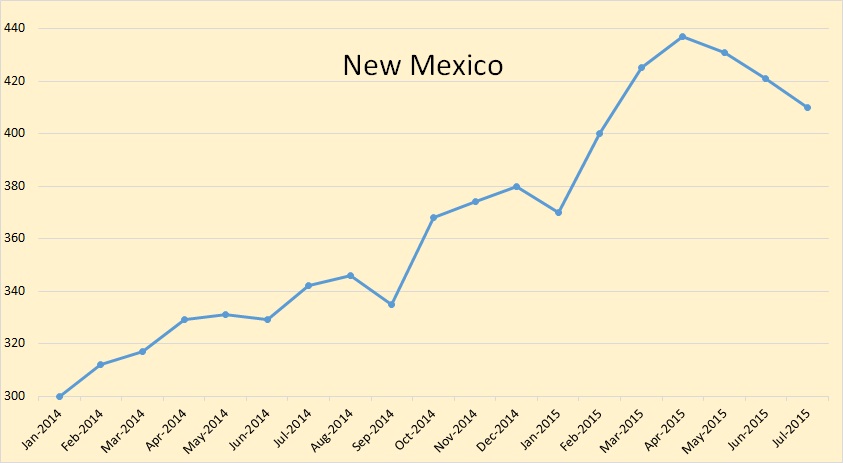
New Mexico

New Mexico was down 11,000 bpd to 410,000 bpd.

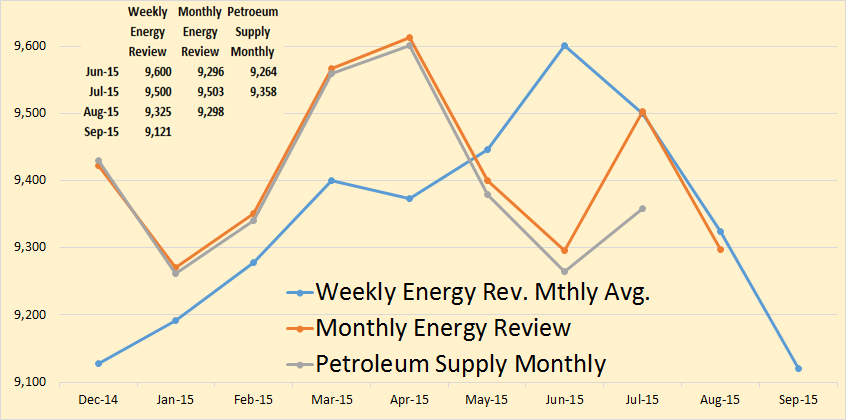
EIA USA

I took the Weekly Energy Review and averaged it into monthly average. As you can see it differs greatly from both the Monthly Energy Review and the Petroleum Supply Monthly. However for the last July and August it agrees pretty closely with the Monthly Energy Review. And it says production dropped just over 200,000 barrels per day from August to September.

US Weekly C+C

This is the weekly data, since December from the Weekly Petroleum Status Report. It has US production dropping every month since June.

I thought the below article said a lot about Russia.

Russian Oil Producers Head for Tax Showdown Amid Output Warnings

Russia’s Energy Ministry estimated last week that oil output would be stable until 2035 at a level of about 525 million metric tons a year, or 10.5 million barrels a day, as investment in new projects offset declines at older fields. If the government approves the planned tax hike, investments could slump by 50 percent and total oil production drop by 100 million metric tons over next three years, Energy Minister Alexander Novak said in an interview to state TV Friday.

“In a lower capex environment, the output decline at mature Russian fields may reach some 5 percent already next year,” Alexander Nazarov, oil and gas analyst at OAO Gazprombank, said by phone. “New projects won’t be able to cushion the total decline.”

They are saying that if they get enough investment in new projects to offset declines in their old fields, then they can keep production flat for the next 20 years. Otherwise they are headed lower. Their old fields will be declining at about half a million barrels per year. I don’t think even if they do get the tax breaks they can come up with that much new oil. And most certainly they cannot do it for 20 years.

Oil Production Is Going To Drop And Oil Prices Are Likely To Increase

0
0

Rystad Energy, an independent oil and gas consulting services and business intelligence data firm in Oslo, Norway, has online, a wealth of information concerning upstream oil production projects and costs. Some of it is a bit dated but some of their charts date from late 2015.

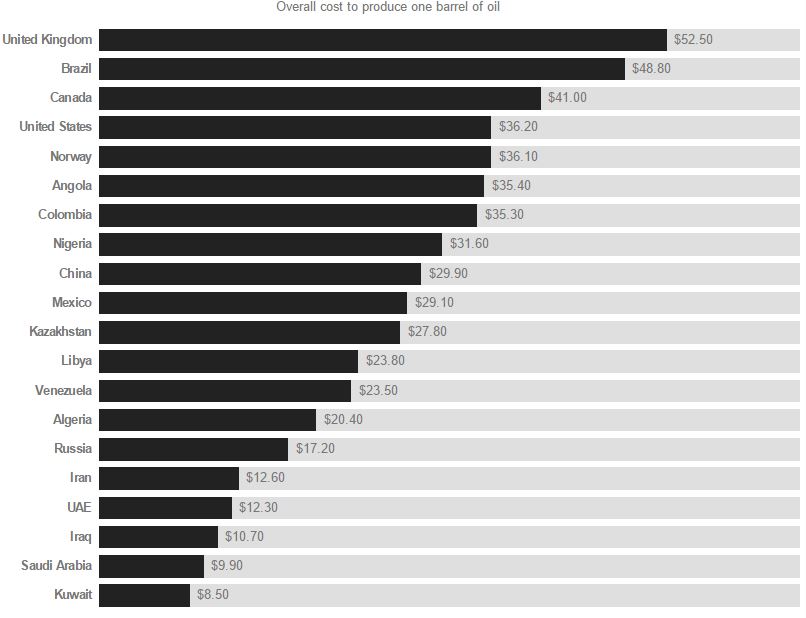
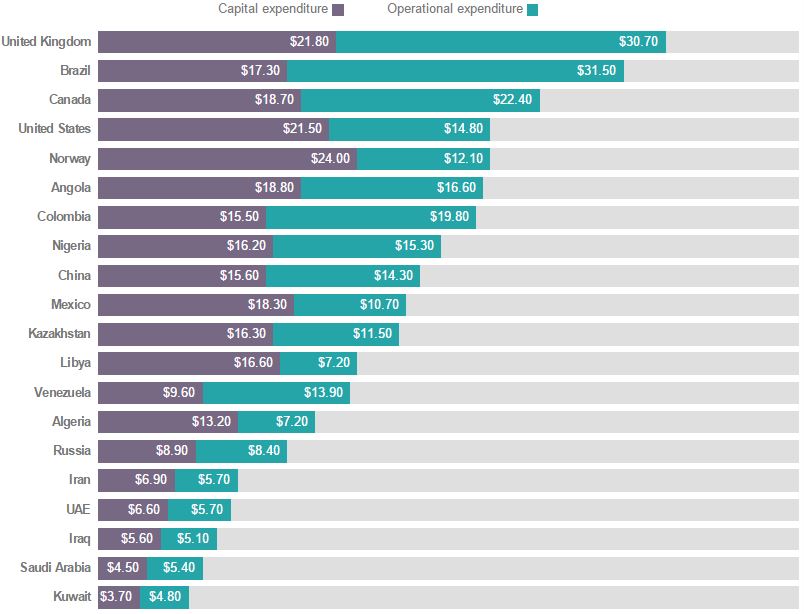
The two below Rystad charts were published by CNN Money on November 23, 2015.

Costs, Overall

This is overall or average cost, not marginal cost. It cost Canada $41 to produce a barrel of oil but only cost Russia $17.20. I guess that is why Canada is cutting back but Russia is not.

Costs, Breakdown Here is the breakdown between capital expenditures and operational expenditures. Why would the United Kingdom’s operational expenditures be two and one half times those of Norway? After all, they are both drilling basically the same oil field.

So why is not the price of oil having a more dramatic effect on production? Well it is, it just takes a while. Here are some plans from about a year and a half ago, when the price of oil was much higher.

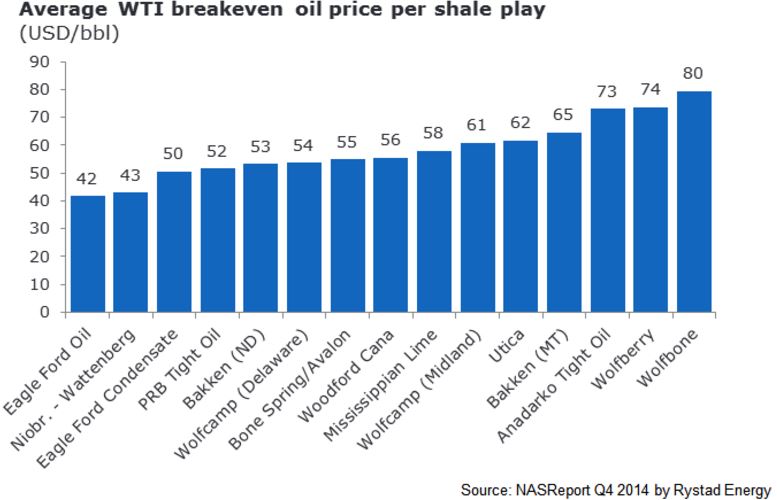
Rystad published the two below charts in their US Shale Newsletter in January 2015 but the data dates from the 4th quarter of 2014, just as the price of oil had started to drop.

Cost per Play

At that time Bakken (ND) had a break even price of $53 while Eagle Ford oil had a break even price of $42 and Eagle ford condensate a break even price of $50.

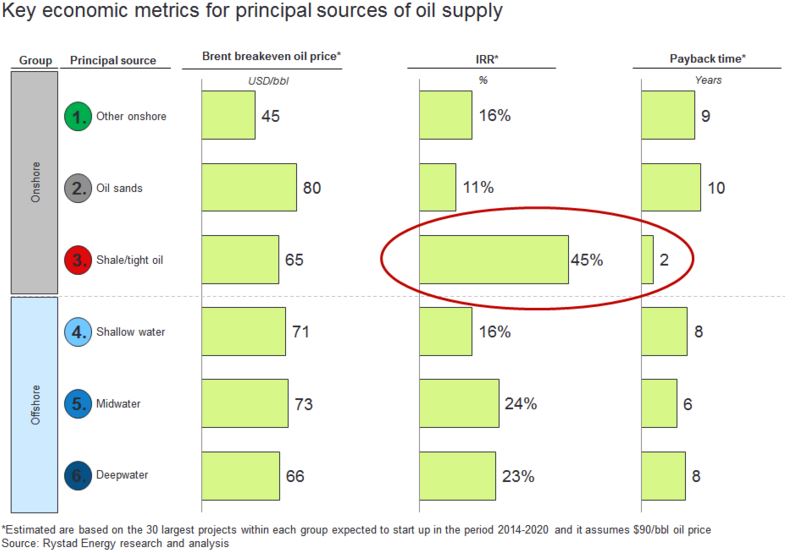
The below chart, from the same newsletter, assumes $90 a barrel oil.

Costs, Startup

Shale oil, at the time, had an average break even price of $65 a barrel, which would have given them a 45% internal rate of return and a payback time of only 2 years. It is amazing how much things have changed in just a little over a year.

But by October 2015 things had changed dramatically.

Exclusive: Offshore oil output to plunge as producers scrap field upgrades

Global offshore oil production in aging fields will fall by 10 percent next year as producers abandon field upgrades at the fastest rate in 30 years, in the first clear sign of output cuts outside the U.S. shale industry, exclusive data shows.

A drop in oil prices to half the level of a year ago has forced producers to slash spending and scrap mega projects that can take up to a decade to develop, but they are also taking less visible steps to cut investment in existing fields that will have an immediate impact on global supplies.

There have been few signs of how cost cuts of around $180 billion will impact near-term production until now. They could erode the glut that has forced down prices, and help balance global production and demand by the middle of next year or earlier, Oslo-based oil consultancy Rystad Energy said.

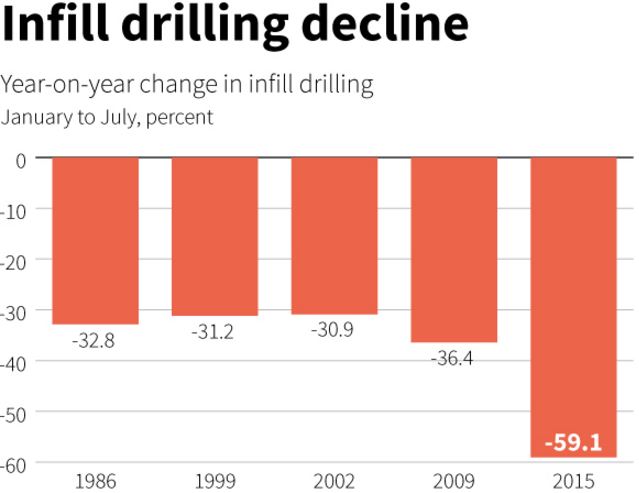
Data provided exclusively to Reuters by Rystad show a sharp decline in investment to upgrade mature offshore oil fields in order to arrest their natural decline, in what is known as infill drilling.(Graphic: link.reuters.com/xaz75w)

Costs, Infill Drilling Decline

The above chart shows the decline in infill drilling due to previous drops in the price of oil. The data is from the Gulf of Mexico, Southeast Asia and Brazil. The decline in infill drilling in 2009 was the largest… until now. The first half of 2015 saw the largest decline in offshore infill drilling in history.

In three major offshore basins — the Gulf of Mexico, Southeast Asia and Brazil — infill drilling dropped by 60 percent between January and July this year compared with the same period last year, according to the Rystad Oil Market Trend Report, whose data is based on company data and regulatory filings.

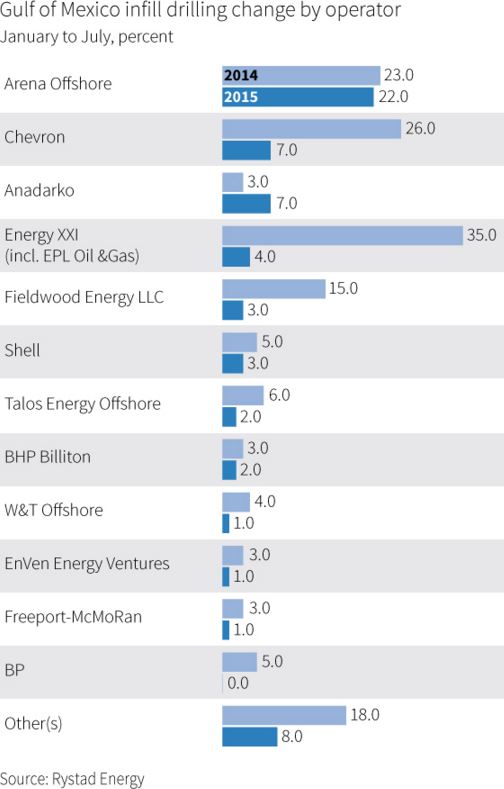
For example, according to the data, in the Gulf of Mexico, infill drilling on mature wells dropped from 149 wells between January and July 2014 to a total of 61 wells during the same period this year.

Based on this trend, Rystad Energy estimates that global offshore oil production in mature field will decline next year by 1.5 million barrels per day (bpd), or 10 percent, to 13.5 million bpd from 15 million bpd in 2015.

Costs Infill drilling 1

The above chart is change per operator, just in the GOM. And this was just in the first half of 2015 when the price of oil averaged about $56 a barrel. What is it now when the price of oil is over $20 a barrel lower?

Well, just since June Wood Mackenzie says the latest figures show that the amount of deferred capital spending on projects awaiting approval has almost doubled from $200bn to $380bn, with 2.9m barrels a day of liquids production now not due to come on stream until early in the next decade.

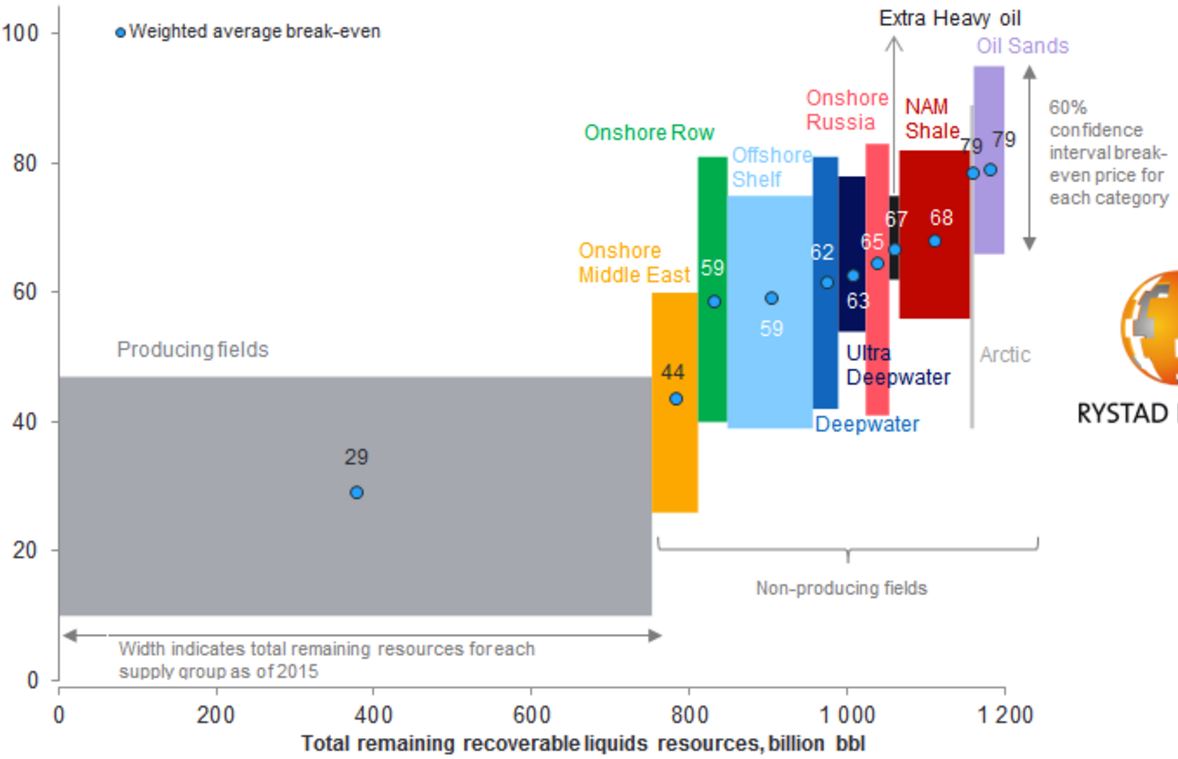
Global liquids cost curve (October 2015)

Costs, Reserves Left

*The break-even price is the Brent oil price at which NPV equals zero using a real discount rate of 7.5%. Resources are split into two life cycle categories: producing and non-producing (under development and discoveries). the latter is further split into several supply segment groups. The curve is made up of more than 20,000 unique assets based on each asset’s break-even price and remaining liquids resources in 2015.
Source: Rystad Energy UCube September 2015

What the above chart tells me is that it now costs a lot more to produce a barrel than it once did. And… unless crude oil hits at least $60 a barrel soon a lot more projects will have to be cancelled. But… all that being said, I think it is now obvious that oil production will drop, rather dramatically, beginning sometime in 2016. And that drop will lead to a rise in the price of oil, at least to $60 a barrel and likely higher.

That is unless some black swan event happens. That could be a collapse in several economies of the world… or a collapse of the economy in one country, China. In other words, it is a given that production is going to decline. So if demand stays constant, or rises, then the price of oil will definitely rise. We know what is going to happen to supply. We have no idea what is going to happen to demand. But if BAU continues as normal, the price of oil is going up.

Peak Oil Is Back

0
0

Where did all the oil go? The peak is back

An extensive new scientific analysis published in Wiley Interdisciplinary Reviews: Energy & Environment says that proved conventional oil reserves as detailed in industry sources are likely “overstated” by half.

According to standard sources like the Oil & Gas Journal, BP’s Annual Statistical Review of World Energy, and the US Energy Information Administration, the world contains 1.7 trillion barrels of proved conventional reserves.

However, according to the new study by Professor Michael Jefferson of the ESCP Europe Business School, a former chief economist at oil major Royal Dutch/Shell Group, this official figure which has helped justify massive investments in new exploration and development, is almost double the real size of world reserves.

Wiley Interdisciplinary Reviews (WIRES) is a series of high-quality peer-reviewed publications which runs authoritative reviews of the literature across relevant academic disciplines.

According to Professor Michael Jefferson, who spent nearly 20 years at Shell in various senior roles from head of planning in Europe to director of oil supply and trading, “the five major Middle East oil exporters altered the basis of their definition of ‘proved’ conventional oil reserves from a 90 percent probability down to a 50 percent probability from 1984. The result has been an apparent (but not real) increase in their ‘proved’ conventional oil reserves of some 435 billion barrels.”

Global reserves have been further inflated, he wrote in his study, by adding reserve figures from Venezuelan heavy oil and Canadian tar sands – despite the fact that they are “more difficult and costly to extract” and generally of “poorer quality” than conventional oil. This has brought up global reserve estimates by a further 440 billion barrels.

Jefferson’s conclusion is stark:Put bluntly, the standard claim that the world has proved conventional oil reserves of nearly 1.7 trillion barrels is overstated by about 875 billion barrels. Thus, despite the fall in crude oil prices from a new peak in June, 2014, after that of July, 2008, the ‘peak oil’ issue remains with us.”

The study referred to here is: Overview A global energy assessment

Michael Jefferson

Against the background of IIASA’s massive (their word) ‘global energy assessment’ (GEA), this paper takes a closer look at the challenges posed by population growth, energy poverty, the fossil fuels and carbon storage, renewable energy, energy efficiency, natural catastrophes, and potential climatic change to offer a somber, although arguably more realistic, overview of what the future may hold than the GEA achieved. © 2015 John Wiley & Sons, Ltd

I thought the above article worth a post of its own. After all it is a vindication of what many of us have been saying for years now. And I especially call your attention to the line: “the standard claim that the world has proved conventional oil reserves of nearly 1.7 trillion barrels is overstated by about 875 billion barrels.” 

That puts conventional reserves at about 825 billion barrels. That is OPEC + Non-OPEC, that is everything, well, everything conventional. That is almost exactly the amount of reserves I have been claiming for years. I have been thrashing this straw for over a decade and it feels good to get some vindication.

Here are a couple of other peak oil articles in the news this week:

What GAO Peak Oil report?

On March 29th, the Government Accountability Office (GAO), also referred to as the ‘congressional watchdog’, released a much-anticipated report called Crude Oil:Uncertainty about future oil supply makes it important to develop a strategy for addressing a peak and decline in oil production.

This report was initiated by a request, just over a year ago, from Congressman Roscoe Bartlet, a very vocal proponent of the peak oil theory in the US Congress.

The significance of this report cannot be under-stated. For the first time in North America, an independent and nonpartisan agency that works for Congress and the American people has gone on record stating that peak oil is a real and pressing concern that the government should be preparing for.

Timing of the peak all-important

 Strange new economic phenomena will kick in the moment oil production peaks, turning normal national finance ministry policies on their heads

The reason there is such heated debate over when exactly peak oil is due to arrive is because, at the point of the peak, the fundamental laws of economics governing oil production, consumption, and prices, will flip over to a whole new paradigm. And because oil is very much the key commodity at the root of all economic activity in the modern industrial world, the flip-over of economic laws governing oil will deeply affect, and even potentially flip over, the fundamental economic laws governing all the world’s industrial activity.

And… I thought I would just add a couple of charts taken from the EIA’s latest <a href=”http://www.eia.gov/forecasts/steo/”>Short-Term Energy Outlook</a>.

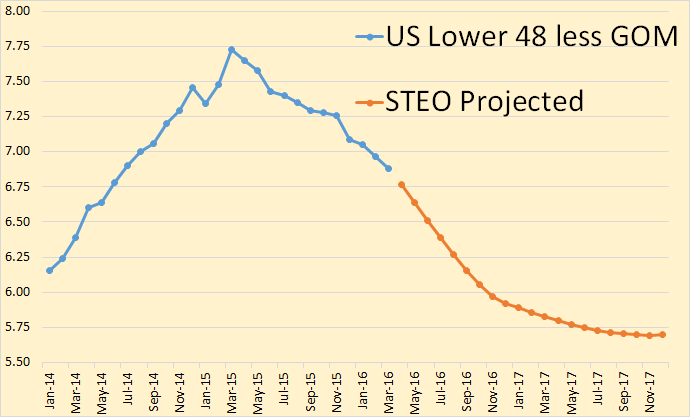
US L 48 Less GOM

The EIA expects shale oil and the rest of the lower 48 states to continue to decline but slow the decline next year and plateau in the last quarter of 2017 at 5.7 million barrels per day.

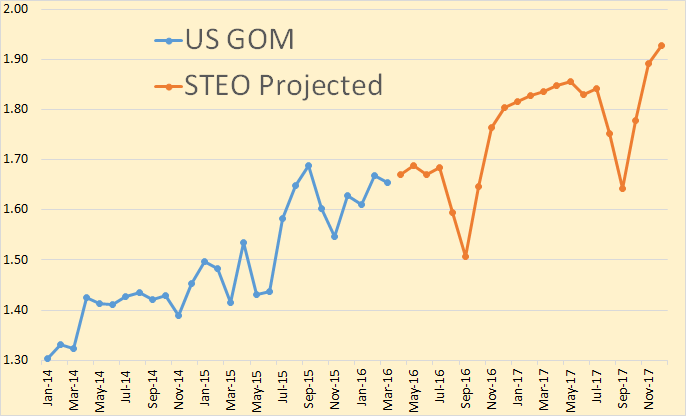
US GOM

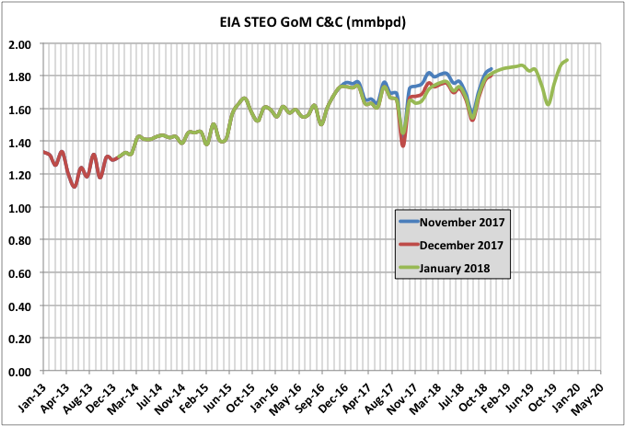
The saving grace, the EIA believes, will come from the Gulf of Mexico. They have GOM production reaching 1.93 million barrels per day in December of 2017. The spikes downward in August, September and October of 2017 and 2017 are obviously the EIA trying to anticipate the hurricane season. I think they are being overly cautious here. It is unlikely that disruptions of this magnitude will occour.

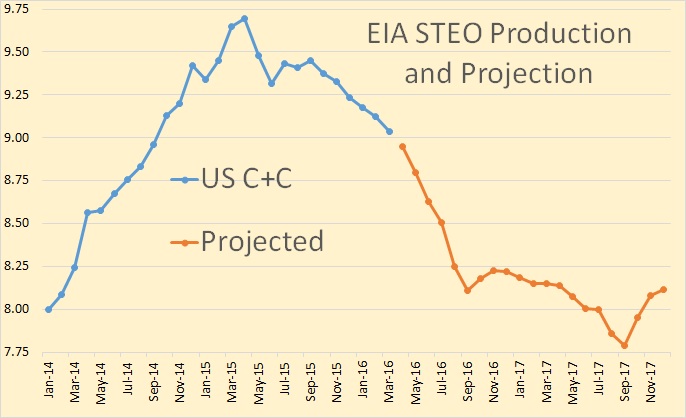
EIA STEO April 16

And, after you combine the two above charts then add in Alaska you get the above production numbers and projection.

Jean Laherrere posted me all the below: It is good to see that he is also in agreement with the above article.

Jefferson in this 2016 paper writes page 9:

put bluntly, the standard claim that the world has proved conventional oil reserves of nearly 1.7 trillion barrels is overstated by about 875 billion barrels.” 

quoting his 2014 paper: 16. Jefferson M. Closing the gap between energy research andmodelling, the social sciences, and modern realities. Energy Res Soc Sci 2014, 4:42–52.

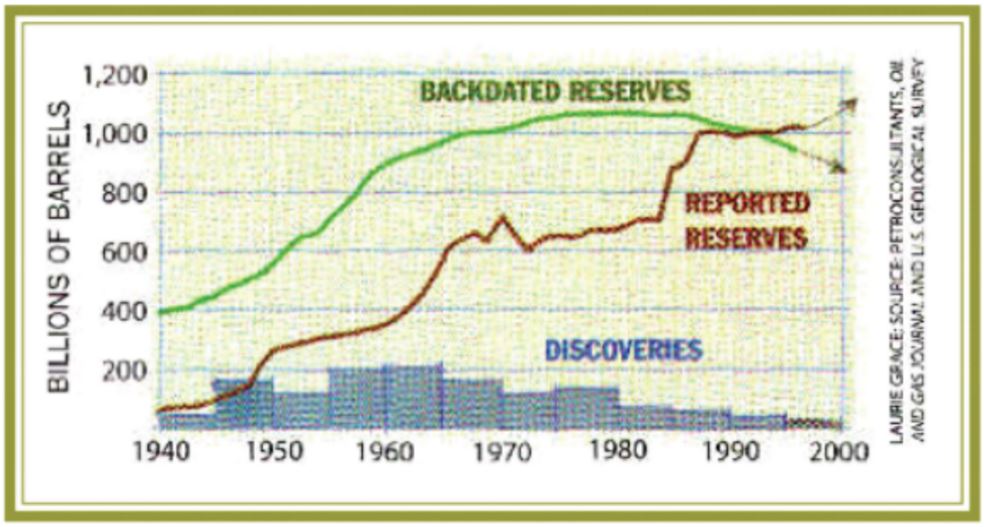
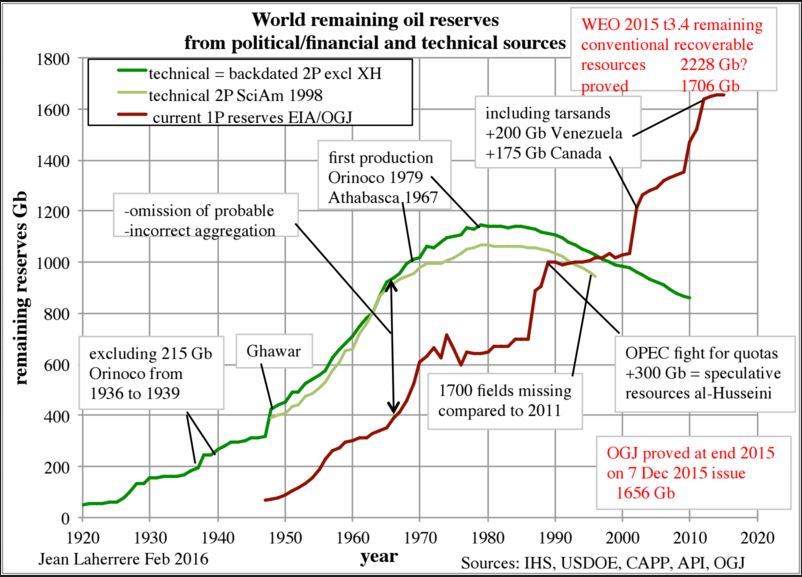
Since my graph of political current proved  and 2P backdated remaining reserves in 1998 Scientific American (with 1700 missing fields)  I have updated often in many paper this very important graph (the most in my opinion) because it explains the huge discrepancy between the economists relying on official data and the technicians relying on confidential data

You can see in my graph the conventional oil remaining reserves is at end 2015  about 1700 Gb for IEA and OGJ (EIA) but about 800 Gb for the backdated confidential technical sources, in line with Michael Jefferson

I am glad to see IIASA (which designed the very optimistic energy scenarios for the IPCC reports, in particular with the crazy CRP 8.5) showing more realistic assessments.

Laherrere 1

Laherrere 2


Overview of the Northern Deepwater Gulf of Mexico

0
0

by SouthLaGeo

The post that follows is a guest post by SouthLaGeo, a geologist with over 30 years of oil industry experience.

SouthLageo/

In this post, I will address 3 topics relating to the Northern Deepwater Gulf of Mexico –
1. Historical oil production
2. One view of the future of exploration
3. EUR ranges

I will limit my comments to oil production (not gas production). All production data is from BSEE/BOEM. The play outlines on the map are my best estimates. I will be using the BSEE definition of deepwater which includes water depths greater than 1000’. And, I will be assuming a Business As Usual future – by that I mean that fossil fuels will continue to be an important an energy source, and the world will continue to be able to afford them.

1. Historical production

Cumulative production to date from the deepwater GOM is about 7 billion barrels of oil (Bbo). Total shelf production is about 13 Bbo. The chart below shows both shelf (in green) and deepwater production (in brown/red), in annual, increments, going back to 1985. As you can see, shelf production dominated throughout the 80s and 90s, and then in 2000 deepwater production exceeded shelf production, and it has been that way ever since. (The totals above include production from before 1985)

SouthLageo/

The 3 peaks in deepwater production, in 2002-2004, 2009-2010, and the present peak from 2014, are the results of advances in technologies that have allowed industry to march into deeper water and produce from deeper reservoirs.

The earliest peak was, in a sense, an extension of shelf play types into deepwater. The reservoirs were Pleistocene to Miocene in age, mostly bright-spot associated, and outboard of salt, and ranged in depth from ~10,000-20,000’. The biggest fields in this trend were Shell’s Mars/Ursa complex in Mississippi Canyon, and their Auger field in Garden Banks. Peak production approached 1 million barrels of oil per day (mmbopd).

What is a “bright spot”? Without getting into geophysics too deeply, a bright spot is an anomaly that stands out on seismic data relative to the background, and is often an indicator of an oil or gas accumulation. Google it and you will find some nice examples.

As technology advanced, industry moved in to deeper water and deeper reservoirs. One technology in particular, seismic acquisition and processing, was critical in this regard. The next trend, the subsalt trend, was discovered because of advances in seismic technology.

The Seismic Advantage:

The use of seismic data has always been an important tool for explorationists to identify oil and gas prospects (e.g. the application of bright spot technology to identify oil and gas reservoirs outboard of salt as mentioned above), and this is even more so the case in deepwater where exploration wells are expensive, but seismic data is relatively cheap.

Much of the deepwater Gulf of Mexico is underlain by an allocthonous salt canopy (allocthonous = “out-of-place”, meaning in the salt is currently not in the position within the stratigraphic column where it was deposited. Actually, much of the entire northern Gulf is underlain by allocthonous salt, but, on the shelf and “shallow” deepwater, all of the oil and gas reservoirs are above the allocthonous salt. See stylized cross section below.)

So what’s the big deal that much of the deepwater is underlain by a salt canopy? Well, because of the large acoustic impedance contrast between salt and surrounding sediments, salt severely distorts seismic energy with the result being that it is very difficult to get a good image of the geology below the salt, and it is in these subsalt sediments where the oil and gas may be. The cartoon cross section below illustrates this. With “old seismic data” say pre-1995 or so, the seismic image of a given area in the deepwater would look like the image on the left. You could see down to top of salt, but then had no idea what was going on below that salt. But, as seismic technologies advanced in the 1990s, we could start to see images like those on the right – we could image not only the base of salt, but also potential subsalt seismic events that could create hydrocarbon traps. The cartoon on the right is actually a reasonable representation of Chevron’s Tahiti field in Green Canyon.

SouthLageo/

The stylized regional cross section below, edited from a cross section originally published by McMoran, shows the geometry of the salt canopy, and how the canopy separates above salt, or supra-salt, basins from subsalt basins. The length of this cross section is about 300 miles. The deepwater subsalt discoveries I’ll be discussing are located in the Middle and Lower Miocene, and Eocene (~Wilcox) formations.

SouthLageo/

With the advances in seismic technology, and many other technologies as well (drilling, completions, platform fabrication, risers, subsea infrastructure, etc,) industry advanced into deeper water, and was particularly sucessful in finding large oil accumulations in southeast Green Canyon. The next peak in deepwater production came in the 2009-2010 time frame as a number of these fields came on production, especially Tahiti, Atlantis and Shenzi from the southeast Green Canyon trend, and Thunderhorse from Mississippi Canyon (Thunderhorse is just east of Mars/Ursa on the map below.) The initial production from these fields resulted in the biggest year-to-year increase in oil production ever in the deepwater – approximately a 400 kbopd increase between 2008 and 2009. Durings this peak, deepwater production was at record levels of about 1.25 mmbopd.

Unfortunately, many of these fields experienced rapid early production declines, and that, in addition to an overall reduction of deepwater drilling in late 2010 and 2011 as a result of the Macondo drilling moratorium, led to the rapid production declines.

Much has been written over the years in both this forum and TOD about this rapid production decline, particularly in reference to BP’s Thunderhorse field. It would appear to me that Thunderhorse has certainly been a disappointment to BP, but they have continued to develop the field, and have recently instituted a waterflood. The other fields I mentioned above, all from the subsalt Miocene trend in southeast Green Canyon, have been more successful.

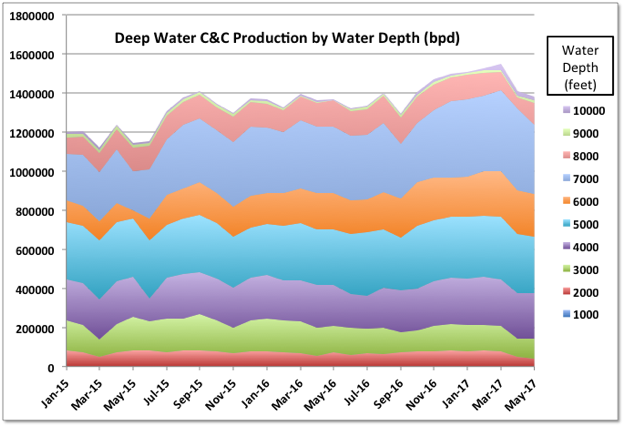
We are currently seeing a 3rd peak starting in 2014. While the chart above only goes through 2015, early 2016 data indicates that overall production is approaching record levels, and if one backs out shelf production, it is almost a certainty that we are currently seeing record deepwater production levels of over 1.3 mmbopd. The major factors contributing to this are :

  1. Redevelopments of a number of existing fields including Mars, Atlantis, and Auger (The successful redevelopment of Atlantis resulted in it being the most prolific oil field in the GOM in 2015 averaging over 100 kbopd)
  2. Initial production from Wilcox fields such as Great White and Jack/St.Malo

Over 30 years of production have demonstrated that there are definite sweet spots within the deepwater Gulf- most notably, the subsalt Miocene of Southeast Green Canyon, and the greater Mars/Ursa basin (see trend map below). Both of these areas have prodcued over 1 BbO, and both have a lot of future prospectivity and are likely to achieve at least 2 BbO or more in ultimate recovery. Five of the six biggest fields to date are from these trends.

Top 6 Northern GOM Deepwater fields in terms of cumulative oil production:

SouthLageo/

SouthLageo/

2. One view of the future of exploration

Over the last few years, the exploration results for industry in the deepwater Gulf of Mexico have been disappointing. In my opinion, 2 factors contribute to this –

  1. Low oil prices have reduced exploration drilling
  2. The deepwater Gulf is becoming a fairly mature province

Item # 1 above is hard to debate. Overall deepwater drilling is down, and along with that, exploration drilling is down.

Item #2 above might be debated, but let me explain my reasoning.

15-20 years ago, some prognosticators called the Gulf of Mexico the “Dead Sea” because, in their view, there were no more unexplored areas. (Remember, at that time, virtually all of the production was outboard of salt, and bright-spot associated.) The view was that all of the discoveries of note had been made and all that was left was to produce the existing fields. But just about that time the revolutionary advances in seismic imaging technology mentioned earlier started revealing prospectivity below the extensive shallow salt bodies in many areas of the deep gulf where before, these areas were just viewed as nonprospective. The large subsalt Miocene discoveries of southeast Green Canyon were made and started coming on line, and then, industry ventured into other subsalt provinces discovering the Wilcox trend. These were the years of the “great unveiling”, as more and more salt bodies were properly imaged and found not to be salt massifs that extended to basement, but were salt canopies with prospective subsalt section below.

Consequently, many discoveries were made including subsalt Miocene fields like Thunderhorse and Thunderhorse North, Mad Dog, K2, Atlantis, Tahiti, Shenzi, Heidelberg, Stampede and Big Foot, and Wilcox discoveries like Jack/St.Malo, Shenandoah, Tiber, Guadalupe, Anchor, Leon, Stones, and many more.

In my opinion, the era of the “great unveiling” is past its peak, and in decline. The areas that remain to be “unveiled” are those where the salt tectonics are often very complex and where prospective section is revealed, it may be below 30,000’, and sometimes even below 35000’.

This isn’t to say discoveries won’t be made. There will continue to be small basin play discoveries– in the 20-40 mmbo range. The edges of the Inner and Outer Wilcox trends may be expanded a bit resulting in a few 100-200 mmbo discoveries. There also may be some, what I call, one-off discoveries – discoveries that appear to be one of a kind and are not indicative of a new trend (Noble’s recent 40-50 mmbo Katmai discovery in Green Canyon, I think, falls into that category).

Is there a legitimate new play/trend yet to be discovered? For example, is there prospectivity in some formation deeper than the Wilcox, such as the Cretaceous Tuscaloosa? While I’m sure industry is looking into this, they have to realize they would be dealing with reservoirs that would probably have even lower porosity and permeability that the Wilcox, and while industry may be starting to figure out how to produce the Wilcox, the Wilcox reservoirs are very thick, and what they lack in permeability, they can make up in thickness. Note McMoran’s lack of success in establishing production from their deep shelf gas discovery, Davy Jones. We will have to wait and see if industry is able to establish production from deep Tuscaloosa oil – assuming, of course, commercial quantities of Tuscaloosa oil are even discovered.

Some also think there may be a presalt play in the Gulf of Mexico, similar to the successful presalt plays in offshore Angola and Brazil. This is, as far as I know, a completely untested play in the Gulf of Mexico, and, consequently, quite high risk.

(Presalt is not the same as subsalt. The subsalt, as mentioned earlier, is the stratigraphy between the allocthonous, or out-of-place, salt canopy and the autochthonous, or in-place, Jurassic Louann salt. The presalt is that stratigraphy below, or older than, the Louann salt. Note that the Louann salt is not identified on the cross section above. If it were, it would be, for all practical purposes, right above what is labeled Mesozoic.)

One big difference industry will find between the Wilcox and any deeper prospective section is that while the deepwater Wilcox sands are thick, fairly continuous, and present over very large areas of the deepwater (see the trend map above and note the size of the Inner and Outer Wilcox trends, and note that well developed Wilcox sands have been penetrated outside the trends, but commercial oil accumulations have not been discovered, with the exception of the Perdido Fold Belt), other prospective sections will probably be much more localized, possibly more channelized, and also thinner. Consequently, the prospective play outlines will be much smaller. The outline of the Norphlet on the play map above is a good example. (The Norphlet is older than the Wilcox, being Upper Jurassic in age and was deposited immediately on top of the Louann salt. The Wilcox is younger, being Eocene/Paleocene).

Some observers point out how the Gulf of Mexico has continued to re-invent itself over the years. When shelf production started declining off its peak in the late 80s (see initial production chart), some thought that was the end for the Gulf of Mexico. But then, production from the shallow plays of the deepwater started to kick-in (Note that shelf production rebounded at this time also. The peak in shelf production seen in the late 90s was largely due to the introduction of 3D seismic to revitalize shelf fields). Then, as mentioned earlier, when the next decline in production occurred, people started writing off the GOM again as the “Dead Sea”, but then production from the subsalt discoveries, first Miocene fields, and now Wilcox fields, started contributing.

Is there another “reinvention” of the Gulf to be made? Or, when this current peak in production begins to flatten out, will that be the start of terminal decline? Let’s see what the state of GOM exploration is by about 2020? If a legitimate new play has been found by 2020, then I can envision another peak in production (or at least a flattening in the rate of decline) in the late 2020s to early 2030s. If not, then it may be that the current peak will be the final peak.

3. EUR ranges

In this section I will present multiple views on Estimated Ultimate Recovery (EUR) ranges for the Northern Deepwater Gulf of Mexico. I will present Jean Laherrere’s recent estimate, comment on recent resource estimates by BOEM (the Bureau of Ocean Management), and then provide my EUR estimates.
(I came across Jean Laherrere’s document called JL_2016USoilultimate.pdf, where I pulled some displays, it is at the following link:

http://aspofrance.org/files/JL_2016USoilultimate.pdf  )

First I will discuss shelf oil production. The chart below is from the 2016 Laherrere presentation where, through the Hubbert Linearization graphing technique (HL), he makes the case for a shelf EUR of around 14 Bbo (Gb). This is, in my opinion, spot on. Current daily shelf production is probably below 200 kbo, activity levels are low, and discoveries are infrequent and small. Even if we had a rapid increase in oil prices and associated shallow water activity, I can’t see EUR getting much higher than 14 BBO, maybe 15 or 16 on the highside.

SouthLageo/

Before I discuss deepwater EUR, I will look at the EIA’s predictions about near term GOM oil production.

The chart below is monthly GOM production (average daily production per month) from early 2014 through 2017. Every data point left of, and including, the red circled point, is historical data. Every data point to the right is the EIA’s prediction through late 2017. The annual declines in the August through October time frame are their estimates of hurricane related downtime. From the middle of 2015 until May-2016, GOM production has hovered around 1.55-1.6 mmbopd. The EIA estimates that GOM production will start to exceed 1.8 mmbopd in November, 2016, and continue a gradual rise to over 1.9 mmbopd by late 2017.

These seem to me to be rather optimistic estimates. I don’t think production will get to levels over 1.8 mmbopd. 2016-2017 project start-ups that could contribute over 50 kbopd include Heidelberg (in SEGC on play map) and Stones (outer Wilcox). All others will probably contribute less than that. (Remember this is shelf plus deepwater production. Assume about 200 kbopd of the total production is from the shelf, and the remainder is from deepwater.)

I do believe industry will be able to maintain production levels over 1.5 mmbopd beyond 2017 with Stampede and Big Foot (both in SEGC) coming on in 2018. Both of these fields should be able to maintain production levels over 50 kbopd for at least a few years.

SouthLageo/

Below is Jean Laherrere’s recent HL estimate for deepwater EUR. He gives an EUR of 10 Bbo. His combined shelf and deepwater total is 24 Bbo.

In my opinion, he is underestimating the EUR from deepwater. The 3 spikes in the HL curve tie to the 3 spikes in production discussed earlier – the first spike, at about 1 Bbo, is from the early production from the basin plays, the 2nd spike, at 4-5 Bbo, is from the production spike between 2008 and 2009 from the Miocene subsalt, and the 3rd spike is the current peak in production due to existing field redevelopments and initial production from the Wilcox trend.

I believe Jean is underestimating the significance of the third spike in the way he draws the trend line through the data. It is too early to use HL to predict the EUR from the deepwater. (Jean suggests this in his paper). One has to at least wait until the 3rd spike starts to level off, or decline. When that portion of the curve levels off, or starts to decline, one would predict an EUR significantly higher than 10 Bbo.

While I am by no means an expert on the use of the Hubbert Linearization graphing technique to estimate EUR, I assume it works best in a basin where the biggest discoveries are made rather early, and smaller discoveries follow. And it also works best in basins where, if new plays are found, they are relatively small. That is certainly not the case with the deepwater Gulf of Mexico. (It is the case with the GOM shelf, and that is why HL works fairly well to predict ultimate EUR. That is, the biggest shelf fields were discovered early, and smaller discoveries followed).

SouthLageo/

If one were only to look at existing fields on production, prior to the 3rd spike in production, I think the 10 Bbo EUR is reasonable, but if one includes the projects that are contributing to the third spike, plus the significant queue of projects that have either just come online, or should come on line between now and 2022 or so, I can see the EUR increasing to 13-16 Gb.

The projects contributing to the 3rd spike, as I mentioned above, include redevelopments of a number of older fields, plus Great White, the first Wilcox producing field.

Many of the projects that have either just come online, or should come online between now and 2022 or so include (including reference to trend map above):

Heidelberg, Big Foot, Stampede, and Mad Dog 2 – from Southeast Green Canyon,

Julia and Stones – from the Outer Wilcox trend,

Appomattox and offsets – from the Norphlet,

Power Nap, Vito and Kaikias from the Mars-Ursa basin

and Tornado, Kodiak and Gunflint – from the basin play trends. (Kodiak is technically not a basin play field, but a subsalt field in Mississippi Canyon).

Then if you include the list of Wilcox discoveries that have been made, and probably will come online in the early to mid-2020s, including:

the Tigress complex (Guadalupe, Tiber and Gibson), Shenandoah, North Platte, Anchor from the Inner Wilcox trend, and

Leon, Sicily and Kaskida, from the Outer Wilcox trend, one can probably add another 2-4 Gb of ultimate recovery.

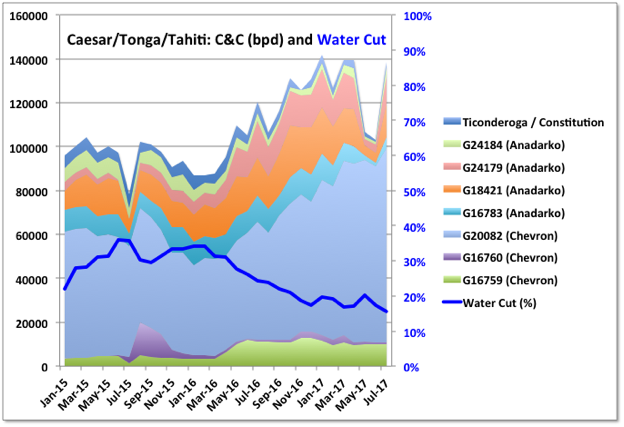
In the lists above, most of the projects that are highlighted bold will have a producing platform. Other projects will probably be sub-sea tiebacks to other producing platforms. In general, the projects with a producing platform need to be expected to produce at least 150 mmbo to justify the investment – although this number could be debated. The reserves needed to justify a tieback can range widely from as little as 15-20 mmbo for a single well to over 100 mmbo for a multi-well development. The currently producing Caesar-Tonga field in Southeast Green Canyon is a good example of a multi-well subsea tieback field that should easily produce over 100 mmbo.

Next we will look at data recently provided by BOEM. What BOEM provides is actually an endowment estimate, though, I will attempt to determine an EUR estimate from their numbers.

BOEM recently released their “Assessment of Undiscovered Oil and Gas Resources of the Nation’s Outer Continental Shelf, 2016”.

http://www.boem.gov/National-Assessment-2016/

This study is effective as of January 1, 2014.

Their total endowment for the Gulf of Mexico is 83 Bbo. This is made up of Cum. Production = 19 Bbo, Remaining Reserves = 4 Bbo, Contingent Resources = 3 Bbo, Reserves Appreciation = 9 Bbo, and Undiscovered Technically Recoverable Resources (UTRR) = 48 Bbo.

The sum of cum production + remaining reserves + reserve appreciation = 32 Bbo. This could be thought of as an EUR estimate from existing fields and be compared to Jean Laherrere’s shelf + deepwater EUR of 24 Bbo. The difference is, I believe, mainly due to BOEM’s 9 Bbo estimate of reserves appreciation – otherwise the totals are 24 v. 23 Bbo. Reserves appreciation is a bottom’s up (field by field) calculation performed by BOEM that results in an “increase in reserve estimates from extension, revision, improved recovery or new reservoirs”.

The remaining BOEM estimate includes 51 Bbo of resources – 3 Bbo coming from existing fields and 48 Bbo from undiscovered fields (BOEM’s UTRR). Their UTRR estimate assumes no economic constraints. When they apply economic constraints, this number varies from 31 Bbo at $30 oil up to 45 Bbo at $160 oil, and the term becomes Undiscovered Economically Recoverable Resources (UERR).

This estimate, whether one uses 31 Bbo, 45 Bbo or 48 Bbo, is quite large, but, keep in mind this is an unrisked resource estimate. In previous comments in this forum, myself and others have commented on these numbers from BOEM’s 2011 report suggesting they are unreasonably high. I was mistaken in assuming these numbers where BOEM’s estimate of EUR coming from undiscovered fields. In actuality, these are resource numbers, not reserves, and therefore they should be risked. Should one risk these numbers at 10%, 25%, 40%?

For a number of years, when what I called the “great unveiling” was occurring, and many of the subsalt basins were being illuminated by new seismic, industry’s discovery rates were probably 30-50%. But, I believe future discovery rates will be lower as more challenging areas are explored. I can see future discovery rates in the 20-30% range.

If one assumes a 25% future discovery rate and applies it to a UERR of 40 Bbo, one gets an EUR from yet to be discovered fields of 10 Bbo (and let’s assume all that comes from deepwater).

So, in total, I estimate BOEM’s EUR total to be 32 Bbo (their cumulative-to-date plus reserves) + 10 Bbo (from new fields) or 42 Bbo. If one assumes a shelf EUR of 15 Bbo, that leave a deepwater EUR of 27 Bbo.

(Please note – BOEM has not provided an EUR estimate for the GOM. I have played some games with their resources estimates, and added these numbers to their cumulative production and reserves estimates to give one view of how BOEM’s numbers could be interpreted to provide an EUR estimate.)

Next I provide my estimate of deepwater GOM EUR. I have previously discussed many of the inputs to my estimate, so I have summarized my estimate in the table below. I provide mine probabilistically with low-mid-high ranges.

SouthLageo/

* some of what BOEM calls “contingent resources” falls into this category

Below is a compilation of the 3 EUR estimates, including both shelf and deepwater.

SouthLageo/

I finish up with a projection of future GOM production using my EUR estimates ranging from 30-37-47 Bbo. Keep in mind that this includes both deepwater and shelf, but shelf production is starting around 200 kbopd or so in 2016 and declining in future years. I never show total production over 1.7 mmbopd, and show it going out to 2059 in the low case, to 2073 in the mid case, and to 2094 in the high case.

The downside case shows a peak in 2020, and then a gradual decline, dropping below 1 mmbopd in the late 2020s, and below 500 kbopd in the late 2030s. The midcase shows a peak of 1.6 mmbopd through the early 2020s, followed by a plateau of 1.55 mmbopd in the late 2020s, then declining below 1 mmbopd in the late 2030s. The high case predicts a peak through the 2020s of 1.65 mmbopd, followed by series of plateaus ranging from 1.6 mmbopd down to1.5 mmbopd through the mid-2030s, followed by a gradual decline to below 1 mmbopd in the mid-2050s.

SouthLageo/

Do I really think GOM oil production could continue to 2094, as shown in the upside projection? Remember, this is a Business As Usual projection, assuming fossil fuels will continue to be needed and be “affordable”.

If you assume that there is no way production could continue past 2060 – then the downside case still produces 30 Bbo, the midcase EUR is 37, and the upside case has already produced 42 Bbo of its ultimate EUR of 47 Bbo.
The following table shows how the different EUR projections break down by decade through 2090.

SouthLageo/

Note that I am still a working stiff, and will respond to comments as time allows.
EIA’s Short-Term Energy Outlook

0
0

The EIA has just released its Short-Term Energy Outlook. Some of their projections should be taken with a grain of salt because they usually change every month. Nevertheless…

All US production is Crude + Condensate. All other production numbers are total liquids. The data is in million barrels per day.

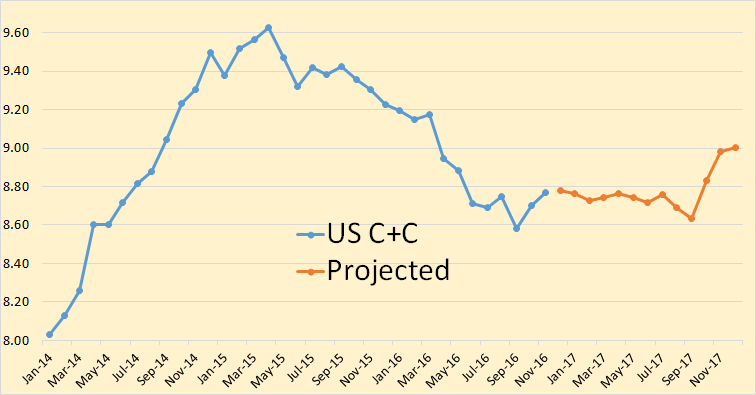
us-cc

The EIA has US production leveling out at just under 8.8 million bpd until Oct. 2017.

gom

They have all large gains coming from the Gulf of Mexico.

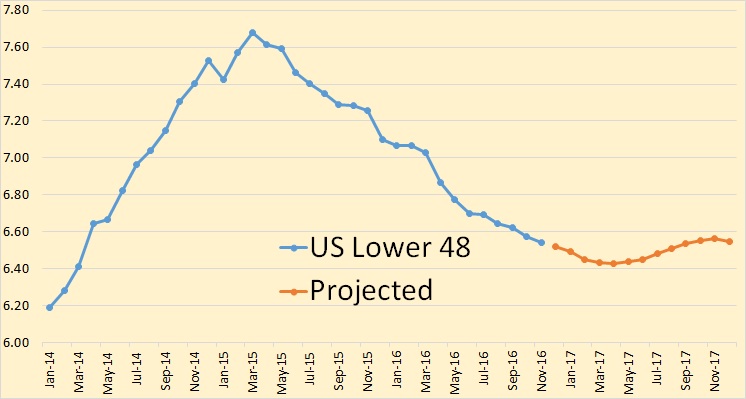
us-lower-48

The EIA sees no big gains coming from shale plays. They have production bottoming out in March and April, then increasing only slightly the rest of the year.

alaska

They have Alaska pretty much holding its own thru 2017.

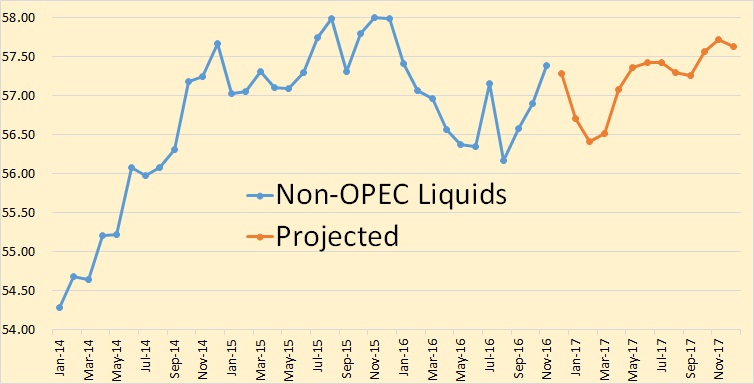
non-opec-liquids

They have Non-OPEC liquids recovering in 2017 but still holding below the 2015 average.

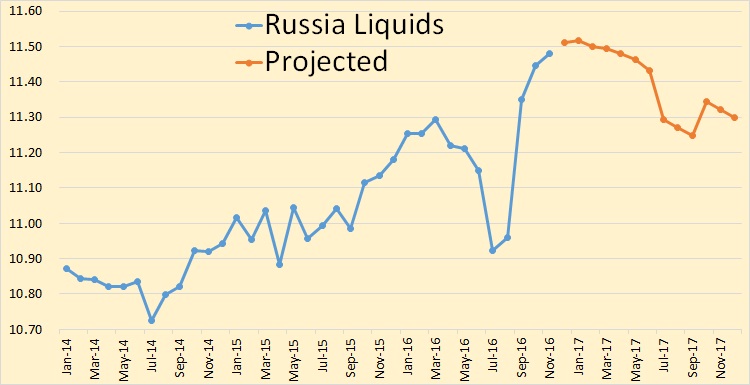
russia-total-liquids

The big increase in 2017 average is supposed to come from Russia. They have Russia peaking in January then starting a slow but steady decline.

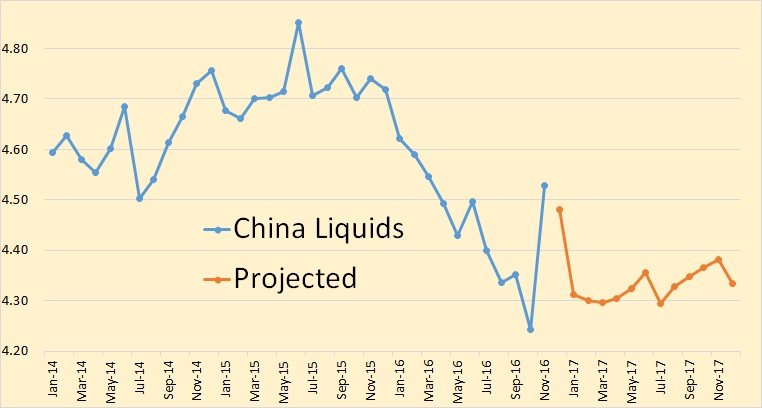
china-liquids

The EIA says China saw a huge increase in liquids production in November, down slightly in December before dropping again in January. I have no idea where the EIA got this November production data from. I could find nothing on the web that confirmed this data.

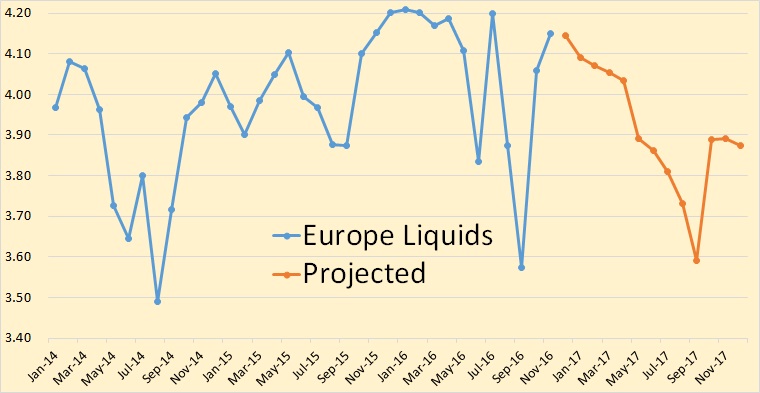
europe-liquids

Europe consist primarily of the UK, Norway and other North Sea production. The EIA has Europe declining throughout 2017 before recovering somewhat in October.

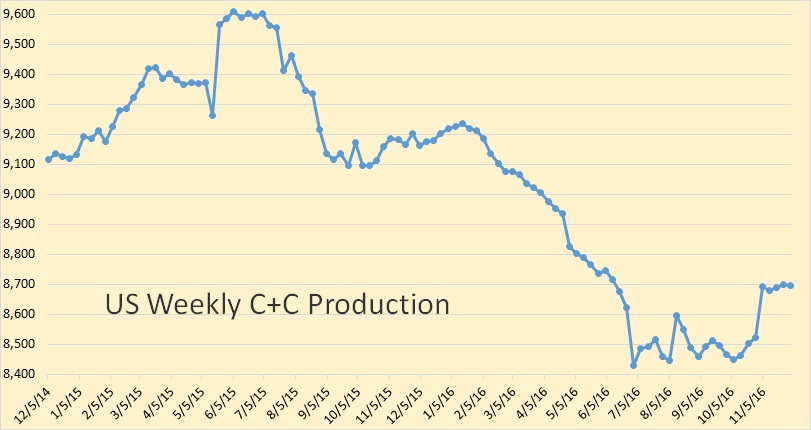
us-weekly-production

And just out, the EIA’s weekly estimate of US Weekly Petroleum Status Report with their best estimate of US C+C production as of December 2nd. This data is in thousand barrels per day.


Bakken January Production Data

0
0

North Dakota has published January production data for the Bakken and for all North Dakota.

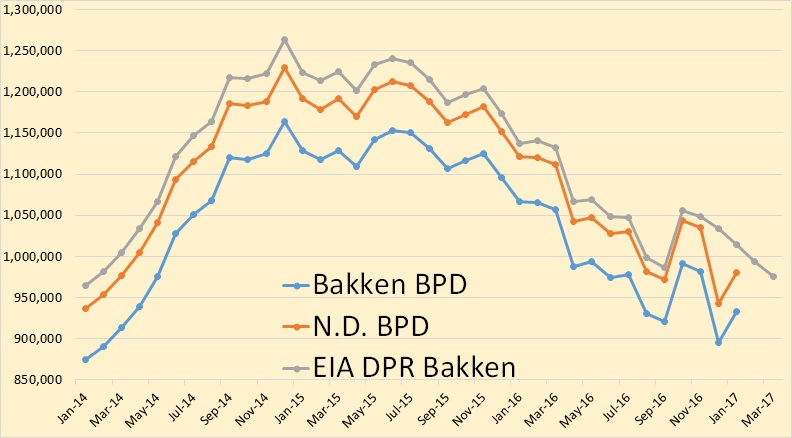
Bakken production was up 37,617 bpd to 932,817  bpd while all North Dakota’s production was up 37,972 to 980,294 bpd.

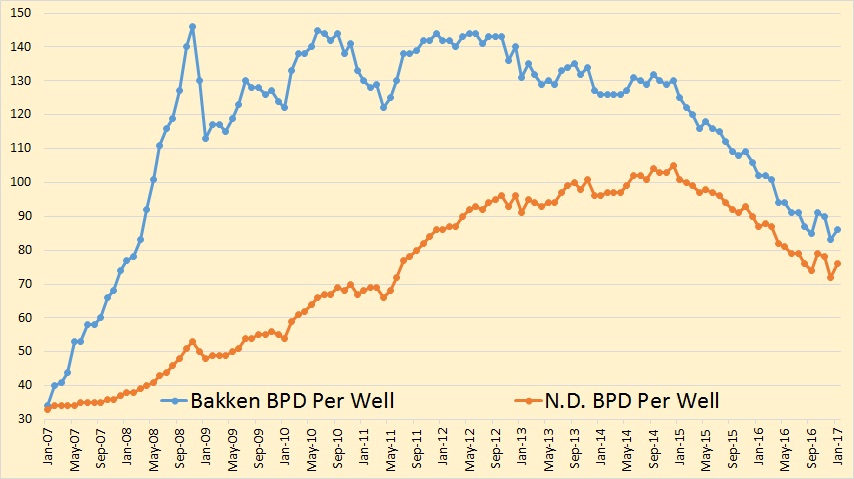
Bakken bpd per well was up 3 to 86 while the average bpd per well for all North Dakota wells was up 4 to 76.

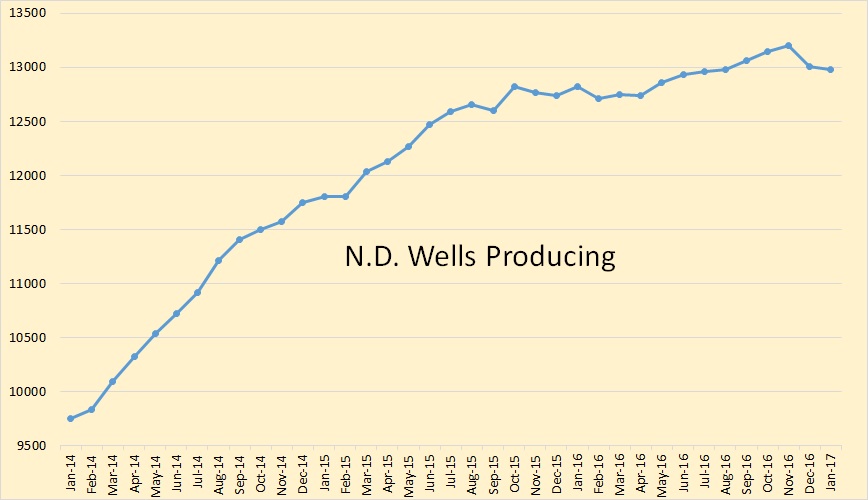
The North Dakota stats have “Wells Producing” dropping by 189 in December and dropping another 35 in January for a total decline of 224 over the two months. The total number of producing wells in North Dakota in January stood at 12,976.

You will notice these numbers differ quite a bit from Lynn Helms’ numbers below. I have no explanation for this.

From the Director’s Cut:

Oil Production

December    29,211,993 barrels = 942,322 barrels/day
January     30,389,117 barrels = 980,294 barrels/day(preliminary)
(all-time high was Dec 2014 at 1,227,483 barrels/day)

Producing Wells
December    13,337
January     13,333 (preliminary)
(all-time high was Nov 2016 at 13,520)

Permitting

December 35 drilling and 0 seismic
January 81 drilling and 1 seismic
February 45 drilling and 1 seismic
(all time high was 370 in 10/2012)

ND Sweet Crude Price

December $39.93/barrel
January $40.51/barrel
February $42.74/barrel
Today $41.50/barrel
(all-time high was $136.29 7/3/2008)

Rig Count

December 40
January 38
February 39
Today’s rig count is 44
(all-time high was 218 on 5/29/2012)

Comments:

The drilling rig count decreased two from December to January, then increased one from January to February, and is currently up 5 from February to today. Operators are shifting from running the minimum number of rigs to incremental increases throughout 2017, as long as oil prices remain between $50/barrel and $60/barrel WTI.

The number of well completions decreased significantly from 84(final) in December to 54 (preliminary) in January.

Oil price weakness is anticipated to last into the second quarter of 2017.

There were two significant precipitation events, five days with wind speeds in excess of 35 mph (too high for completion work), and eleven days with temperatures below -10F. The first half of January was as bad as December 2016, but the last ten days of the month the weather was dry, warm, and a little windy.

More than 98% of drilling now targets the Bakken and Three Forks formations.
Estimated wells waiting on completion is 802, down 5 from the end of December to the end of January. Estimated inactive well count is 1,678, up 105 from the end of December to the end of January.

Okay, but what is the rest of the USA doing as far as oil production goes. The data below is from the Petroleum Supply Monthly and goes through December 2016, not January as the above North Dakota data does. The data is in thousand barrels per day.

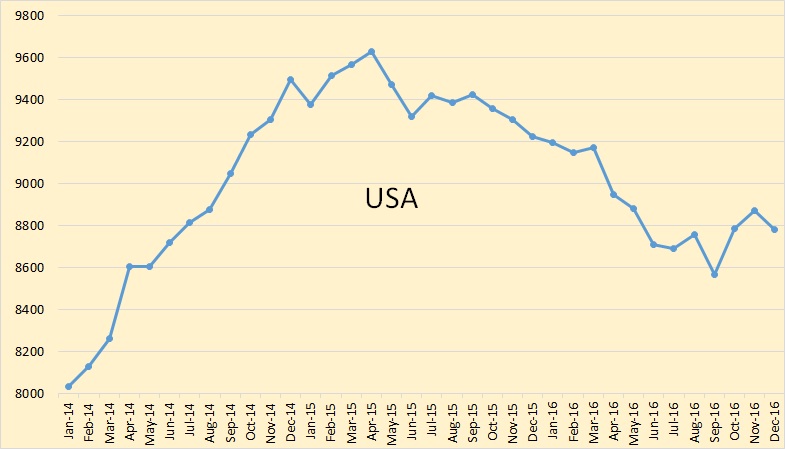
US C+C production was down 91,000 bpd in December. Most of this drop was from North Dakota which they have down 89,000 bpd in December.

The EIA has Texas down 17,000 bpd in December. Notice that they have Texas virtually flat for the second half of 2016.

Alaska has stopped their decline, temporarily anyway. Alaska was up 6,000 bpd in December.

The EIA says the Gulf of Mexico was up 47,000 bpd in December.

So I just subtracted Alaska and the GOM from total US production to see what the the Lower 48 was doing in December. They were down 144,000 barrels per day. 89,000 of that was from North Dakota. Therefore the Lower 48 less North Dakota was down 55,000 bpd.


World Oil Production

0
0

A guest post by David Archibald

The views expressed in this post do not necessarily reflect the views of Dennis Coyne or Ron Patterson.

The BP Statistical Review of World Energy has oil production data by country up to the end of 2015. This is what that looks like from 1988:

chart/

The United States increased production by 5.1 million barrels per day from 2010 to 2015. The increase in production from countries around the Persian Gulf over the same period was slightly less at 5.0 million barrels per day. The increase in total world production was 8.4 million barrels per day so the rest of the world declined by some 1.7 million barrels per day. This was despite Canadian production rising 1.0 million barrels per day from oil sands developments plus some other increases from Russia, Brazil, Colombia etc. Most oil producing countries are in well-established long term decline or plateau at best. How these trends will interact can approached from a bottom-up basis. To that end, the following graphs show likely production profiles by region for the next five years.

chart/

Saudi Arabia used to be the world’s swing producer. That role has been taken by the shale drillers of the United States. The graphic assumes that enough shale wells are drilled each year to keep US production flat – profitless prosperity. Mexico’s decline is well established for geological reasons and Venezuela’s decline continues for political reasons.

chart/

Russian production has held up well and, combined with fields in development, it is assumed that Russian production remains in plateau. The Norwegian and UK production declines are well established.

chart/

Algeria and Egypt are in decline. It is assumed that Libyan production does not recover from Tony Blair and Nicholas Sarkozy’s adventure in regime change.

chart/

Iranian production peaked in 1974 at 6.1 million barrels per day as the Shah tried to overtake Saudi production. It is assumed that Iranian production is geologically limited. Iraqi production continues rising despite the civil war in that country. Currently at over 4.0 million barrels per day, Iraq’s geological endowment should see production continuing to rise towards 9.0 million barrels per day.

chart/

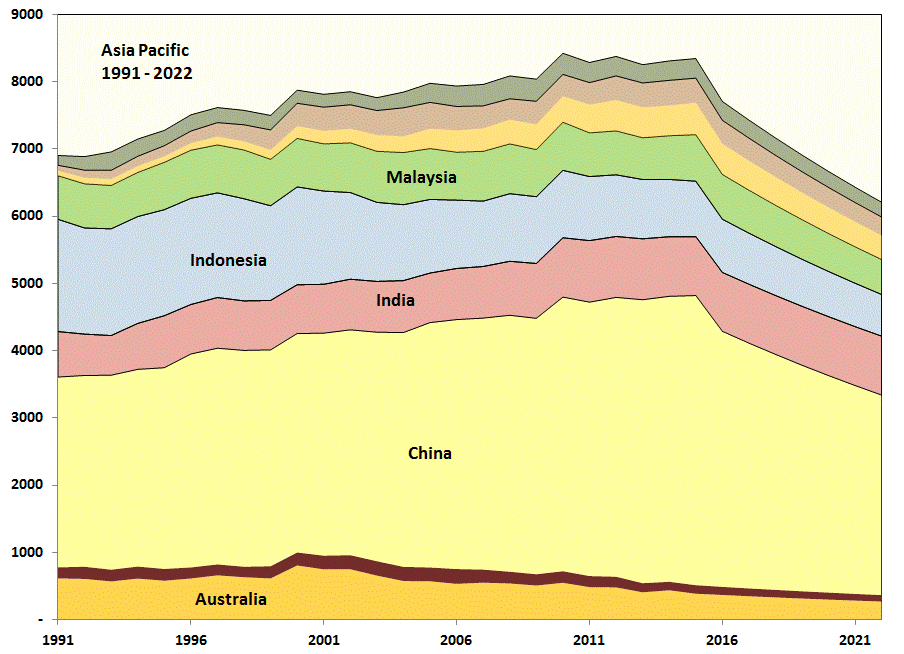
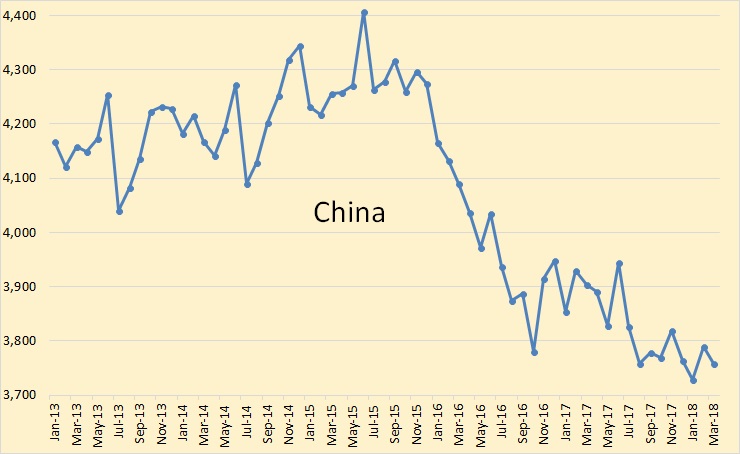
Most oil producing countries in the Asia Pacific region are in well established decline. They were joined by China in 2016 which has two thirds of its production from giant oilfields that have been in production for decades and now have high water cuts and high operating costs. The graph assumes that China will contribute 1.3 million barrels per day of a 2.1 million barrel per day decline for the region over the next five years.

Adding all those production profiles results in production in 2022 that is five million barrels per day lower than world production, per BP’s statistics, in 2015. That could be offset by a faster rise in Iraqi production combined with increased shale oil production. According to this graphic from BTU Analytics:

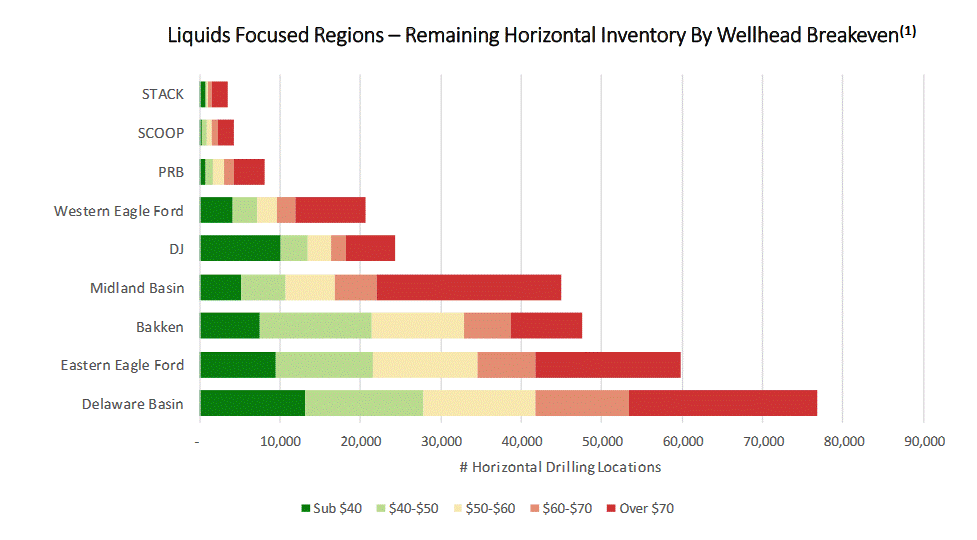
chart/

There are some 290,000 remaining shale oil well locations remaining in the United States. By Enno Peter’s work, about 62,000 shale wells have been drilled in the United States to date. Peak drilling year was 2014 with 14,262 wells drilled for 2.46 million barrels per day of production in January 2015. About half of that number of wells need to be drilled each year now to offset decline in US shale oil production.

From all of the above, not an original conclusion – the US shale oil well inventory is likely to buffer the oil price for at least the next five years.

David Archibald is author of American Gripen: The Solution to the F-35 Nightmare

US Gulf of Mexico, May Production

0
0

Guest Post by George Kaplan

GoM Production

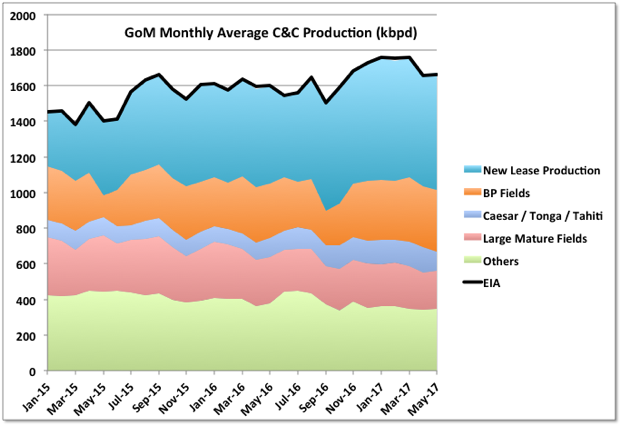
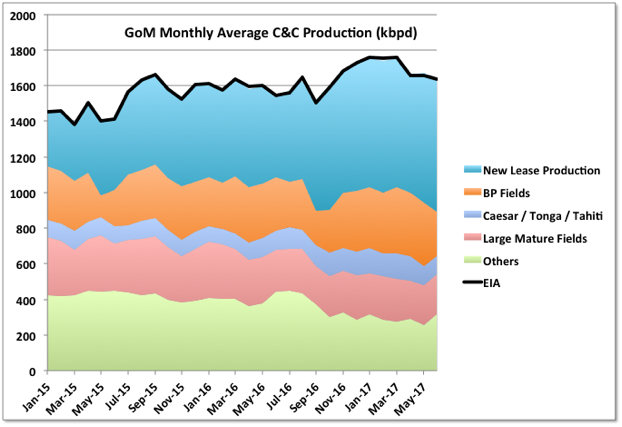
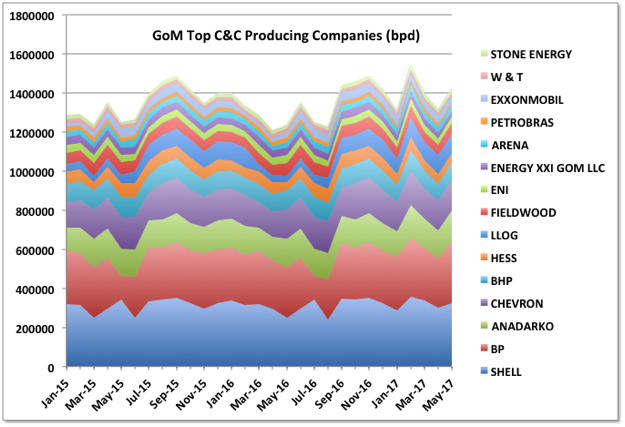
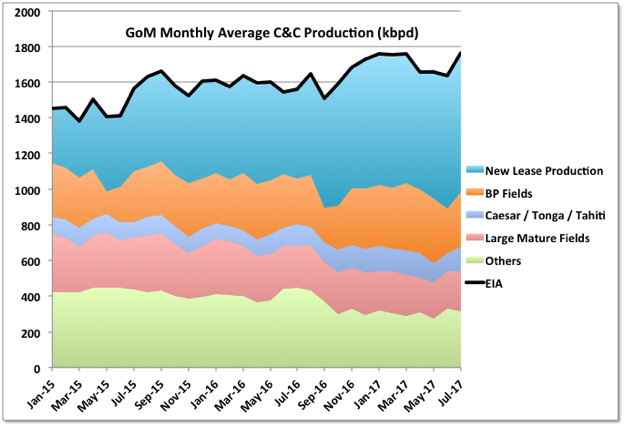
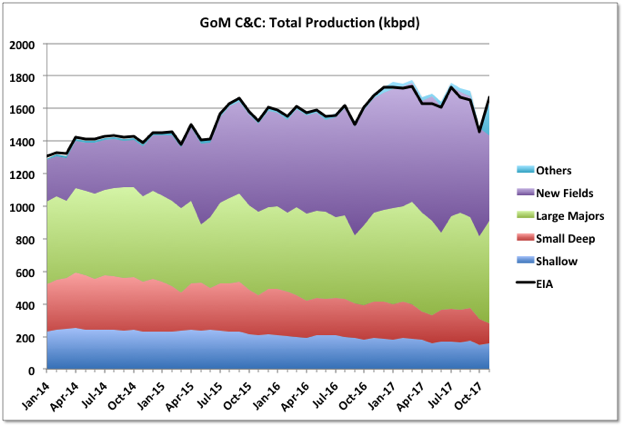
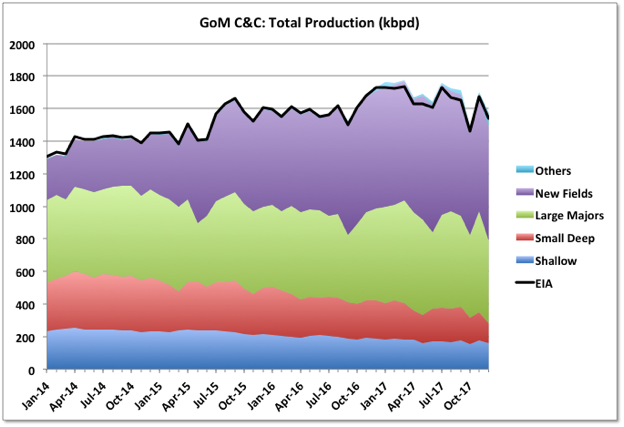
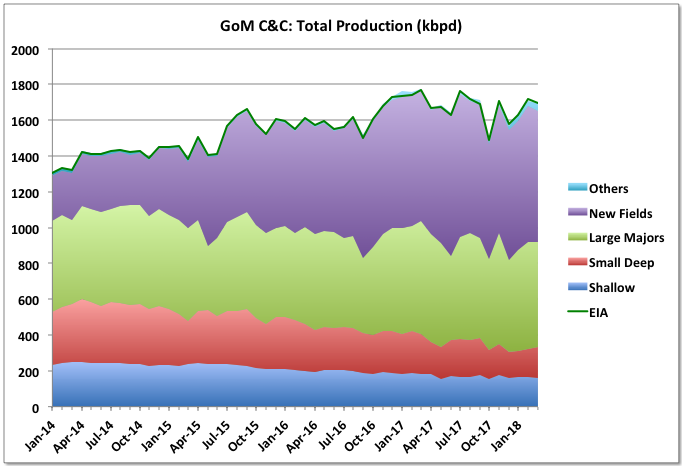
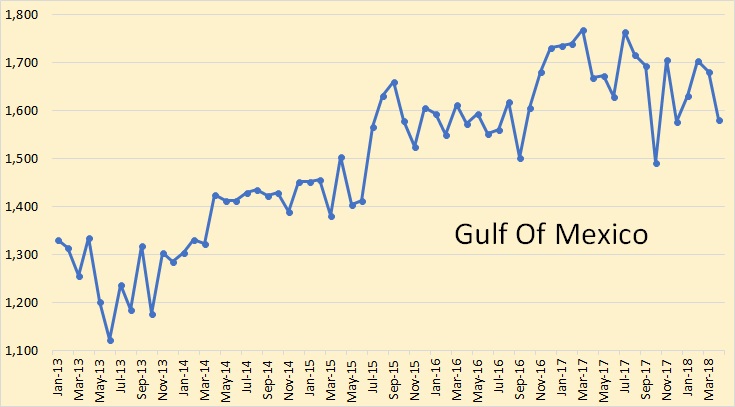
Production for May by BOEM was 1673 kbpd and by EIA 1661, compared with 1661 and 1658 kbpd, respectively in April.

March looks like the peak, at least near term, for the basin, especially with Hurricane Cindy impacting the coming June figures.

chart/

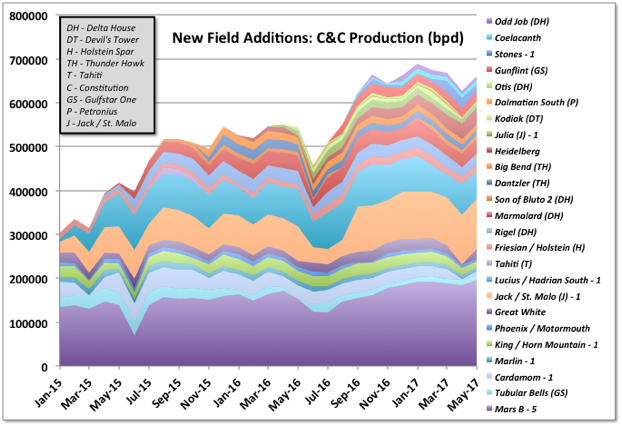
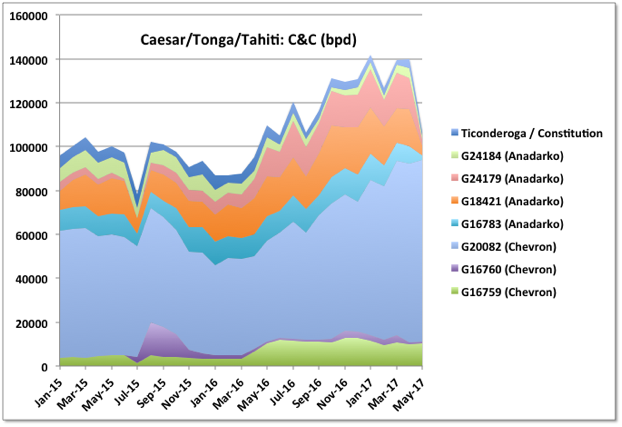
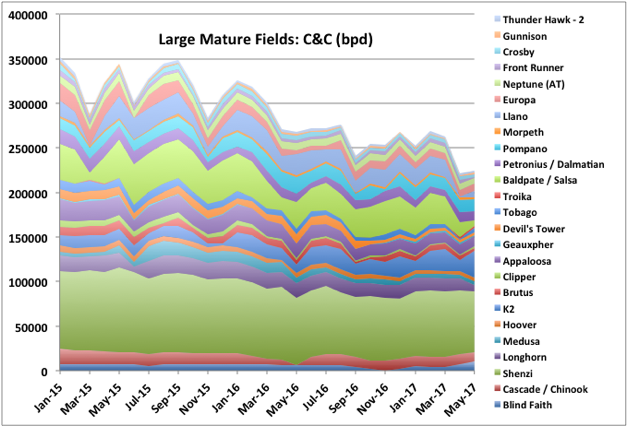
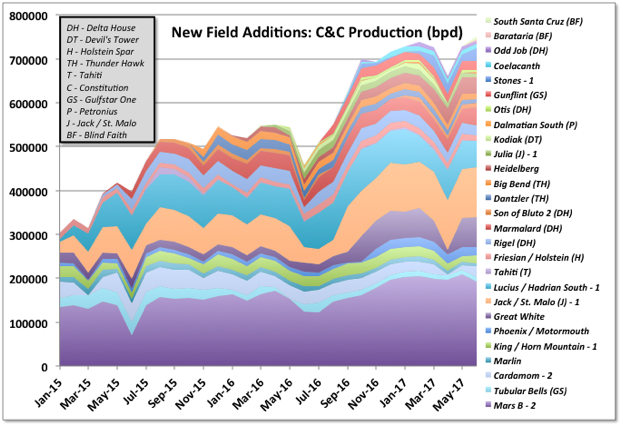
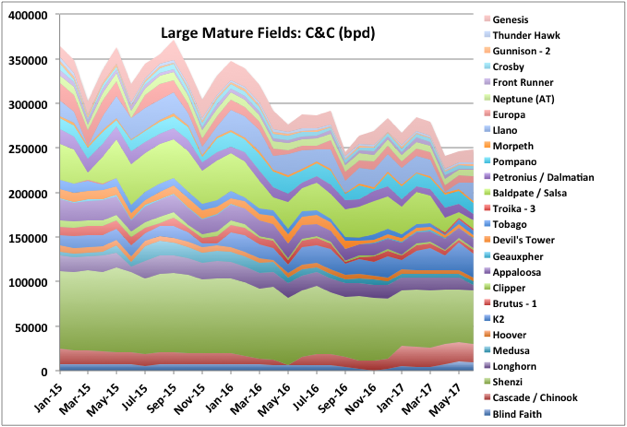
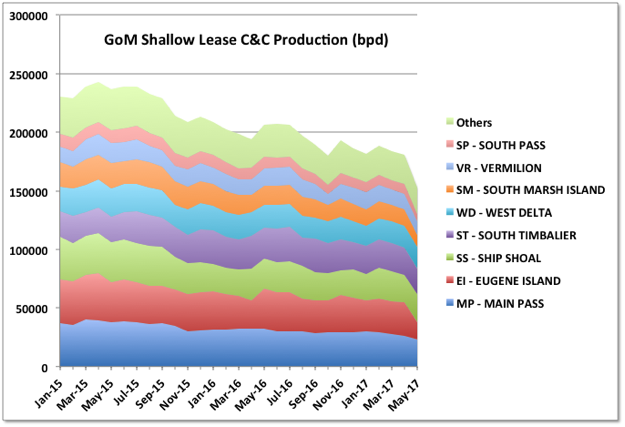
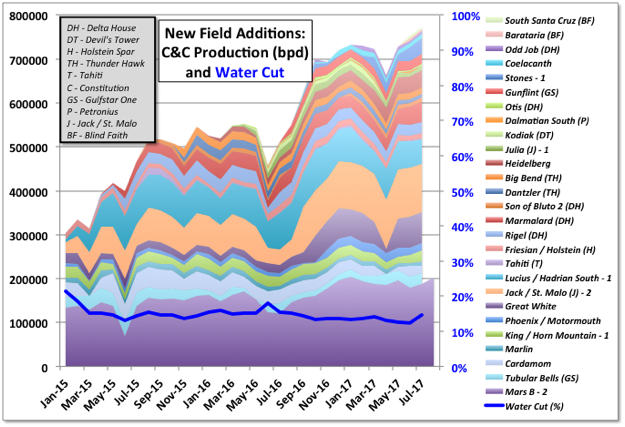
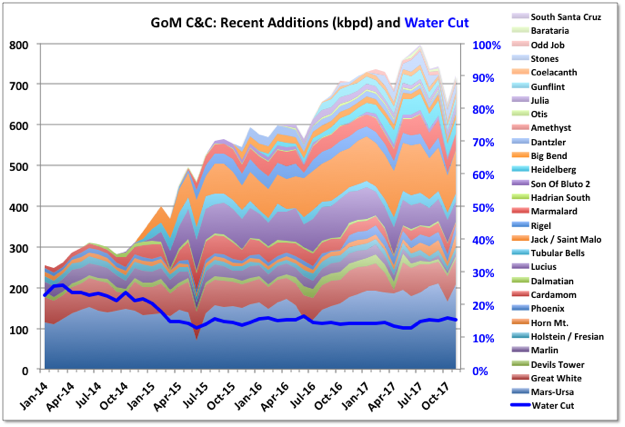
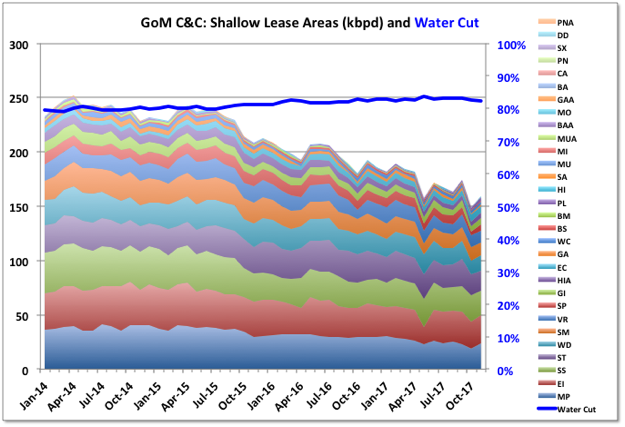
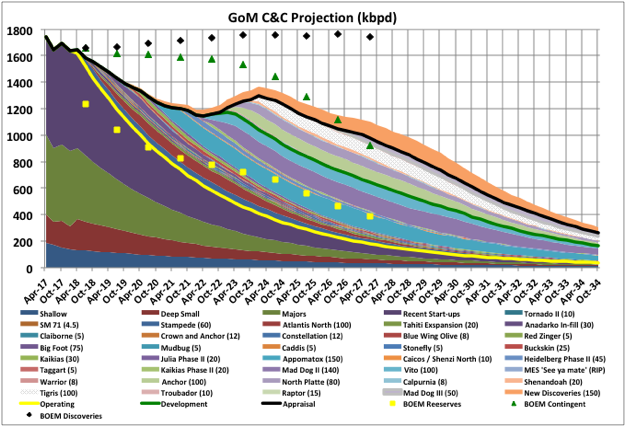
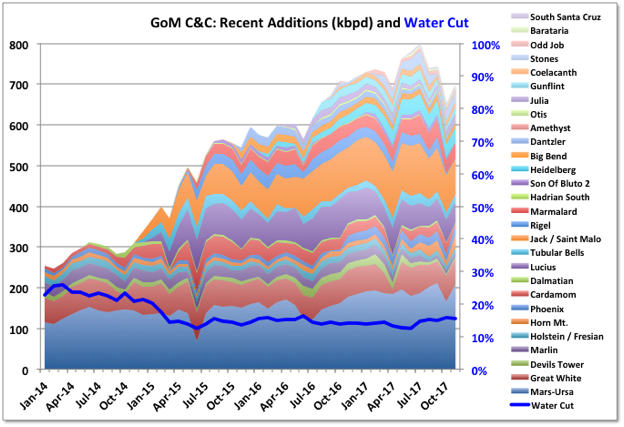
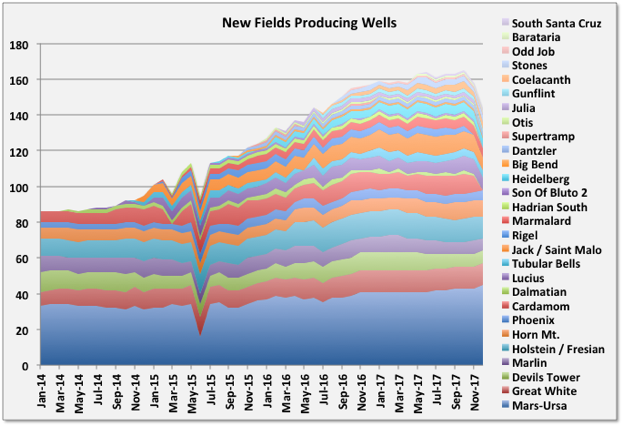
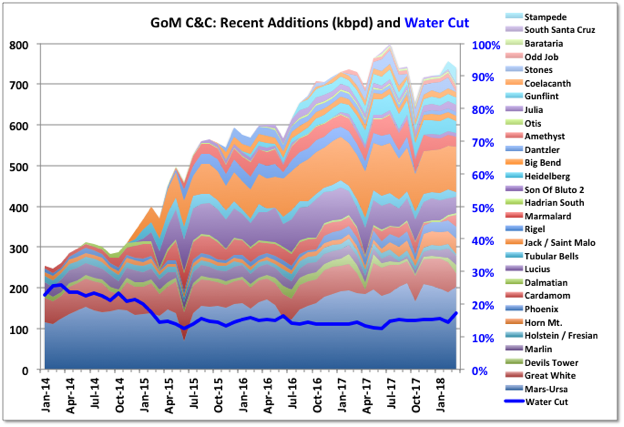
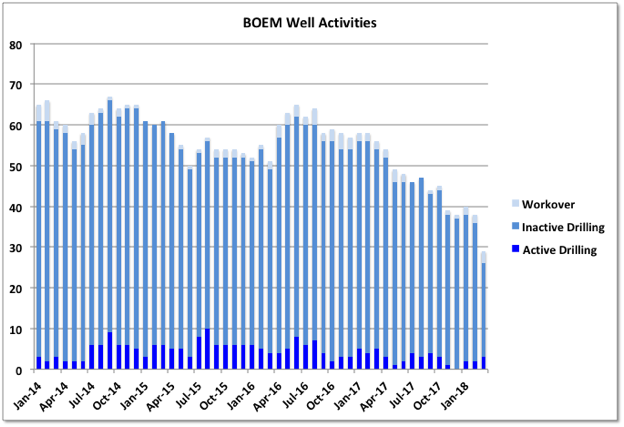
The combined new fields added from late 2014 look to be peaking as well. Great White came back on line but xxx and yyy declined. In previous data I had omitted one big producing lease in Mars, which included the new Deimos field. With this added the production growth through 2017 is higher (and as shown later the decline in mature fields faster) than previously shown. There may be more increase to come: the Mars leases had three rigs operating through June, one dedicated for Deimos, which has now gone. The two platforms on the field each have a dedicated platform rig, so they can continue with in-fill drilling and workovers as they wish. The Kaikias development will be tied into the Olympus TLP on the Mars field in 2019, but it’s a subsea tie-back so would need a separate drilling rig. The facility has nominal capacity of 100 kbpd, but that might be limited by the platform wells and manifolds rather than production trains – if not then Shell must be expecting some decline before Kaikias comes on line.

chart/

Stones start-up is still not looking good with an 8 kbpd fall – Shell are taking over the operation from SBM by buying the FPSO instead of leasing. Maybe this indicates poor operating performance (if so it’s something for ExxonMobil to be concerned with as they are following the same approach with SBM for Liza), or maybe just a convenient scapegoat. Julia, Cardamom, Stones, Jack and Lucius still have active drilling programs so may have opportunity for growth. Julia had plans for subsea multiphase pumping, I don’t know if that is operating or will be brought on as pressures fall.

Production from the South Santa Cruz and Barataria fields started in mid June (actually part of Fourier and East Anstey fields by BOEM naming). The first Horn Mountain Deep well, for Anadarko, started production in April, a second well is due to be spudded this quarter. These are the only new fields announced for this year. Anadarko was the only company that had hinted they may develop something else (e.g. with Warrior and Phobos tie backs), but with them slashing budgets for 2017 after poor second quarter results that is now be unlikely: in their investor presentation they indicated they expected flat production out 3 to 5 years, and didn’t sound particularly confident of that to me, and with no mention of Shenandoah so that might be on the way to full cancellation. One new lease in the Marmalard field (the last there) for LLOG was started in late May.

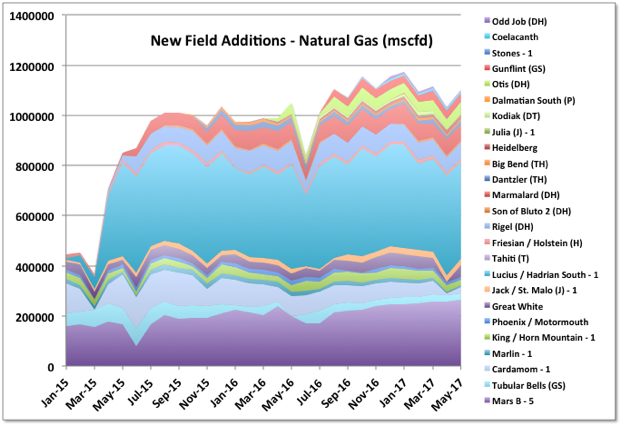
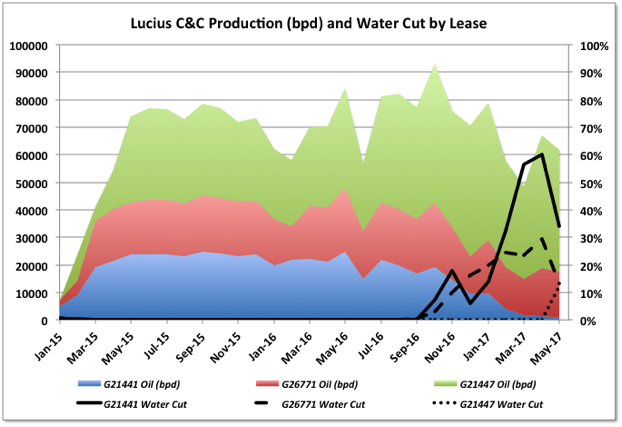
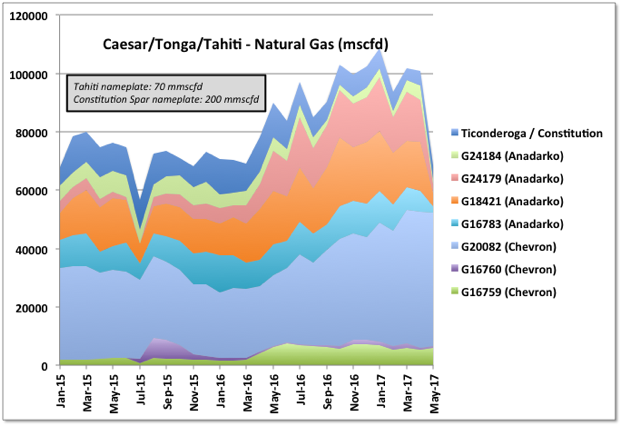
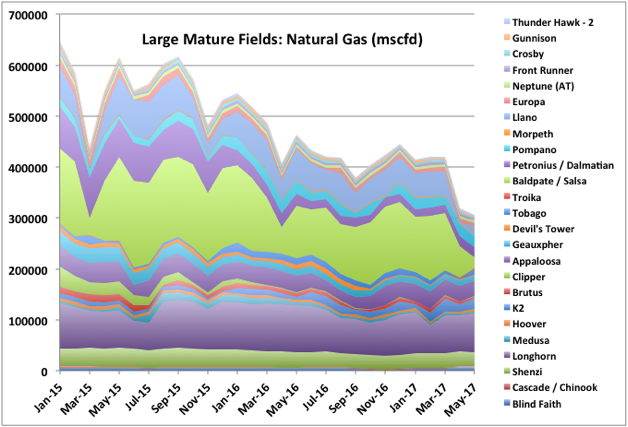
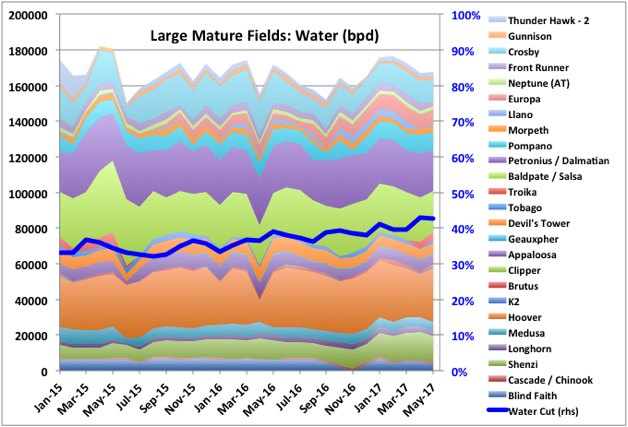
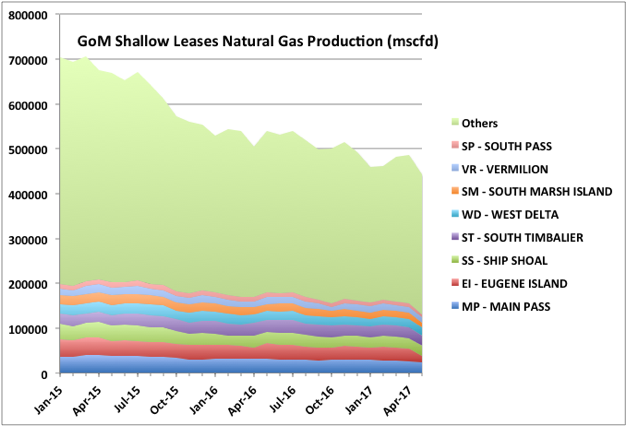
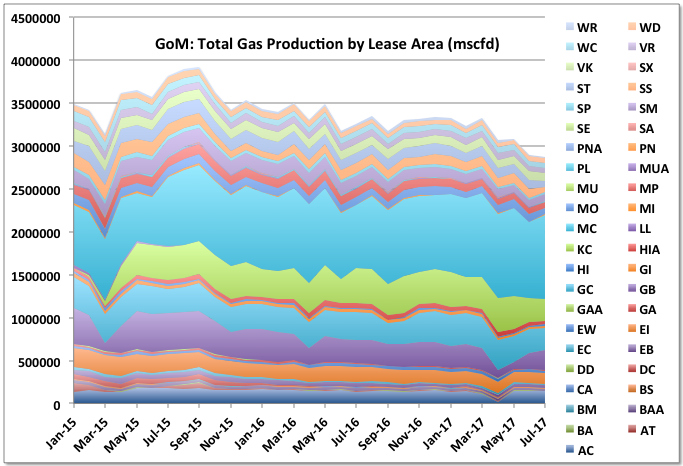
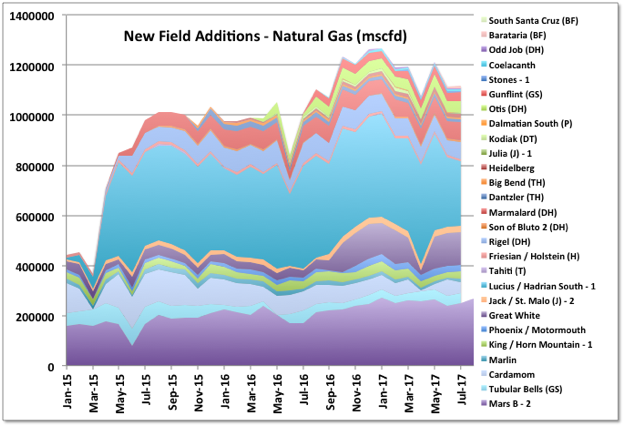
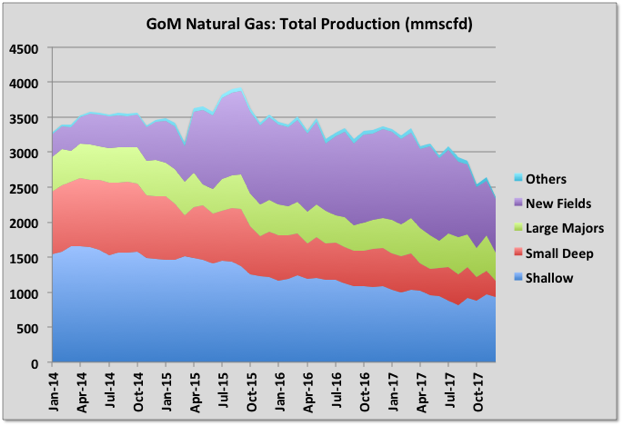
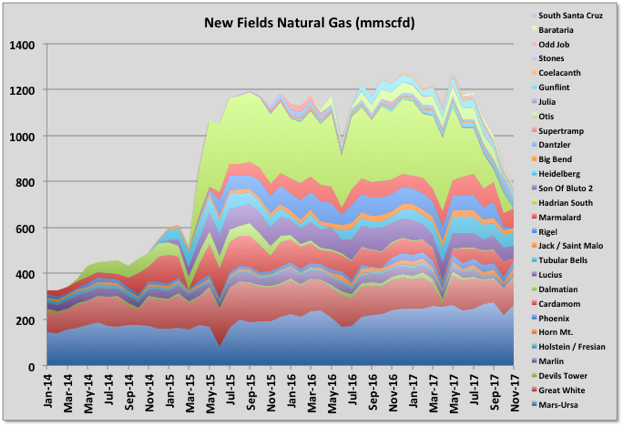
I’ve added natural gas production for the new fields here. Hadrian South and Otis are the only dedicated gas fields. Hadrian South production is a big proportion of the gas total from GoM now. It produces to the Lucius Spar, operated by Anadarko, and according to their investor presentation Hadrian South is supposed to finish by about 2021. I’m not sure if that can be correct, but if so it’s production should be declining significantly soon. Also on Lucius, it’s biggest producing lease, really part of Hadrian North field, started showing a sudden water cut increase in May, and dropped about 8% production (for some reason this does not show up in BOEMs list of qualified fields, but it is definitely tied in to Lucius). The first lease on the Lucius field has been killed in about two years with water break through; it’s not clear what their plans are for it (this is Anadarko as well).

chart/

chart/

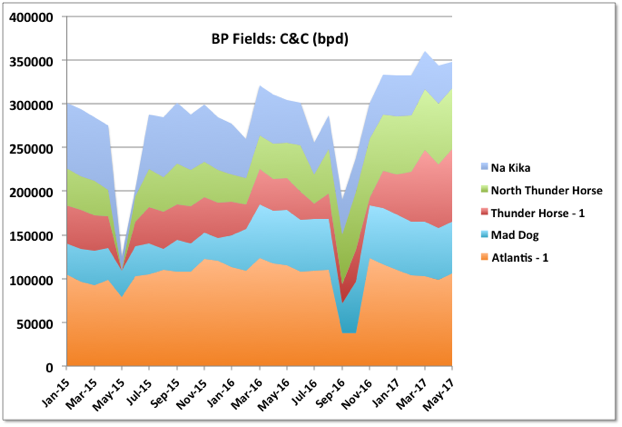
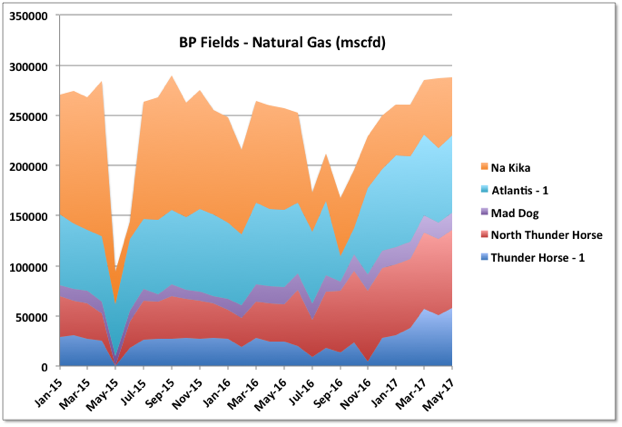
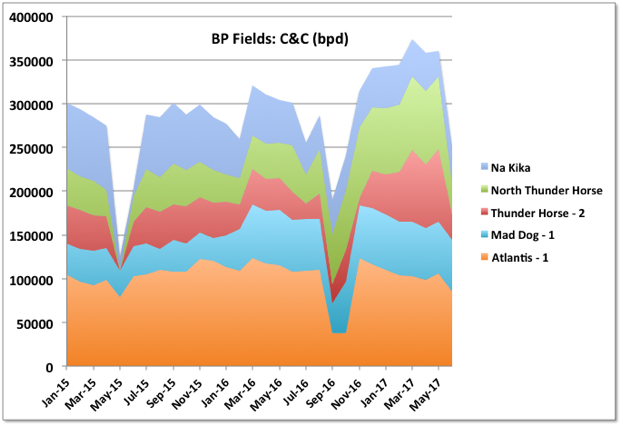
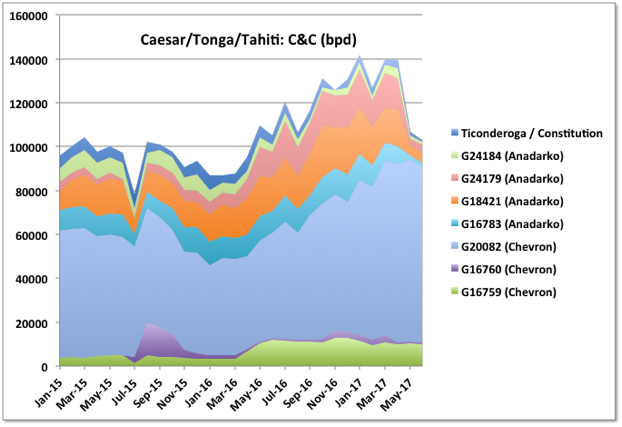
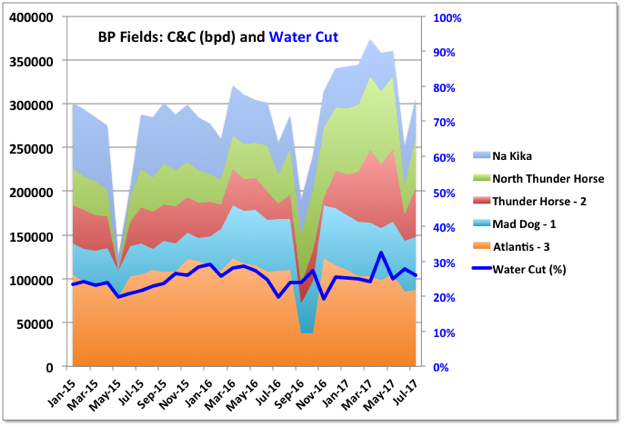
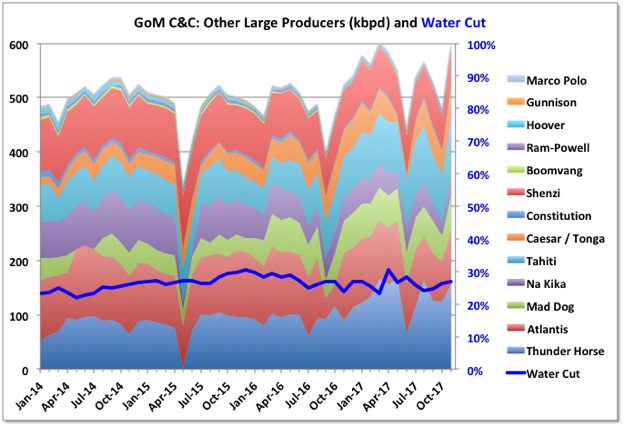
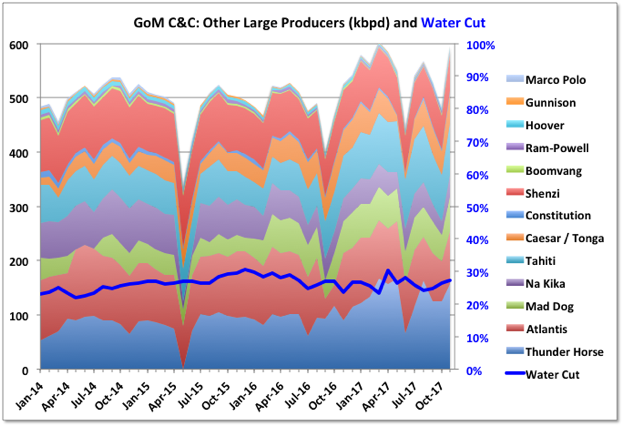
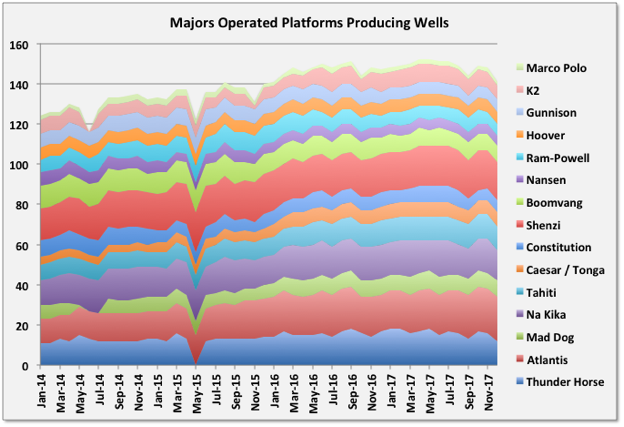
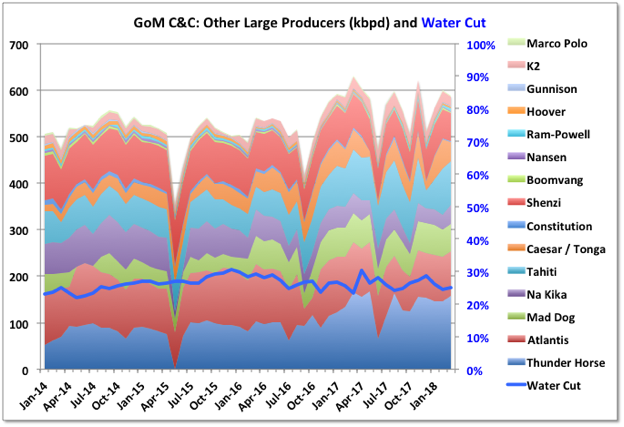
A couple of leases in Na Kika look like they have gone off line so production is down. Thunder Horse numbers were revised and now clearly show the impact from South Thunder Horse with about 35 kbpd increase. There have one rig still operating, but I think they will just maintain plateau now. Atlantis looks to be running about at nameplate capacity, so the coming North Atlantis development is likely only to be able to extend the plateau; there is one rig operating there now.

chart/

chart/

For the Caesar/Tonga/Tahiti fields the Anadarko facility (Constitution Spar) went off line taking off 40 kbpd production (Ticonderoga and Constitution fields go there too). The turn around was for 42 days so will reduce June figures too. The Constellation field is to be tied into the spar next year, the spar has nominal nameplate of 70 kbpd so another 25 or so (average) might be added to overall output.
chart/

For the Chevron fields in these leases it looks like production is limited by the gas handling capacity on Tahiti platform, at 70 mmscfd, which is pretty low given it’s oil capacity of 125 kbpd.

chart/

After a bit of a plateau from some brownfield work and new tie backs the decline in the larger mature fields looks like starting up again; the drop in gas is particularly noticeable, but is mostly due to Baldpate turn around. Overall water cut looks like it might be rising as well. Thunder Hawk has two new rigs operating, but I haven’t seen any announcement for new developments there. The smaller mature fields (not included in the charts) seem to be holding up quite well, I will try to get some individual lease data for these next month.

chart/

chart/

chart/

For the GoM activity report from the last week in July, there were 28 rigs drilling, twelve running tools and two in plug and abandon operation. I think the report can mean there is dual activity on a single well (e.g. wire line and drilling). Two rigs are predrilling on Stampede, one on Appomattox and one on Mad Dog II. For the newer fields there is development drilling on Lucius, Cardamom, Mars (two rigs), Stones, Julia, Jack / St. Malo, plus new wells for recently added or due production on Horn Mountain Deep and South Santa Cruz/Barataria. Atlantis also has a new rig, which may be for development of the Atlantis North discovery – it’s noticeable how any reasonable discovery is immediately fast tracked, the North Sea is similar. The Dorado field (operator Anadarko, discovery in 2014) is also being drilled; I think it is one of the last of wells for small fields (King, Dorado, Holstien Deep) being tied back to Marlin, there’s probably one more for King and a couple of others possible. Only Phobos has appraisal drilling.

Five rigs are drilling on unnamed fields, so presumably exploration – four of these are in Green Canyon, which means they are near field, and probably smaller, prospects; the other one is for Shell, in Walker Ridge, and probably a frontier wildcat. With all the predrilling on new fields, most new fields reaching plateau or decline periods, and few exploration wells (and fewer still in frontier regions) it seems likely that the drilling numbers will tend to decline over the next few years as unused well slots and tie back locations on the facilities are exhausted, even with an increase in oil price.

In the past few months as production rose the EIA STEO showed a new production forecast which had the same shape but was just raised to start on the new production number. They didn’t do the reverse as the production fell but instead kept the June STEO forecast with a single dip down for April. The August STEO, showing May data, is due next week.

GoM Lease Sales

As further support that the current decline in exploration is not just a function of price, the chart below shows the acreage of GoM leases that have been successfully auctioned, plus the percentage of offerings that were taken up (charts are stacked according to BOEM designated production areas to the give total). The numbers before about 1976 are listed against states (FL, LA, TX) and I think are inshore shallow leases, although it might be they just changed naming convention. After about 1990 areas were split from just GOM to east, central and west. The percentage bought calculation only considers the area auctioned after 1990. It is marked how the amount bought and the percentage bought both peaked and rapidly dropped off, even in the high price years through to 2014. However there were obvious impacts from earlier price collapses in the late nineties and 2008.

chart/

It’s possible to read too much into these charts but generally it looks like, on average, discoveries follow three or four years behind the lease sales and production about the same length after that. But the recent production rise isn’t in that pattern – maybe disrupted by the 2008 recession and 2010 drilling hiatus, or maybe the high oil prices after 2011 allowed some difficult and expensive long term discoveries to become commercial.

chart/

The number of open, undeveloped leases is relatively few, and declining. The chart below shows the number of leases discovered (and not terminated without development), producing or in development, and those still undeveloped. The open bars show my guesses for some larger fields that seem likely to be approved soon (e.g. Vito, Anchor). Most of the undeveloped leases (in yellow) are associated with existing, fairly recent, fields on production (e.g. St. Malo, Tubular Bells( and are likely to be poorer wells, waiting on surface facility capacity to become available before being tied in. There are two new field discoveries this year: Mormont and Khaleesi, by LLOG in Green Canyon (they have switched from Animal House to Game of Thrones naming convention) and are likely to be smaller reserves similar to their Delta House developments.

chart/

There is one area that might be expanding: deep shelf pre-salt. These are deep or ultra-deep wells but in shallow water (this is a rare combination and hence one problem is that there aren’t many rigs – jack-ups – that are suitable). W&T brought on Mahogany field this year, in an already producing lease (one well at 5000 boed with up to three others due, although the production data suggests it wasn’t as great as expected) and there may be more to come. The production is high pressure and high temperature, and in places can be too high for the available technology or commercial development, and mostly gas prone.

GoM June Production Update

0
0

A Guest Post by George Kaplan

Production

Production for June by BOEM was 1631 kbpd and by EIA 1636, compared with 1673 and 1659 kbpd, respectively, in May. The decline was mostly from Thunder Horse going offline and Constitution staying offline. Hurricane Cindy didn’t seem to have much of an impact, things will be different for the impact of Harvey on August figures.

Even with the two offline facilities coming back July numbers will struggle to beat those for March, and after that the depletion declines and hurricane disruptions take over. Note that the “others” area includes any assumptions BOEM has made to allow for missing data, which is quite a lot this month.

chart/

The combined new fields added from late 2014 are holding a plateau with South Santa Cruz and Barataria fields added and a new lease for Marmalard starting (adding about 20 kbpd combined). Stones also had a better month and achieved 70% of nameplate capacity. It’s interesting that five leases have come on line and then have effectively been killed off in this thirty month period: Amethyst (a small gas field that died after sputtering along for about six months, and not shown as the flow was so small), one lease in Lucius, Kodiak, one lease in Caesar/Tonga/Tahiti, and one in Rigel. Dalmatian South production fell immediately after start-up and was offline for a couple of months but came back in June (there are plans for subsea pumping to be installed but I don’t now the present status).

chart/

The big drops have been for BP, with Thunder Horse off line for part of June, and for Anadarko with the Constitution shut down extending into a second month (I think a bit longer than was planned).

chart/

chart/

Mature deepwater fields continue a general decline. Note for all fields there is some missing data for June and even in May – I have assumed production remains constant from the previous given month’s numbers in each case. For some reason Hess’s Tubular Bells has no reported figures for eight months now.

chart/

Shallow Fields

The shallow fields in the GoM are in steady decline for both oil and gas, but different leases are more oil and gas prone.

chart/

chart/

Production Breakdown

These charts show breakdown of production by company – most oil comes from four companies: Shell, BP, Chevron (including Union Oil) and Anadarko (their historical numbers include those for Freeport McMoRan, which they bought last year) – and by depth, which doesn’t tell me much, except maybe that ultra-deep hasn’t delivered as much as was once expected. Note these charts only go to May as June has a lot of missing data for the shallow leases (and some for May too I think, but it all comes from well numbers and there are too many to check).

chart/

chart/

Lease Expiry

BOEM provide data of when undeveloped leases have expired or will expire. There has been only one so far this year (Kaskida). However there are a lot due over the next few years, as shown below. Presumably they can be extended, though at some cost, but this may indicate a lot of development decisions (for both greenfield and browfield work) need to be made in the coming couple of years. Some of the big ones due this year are Shenandoah, North Platte and Yucatan; next year and 2019 there are a couple each in Rigel and La Femme, plus Anchor, Leon, Gibson and Samurai, and overall another six or so associated with older producing fields (i.e. that would require tie-backs or outreach drilling).

chart/

Drilling and Workovers

There are thirty rigs listed with drilling operations in the BOEM deepwater activity for 29th August, plus sixteen workover operations (in any of the charts if there is a number after a name it shows the number of well operations listed against that field). Six rigs have no field listed so are presumably wildcats. There don’t seem to be any appraisal wells in progress. Also any impacts from Hurricane Harvey aren’t apparent (the rigs that were abandoned were mostly jack-ups in shallow water so wouldn’t be included).

Off Topic Finish

This is a house designed by Frank Lloyd Wright for Marilyn Monroe and Arthur Miller but never built. It’s computer generated from his original design drawings, although the second floor private quarters are missing. At the site below you can take a walk though the rendering. Miller didn’t like it and they couldn’t afford it.

Archilogic

I don’t know much about architecture, and I’m not sure if I even know what I like, but Frank Lloyd Wright’s work is unique, he was not much of a fan of right angles. A lot of his designs never got built (as with many architects I expect), but like this many have been rendered in graphics packages, often as an example of their capabilities. He designed a civic centre and transit building for LA, which looks a bit like the Tyrell building from Blade Runner (which, amazingly, was set in 2019 – that seemed a long way away when the film first came out), though I don’t know if it was the model for it.

chart/

GoM July Production Update

0
0

A Guest Post by George Kaplan

GoM C&C production for July by BOEM was 1746 kbpd and by EIA 1761, compared with, respectively, 1631 and 1634 kbpd (corrected) in June. The EIA number is a new peak, the BOEM one is still 24 kbpd short of their March numbers. The growth was from Thunder Horse (partially), Constitution and Baldpate/Salsa (which is mostly gas) coming back on-line, plus continued ramp-up in Stones and Marmalard.

chart/

C&C Production Details

For new fields added since late 2014, data for Tubular Bell’s, which has not been available since late 2016, has been updated and shows a growth of about 14 kbpd in that period, hence there is now a slight continuing rise shown in new lease production over the past six months, rather than the previous plateau; Tubular Bells looks like it is now on plateau, about 40% below it’s nameplate, and there is no current drilling.

chart/

Dalmatian North (online in March 2014) and Dalmatian South (online in December 2015) are small oil fields, which are not performing very well and might well go off line soon. At the moment it looks like their production is cycled every three or four months. Subsea pumping is due to be installed for them in late 2018.

Heidelberg and Marmalard look to be about at their expected rate (Heidelberg is only about 50% of facility nameplate but I think more would have to come from additional tie-backs and I don’t see any drilling for that at the moment). Julia is the one reasonably sized recent addition that is still below nameplate and has current drilling, so could add another 15 kbpd, but with rapid decline in the first year based on the first well (it has subsea pumping installed but I don’t know how much that improves things). Stones is just about at expected capacity after what looks like quite a difficult start-up over about twelve months, but sometimes facilities can achieve higher rates early on, though I don’t know how long the approval process takes in the GoM to go higher.

The water cut on the new fields looks like it’s starting to creep up, a possible sign that the production is plateauing. Of all the new leases started since 2015 only one in Tubular Bells and three in Great White have pressure support from water injection wells (though Jack has provision to add it later). I think the other leases mostly rely on pressure depletion, with some partial aquifer drive or compaction drive support, which means that unless they are limited by surface facilities and have to be choked backed, and I don’t think many are as the facilities are generally operating below nameplate capacity, they will continuously decline unless new production wells are added. There are some older leases within the fields shown also with water injection, for Holstein, Mars-Ursa and King, but overall most of the production shown is likely now to start to show increasing decline rates as development drilling winds down, and as is already evident in a lot of the smaller fields.

chart/

Thunder Horse was back online for most of July following a prolonged turnaround. There is still drilling there so there may be some more production to come from South Thunder Horse. Atlantis also has a lot of activity, possibly for North Atlantis start-up next year.

chart/

The Constitution Spar also came back on-line after a long turn around. I’m not sure if there is any more to some in the Chevron leases produced through Tahiti, but there has been significant growth there over the past year (it was started in 2009 and a more typical production facility would be coming of plateau about now).

chart/

The deep mature fields continue a general decline at 15 to 20% y-o-y. The water cut has declined a bit, possibly as some of the older wells water out and are shut in.

chart/

The shallow wells show steady decline, note however that there is missing data for July, and probably a bit in June.

Hurricanes and Other Unplanned Outages

Thunder Horse was shut down and fully evacuated following a power failure mid September. That is a pretty major upset and shouldn’t happen (it would, in theory, require at least two independent failures), and would take a few days to find and correct the problem and get permission to restart. I wouldn’t be surprised if it was related to previous evacuations for hurricanes. Thunder Horse produces about 180 kbpd.

The estimates for hurricane related lost production were 84 kbpd (average over the month) for August and 60 kbpd for September – the Thunder Horse electrical outage might add another 20 kbpd to that. There may be some natural decline to add as well. On the other hand Thunder Horse was not at full capacity in the July figures, so could add another 40 kbpd when it finally gets there.

For natural decline rates the mature deep-water fields are dropping just under 80 kbpd per year and shallow fields about 40 kbpd per year, so maybe 10 kbpd per month overall. The new fields and the BP and Tahiti related fields also have natural decline on many of their wells but it is being covered by ramp-up of new fields and in-fill development wells. However both those sources are starting to ease off so the overall decline rate will start to climb, eventually to as high as 20 to 25% based on R/P numbers.

Overall then, there is likely to be a slight decline seen in the next couple of reports for August and September, but not as dramatic as the hurricane news might have suggested. However the impact from Nate in October, plus a bit from the shut-ins on Delta House following the subsea pipe failure and subsequent leak, will be more significant, around 300 kbpd on average, and with some knock-on impact into November and later because of the drilling rig outages and depending on how much of, and for how long Delta House production is lost. I will probably not put together another update until the November figures come out as it will be difficult to tell what is happening on individual fields given the various shutdown and restart disruptions, but it will be interesting to see what EIA do with their STEO predictions.

Natural Gas Production

Most gas production is associated gas and is in slow decline from a local peak in 2015 (note this was about 80% lower than the main peak in the 90’s when there were still large gas fields in operation). Most gas comes from the main deep water areas: GB – Garden Banks, GC – Green Canyon, MC – Mississippi Canyon, and KC – Keathley Canyon. The thin lines on the top of the chart are mostly shallow lease areas and are in steep decline at over 20% y-o-y. As oil decline picks up so will the overall gas decline.

chart/

The new fields gas production is now showing clear signs of decline, mainly coming from Hadrian South (the only recent, largish natural gas field that’s come on line, but with R/P of only a couple of years based on remaining reserves from January 2016 at nameplate capacity, so bound to decline fast at some time).

chart/

Recent Drilling and Leasing Activity

By the BSEE report for the last week of September there were 41 GoM well related activities in progress. Only two unnamed wells, indicating wildcats or appraisal, were being drilled: one, by BHP is Scimitar in GC 392 (which follows an announced oil show in Wilding-2 in a nearby block – Wilding-1 had a mechanical failure and had to be re-drilled); and one by Shell in WR 376. There are two P&A operations, eleven rigs running tools through wireline or coiled tubing, and twenty-nine active drilling rigs (including three predrilling for Stampede, Mad Dog II and Appomattox).

Total and Chevron have entered into an agreement to drill eight near field exploration wells around the Anchor and Appomatox discoveries. The first was spudded in July on the Ballymore prospect (MC 607), which is listed against the East Anstey field, so may not count as a true wildcat.

There were no new discoveries, start-ups or lease qualifications in September. One producing lease expired: Dalmatian, a small gas field started in March 2014; it had produced 30bcf and 0.15 mmbbls.

Recent Business Decisions

There has been one definite FID decision in September for Buckskin. That will be tied in to Lucius, which would suggest there are no expectations that the lease there that was killed off in a couple of years with high water cut will be recovering. Buckskin will use two 8” flowlines. I haven’t seen expected production but I’d guess around 20 kbpd, due in late 2019 for LLOG (after Chevron, Maersk and Repsol have all pulled out as operator). At one time a large, stand-alone development combined with Moccasin (now dropped as an active lease) was expected. It is deep-water, high pressure but uses riser base gas lift, which suggests a tight reservoir, and probably fast decline with depletion drive.

LLOG also announced tie-backs on a number of other small developments that are due in mid to late 2018 (I don’t know if these are formal FIDs yet, LLOG is a private company so doesn’t follow quite the same requirements as publicly listed ones, but these projects do have other partners who would need to agree): Clairborne, two wells tied to Coelacanth; Red Zinger, one well tied back to Delta House; Crown and Anchor, two wells tied back to Marlin; and La Femme / Blue Wing Olive (apparently a type of fly used in fishing), three wells tied back to Delta House. These will all be fairly small flows, I’d guess totaling around 45 to 60 kbpd nameplate and likely quite fast declining. All the wells to be tied back have already been drilled as exploration or appraisal.

In terms of net additional production there is little or no spare capacity on Delta House (before the leak it was at an average of 90 kbpd and rising on a nameplate of 100, and it is designed with minimum on-line sparing so availability would be low), so the additions there imply the existing production is expected to be declining: the sister platform, Who Dat, showed quite fast decline after three years, which is about how old the Delta House fields will be mid 2018. There is quite fast decline on a couple of the fields on Marlin already, but there is existing spare capacity. Coelacanth is only at 11 kbpd on a nameplate of 30 so there’s plenty of capacity but I think Claiborne is small even by recent standards.

On the other hand Anadarko, who had continued to be fairly active in exploration and development offshore, have signaled that they are going to use their cash flow for share buyback rather than seeking more growth (the Freeport MacMoran purchase last year may not be turning out to be such a great idea). With Anadarko cutting back LLOG is the most active player for developments at the moment though the recent pipe failure and shut down at the LLOG operated Delta House may delay things.

With these announcements there are now only five named discovered fields in the GoM that are not being produced or have fairly firm production plans, if not quite at FID yet – two small ones discovered this year, the other three also fairly small. There are a few other likely discoveries that have not been fully appraised and some undeveloped leases attached to existing fields.

Shenzi (shown as the largest producer of the mature fields in the chart above) is operated by BHP. Some activist investors there are trying to get the company to pull out of oil and gas completely. Shenzi is not a typical asset to sell, as it’s a fairly major producer in mid life. BHP is the fifth largest producer in the Gulf.

Well Permits

As an indicator of longer-term production trends well permit numbers come after lease auction bids. Exploration wells indicate possible discovery rates and later FIDs and development well numbers indicate expected production in the nearer term. BOEM has extensive and up to date permit records. The charts below show numbers from 2010, with the hiatus in drilling following the Deepwater Horizon accident clear in each. They all show oil, gas or injection well numbers as I couldn’t find anywhere that these are differentiated, however most will be related to oil fields. For the first two charts I’ve only included new wells and sidetracks – i.e. wells with newly identified targets – and excluded amendments and bypass wells. The exploration numbers include appraisal wells.

chart/

Shallow exploration has pretty much finished now, and development wells are also tailing off, with recent ones being sidetracks of older wells. Sidetracks mean well slots, and maybe wellheads, on exhausted wells can be reused for new targets without requiring new facilities (I’d guess there are now no free well slots on any of the older, shallow platforms).

chart/

Deep water exploration and development numbers are also declining but relatively slowly. However with recent low lease sales, a big drop in new projects coming on line and some of these development wells being predrilled for the few coming projects there could be a sudden drop next year (pace other influences, e.g. a sudden price rise might prompt more in-fill and exploration drilling).

chart/

For all permits, including amendments, numbers are steadier but still dropping slowly. Most of the action is in the four main deep water lease areas: MC, GC, GB and KC (see names above).

Off Topic Finish

EVs obviously have a lot of longer term advantages but whatever else they may do they don’t sound like classic supercharged muscle cars:

chart/

Kowalski


GoM C&C Production: November Update

0
0

A Guest Post by George Kaplan

EIA Reserves

EIA provides estimates of proved reserves based on information from the E&Ps on form EIA-23 for crude only, and also shows the categories for changes (discoveries, production, revisions etc.). This data with updates for 2016 has been due since November but so far has been twice delayed. BOEM make their own estimates for 2P (i.e. proved and probable) based on strict adherence to SEC/SPE rules (i.e. the reserve must be on production or be expected to be produced within five years). I think this usually comes out in May. In the absence of the latest EIA numbers I’ve presented the 2015 numbers with adjustments for subsequent production. There will be revisions and additional discoveries to include once the actual data is available though I think fairly small, especially for gas, but it will be interesting to see.

chart/

Despite excluding probable reserves and counting crude only, the EIA estimates have recently exceeded those from BOEM. It looks like a lot of the probable reserves were converted to proved through positive revisions in the period 2008 to 2011; i.e. possibly due to some price increases then, but also immediately following the SEC rule changes to exclude reserves without firm development plans, which may or may not be coincidental: the E&Ps may be less strict on applying the SEC/SPE rule, which they are allowed to do for large, long term projects. The BOEM estimates are pretty much flat over recent years as additions (which then become backdated “discoveries”) from new projects going through FID balance production, whereas EIA estimates are declining with revisions recently zero to negative.

chart/

Sales and acquisitions mostly balance out, sometimes with a year or so lag, though overall slightly positive, which I guess means the purchasers are able to get a bit more from the fields than the sellers. There are few extensions to conventional fields (unlike LTO where they are the largest positive factor) and discoveries have trended down significantly over the last three or four years (this would probably have happened a couple of years earlier but for the drilling hiatus caused by the Deep Horizon accident).

C&C Production

For November the production losses from Hurricane Nate have been recovered but more than 100 kbpd streamday was lost because of the subsea connector failure on LLOG Delta House Rigel template and the Shell Enchilada gas line failure. Total oil by BOEM was 1675 kbpd (up 211 kbpd m-o-m but down 16 kbpd y-o-y) and by EIA 1666 kbpd (up 209 kbpd from October, but down 21 kbpd y-o-y). Note that several leases did not report November numbers so I have had to estimate production based on data from the months before the hurricanes started to have influence.

chart/

New fields production has peaked for the time being, even allowing for the offline fields. Stampede might give it another boost once it comes on-line soon. The smaller additions are generally in decline, but there has been some in-fill additions for Horn Mountain, Holstein and Phoenix.

chart/

The large platforms, and Mars-Ursa should be considered with the ones listed, are holding and increasing production the best. I don’t know how much more there is to come, but certainly Tahiti and Atlantis have large brownfield developments in progress. The larger ones shown are around ten years old, which would normally be around the end of a plateau period, but equally they tend to have a lot of excess processing capacity. If nothing else some of them must be due for major turn-arounds in the next couple of years, which would take about as much production out for a year as Nate did.

chart/

The smaller, mature fields took a hit with Enchilada offline, but maybe not as big as might be expected given their continuing steep decline.

chart/

Shallow fields continue to decline. There was some headline news concerning Byron drilling the South Marsh Island 71 block, but it only has about 4,500 bpd capacity.

chart/

Recent News and Activity

The Enchilada pipeline is still offline with no date for restart published yet, which is keeping about 75 kbpd oil production offline from Baldpate, Salsa, Cardamom and Magnolia since early November. The workers injured in the incident have started proceedings against Shell for compensation due to safety failings. All these fields were in fairly steep decline so the production, and therefore revenue and interest, is only lost while they are offline rather than being deferred several years, as would be the case for a system on plateau. The subsea failure on the Rigel manifold feeding Delta House has resulted in Rigel, Otis and Son of Bluto 2 being off line for most of October and all of November (about 40 kbpd capacity). I have seen no news that this has been repaired. Without these two major unplanned outages November would just about have beaten the March record for production.

Anadarko relinquished the Phobos lease after poor appraisal well results. It had been the only qualified lease in the far south Sigsbee Escarpment lease area and was being planned as a long tie-back to Lucius.

Maersk Drilling has lain off workers that had been working on the Maersk Viking for ExxonMobil’s Julia field, which seems to have finished ramp-up although there had been plans for a phase II there. It had been in quite steep decline but there has been about 6,000 bpd increase in the flow over the last two months and it may be near a new peak. Stones drilling has also stopped, it has a nameplate of 40 kbpd but has only so far exceeded 30 for one month. Heidelberg drilling, too, has now stopped and it has achieved about 40 kbpd of a nameplate of 70 kbpd; phase II is due in 2021.

Tornado II started production in mid December at about 10 kbpd oil. Combined flow for Tornado/Phoenix is currently reported at about 21 kbpd oil, or net 8,000 bpd up on the average with Tornado I alone. There’s also been a big increase in the Horn Mountain lease, which has gone from less than 10 kbpd and declining in May, to now over 32 kbpd.

Two non-quantified discoveries have been announced as variously “major”, “significant” and “amongst our biggest”: Whale for Shell/Chevron, which does sound pretty big and is near the Perdido platform, and Ballymore for Chevron/Total, which is near Blind Faith. I suspect both will be tie-backs as the reason for concentrating on near field exploration was to save money on subsequent developments. Perdido has 100 kbpd nameplate and currently produces 66 kbpd, and Blind Faith has 60 kbpd with over 37 kbpd capacity available, and rising. Appraisal drilling is continuing on both, and that hasn’t always been as great as the initial announcements (e.g. Kaskida, Shenendoah and, recently, Phobos). I’m not certain, but think they both may count against last year’s discoveries and the announcements have been delayed to be immediately concurrent with the 2017 financial statements.

Wood Mackenzie was reported as giving predicted 2018 GoM deep-water production of 1935 kboepd, a new record. I think this is an average rather than a peak or exit rate, but I couldn’t find for sure. Note this is oil and gas (reported as including 80%, I think C&C only, but could be total liquids) and doesn’t include shallow water, which may be below 500’ (common industry limit) or 1000’ (BOEM limit), the report didn’t say. I don’t know why it was made so complicated, probably so they can declare a record of some kind that would help to try and sell the full report.

Currently (early February) there are forty-nine deep-water well related operations in progress reported by BSEE. Thirty-four are drilling related, with five pre-drilling for future projects and four on unnamed fields (so wildcats or appraisals). Of the fifteen running tools one is for P&A on Tick, which is fairly shallow water. Numbers in brackets on the production charts show the number of listed activities for each field. There is no current indication that the increased oil price is leading to increased drilling and the Baker Hughes count of active rigs has actually fallen slightly recently, though there may be signs of an uptick in non near field wildcats, but probably still early to say.

Future Production Scenarios

Below is an updated projected scenario (i.e. guess) for future production. The curves are adjusted so the total production in each section equals the estimated reserves for those fields from BOEM numbers for January 2016 less any production since then. Their estimates for this year (showing January 2017 numbers) have not yet been issued. For projects under development and discoveries I’ve used the E&P numbers for reserves, production and start-up where available or just made a guess. Numbers in brackets are nominal crude and condensate nameplate capacity for the expected development. I’ve included some nominal new discoveries with total reserves of 500 mmbbls, but may have to change that once the Whale numbers are announced.

I’ve also shown the 2018 BOEM production forecast, which I don’t fully understand. For instance they have on-line production suddenly dropping about 400 kbpd this year, but being made up with contingent numbers, which I would have assumed is possible development but can’t be; but also can’t be planned start-ups because there is nothing like that amount due this year. They also have a large amount of new discoveries that come on line very quickly – i.e. ten years to bring on line 800 kbpd, which would be some combination between eight big discoveries and eighty smaller tie backs. Nothing in recent history of exploration success or lease sales, or usual cycle times for deep-water projects, would suggest that is likely.

chart/

EIA STEO has its normal steady exponential rise, now extended through 2019, with bites out for hurricane season.

chart/

Off Topic Finish

Black domestic cats might be about to start to go extinct, as they don’t show up well on Instagram and the like. In one Bristol, UK rescue centre all forty cats that haven’t found homes are black. Owners of black cats are being particularly encouraged to get them neutered. The world is turning upside down.

chart/

GoM Production, 2017 Summary

0
0

A Guest Post by George Kaplan

2017 was the highest producing year for oil in the GoM and included the record month in March. Gas, which has tended to come from shallow water wells, had accelerated decline. The production would have been higher but for some disruptions from Hurricanes, in particular Nate, though that had the least impact onshore, and some unplanned outages in November and December due to equipment failures. The failure to Delta House subsea manifold affected Rigel, Otis and Son of Bluto 2 fields, and the first two still appear to be off-line while Son of Bluto 2 resumed production in December (LLOG, the operator, I think calls the Rigel field Neidermeyer, which is much better for the Animal House theme). The Enchilada gas pipeline appears to have ruptured at the main platform and has resulted in Baldpate, Salsa, Llano, Cardamom and Magnolia going off-line. Plans were recently announced to restart Baldpate/Salsa, which do not go through the platform, but I haven’t seen any notice of the restart.


Oil Average

Oil Exit Rate

Gas Average

Gas Exit Rate

Total Average

Total Exit Rate

  (kbpd) (kbpd) (mmscfd) (mmscfd) (kboed) (kboed)

2016

1600 1728 3308 3363 2151 2289

2017

1685 1570 2955 2381 2177 1967

Change

85 -158 -354 -982 26 -322

Ratio

5.3% -9.1% -10.7% -29.2% 1.2% -14.1%

C&C Production

December production numbers were dominated by the unplanned outages, so comparisons with November don’t mean much. As well as the two issues given above the Tahiti and Caesar/Tonga fields were off line for a few weeks, though I have seen no news why (these share a common set of leases but are produced separately to the Tahiti and Constitution platforms). Each month that these are three issues hold current outages would knock about 10 to 12 kbpd off the achievable average production for 2018.

chart/

Despite recent variability it certainly looks like the new fields brought on since late 2013, and which have seen all the net growth since then, have peaked. Any average decline rate can’t really be extrapolated yet, given the recent upsets, but the BOEM reserve estimate updates, due in the next couple of months, will provide better R/P numbers as there will be longer operating data for all the fields.

chart/

BP, Shell, Anadarko, Chevron and BHP have completed a lot of brownfield work and in-fill drilling to maintain production at their large, operated platforms, but they may be running out of options for the next couple of years, and there is some evidence of rising water cut in some of the larger leases at Shenzi, Atlantis and Thunder Horse (and also in West Boreas, a recent start-up for Shell in Mars-Ursa).

chart/

Natural Gas

Natural gas production saw accelerated decline through 2017, mostly from rapid decline of Hadrian South and the Enchilada outage. Shallow fields added some production late in the year, all from one lease in the Eugene Island area.

chart/

chart/

Apart from Hadrian South most of the gas from new fields is associated with the oil production and will decline in line with that. Otis is a small gas field that has been held offline by the Delta House outage.

chart/

The impact from the loss of Baldpate / Salsa production, which are mostly gas producers, is shown here, however also evident is how fast those fields had been declining anyway since 2014.

Hadrian South

Hadrian South looks to have finished. Production had been dropping fast since the summer and then, in October and November, water production appeared and gas flow stopped. On plateau it produced 300 mmscfd from only two wells, which is pretty prolific and slightly higher than planned. The wells had been producing about equally but one died between May and July and the second in November. Both were offline throughout December. Overall the field’s total recovery is lower than the BOEM reserve estimate, but only by about 38 bcf (6.5 mmbbls) so it’s questionable whether there will be any further efforts at increased recovery, certainly in the near future as there is no drilling rig contracted there, although there is another qualified lease for the field that has not yet been produced.

chart/

Production Wells Creaming Curves

The following two charts show the number of producing wells for new fields and the larger, mature platforms. They both show how wells were added from 2014 through 2016, leading to the increased production in these two groups, but both numbers have now flattened off, which is likely to precede the start of a decline. For the new additions the move to tie-backs with one or two wells in 2016 and 2017 is evident and the continuous development at Mars-Ursa also stands out.

chart/

chart/

Drilling Activity

By Baker-Hughes active drill rigs averaged 20 in 2017 compared to almost 23 in 2016, and the numbers have continued to drop this year with a low of 13 earlier in March (the lowest since 2000, though the drop in shallow gas drilling is responsible for, by far, most of the change).

chart/

BOEM gives a monthly break down of each well by category, and it is noticeable how the number of wells being drilled has fallen off in the second half of 2017. (I think inactive wells are those that have not yet seen any production, but sometimes these are counted as “temporarily abandoned”, of which there are many and therefore it’s impossible to pick out new ones from old.)

chart/

2018 Plans

The Stampede platform started up in January. It has nameplate of 80 kbpd but some of that is for potential future tie-backs. The wells are pre-drilled and it should reach 50 or 60 kbpd streamday production quickly, though maybe not with high availability initially.

LLOG plan to bring several fields on line with one to three well tie-backs to existing platforms. However Red Zinger and La Femme / Blue Wing Olive go to Delta House. The subsea system is likely to be fixed when these are due, but the Platform was operating at nameplate capacity and with extended production deferral may not have processing capacity for these new wells this year.

Anadarko has planned five wells in existing fields, in particular for Constellation with BP, which will be about 15 kbpd. Anadarko have stated that they are looking at redeploying spar platforms onto other fields (probably for Shenandoah). I think that means one or more of their developments are nearing end of life, despite recent near field tie-backs, and that their remaining green field prospects are not very attractive at current oil prices. The platform mentioned was Marlin, though they have other mature Spar facilities like Holstein, which may impact LLOG as their tie-backs for Crown & Anchor are due to go there (but may have relatively short lives) and also is the site for two of this years new wells so maybe this is just conceptual speculation at the moment.

Big Foot is due at the end of the year. It was originally planned for 2015 start-up but had mechanical failures during installation, which are now fixed. Capacity is 75 kbpd nameplate. It is heavy oil and uses dry trees with ESPs. Two wells are pre-drilled but the rest only have the top two conductor sections ready, therefore ramp-up will be through 2019 as new wells get completed.

Off Topic Finish

This painting is by Mary Cassatt. There has been no better painter of children before or since. One theory for this is that she was a woman in, at the time, a man’s field, and the men all tended towards painting nudes; but maybe she was just really good at it. The greens in the carpet and blues in the chairs are gorgeous, though better in real life than here (it’s home is Washington DC), the dog is happier than it has any right to be, and I can’t help thinking the girl grew up to like an occasional night on the town.

chart/

GoM: First Quarter 2018, Production Summary

0
0

A Guest Post by George Kaplan

Crude and Condensate

BOEM has March 2018 production at 1696 kbpd, which is down 1% month-on-month and 4% year-on-year (March 2017 was the peak production month for GoM so far). EIA numbers were very similar, although last month’s were higher and haven’t been revised yet – typically EIA numbers end up almost exactly corresponding to the BOEM reported total qualified lease production, whereas BOEM can be a little higher, maybe including test wells or non-qualified leases.

chart/

The major new project, Stampede, started in January, has no reported production numbers yet. BOEM and EIA estimate non-reported values and then retrospectively adjust their reports when actual numbers are available. I don’t know how they estimate new production but Stampede could produce around 60 kbpd with current plans, though likely a lot less initially as only one of two leases has been ramping up. I’ve assumed 20 and 40 kbpd for February and March respectively, which still might be high. Even allowing for that, and assuming other late numbers are the same as the previous month, since December EIA and BOEM both have estimates about 30 to 40 kbpd higher than the reported lease and well production numbers (which always match closely) would suggest. Usually the difference is no more than ten. It is unlikely that the other late numbers, of which there are few, and none for all four months, will show such large, sudden and unexplained increases so either I’m missing something (maybe a lease not yet included in the numbers, but also not reported as starting up) or there could be some future downward adjustments.

Rigel and Otis are still off-line following the failure at a subsea manifold last October and are taking out about 22 kbpd plus some gas (Otis is a small gas field). Great White, Stones (for the full month) and Caesar/Tonga all had noticeable downtime in March taking about 90 kbpd off-stream.

chart/

The Kaikias Phase I development for Shell, a tie-back to the Ursa hub, was brought on line one year ahead of schedule in early June. It has an expected peak nameplate of 40 kboed (which may only be around 30 kpbd average oil), and will likely take a bit of time to ramp up to maximum. Equally to accelerate production like this probably meant using a drill rig that was previously scheduled for alternative wells on Mars-Ursa, so there may be faster than previously planned decline on some of the other leases there.

In the second quarter there is likely to be downtime showing for Marlin, Horn Mountain and Holstein as they have planned turnarounds to prepare them for new production and, presumably, to allow normal maintenance; they should then come back online with higher overall flows. Marlin has one new Anadarko well planned, plus two from LLOGs Crown and Anchor field. Holstein has a platform rig and is developing four side-track wells this year and next. Horn Mountain has one more tie-back from Dorado field planned.
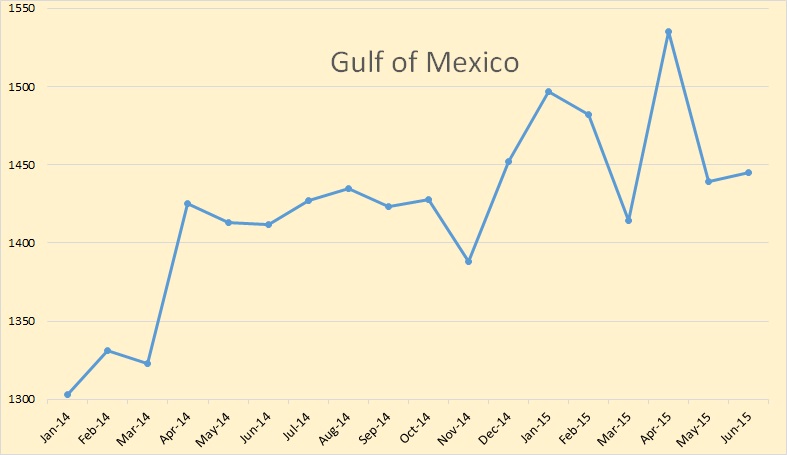
chart/

Atlantis has no drilling or work-over activity currently shown and in the past its wells have declined at around 20% year-on-year (see below), which may continue until the first Phase III wells come on line in 2020.

chart/

Llano, Cardamom and some of Baldpate/Salsa production came back on line following the partial repair of the Enchilada pipeline, adding around 45 kbpd, but there is some still off line, which I think has to be processed through the Enchilada platform and for which I’ve seen no expected restart news; however Anadarko have said it will be “later this year”, which I’d take to mean a few months yet. All these fields are fast declining so although they give a jump for March they will result in steeper declines for the remainder of the year

chart/

The BSEE deep-water activity report showing wells with drilling, completion, P&A or work-over activity currently shows 40 actions, this is down from around 50 at the beginning of the year and has been fairly steady for the past two months.
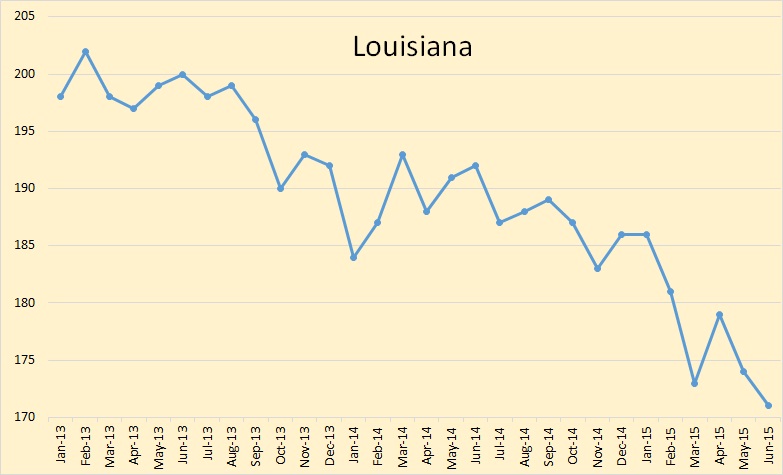
Overall C&C looks to be continuing an overall slow decline started in the second half of last year, and if the unaccounted for 40 odd kbpd is revised out, then it is clearly accelerating. A lot will depend on downtime for turnarounds and hurricanes. So far this year these losses look higher than last (e.g. the early Tropical Storm Alberto took out about 7 kbpd for about a week, and also disrupted P&A activity on Lena and installation work at Appomattox) plus Mars-Ursa looks set for a partial shut down in April and the current Perdido / Great White turn around looks to be quite prolonged. Another major unplanned outage, like Enchilada or Delta House, is also possible. The Kaikias development by Shell has been advanced, but that may be countered by delays to Constellation, Hadrian North and some Delta House tie-backs.
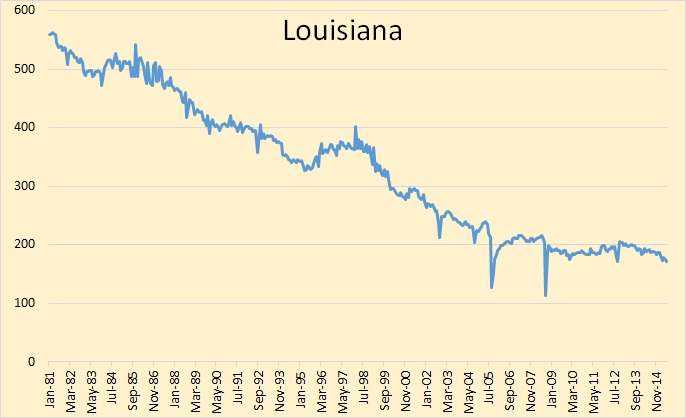
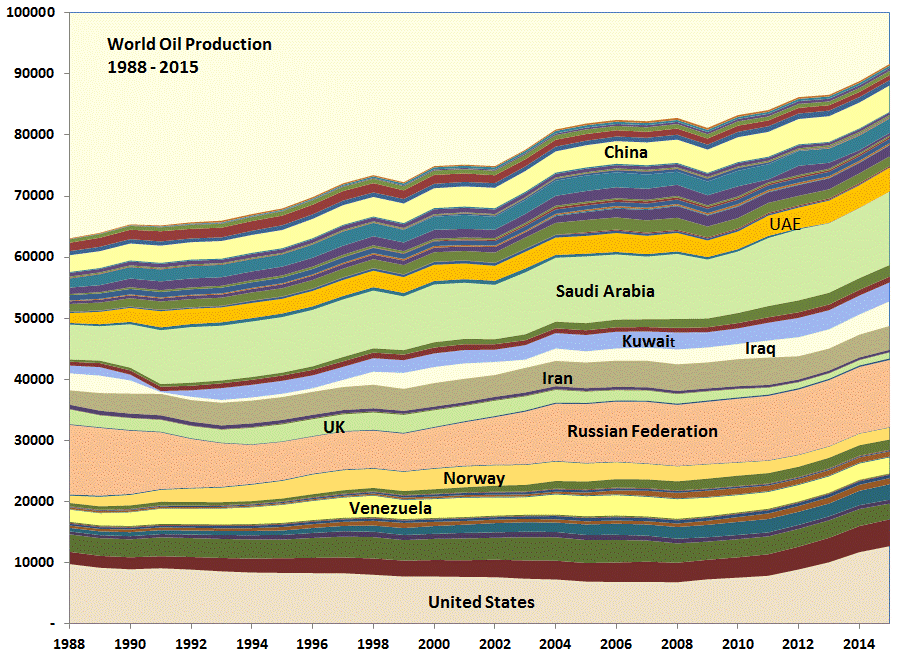
Natural Gas

Natural gas production is in continuous decline. BOEM had March production at 2.59 bcfd, down 1% month-on-month but 21% year-on-year. The loss of 300 mmcfd from Hadrian South since last year and the losses from Baldpate / Salsa, one of the few other remaining significant gas fields, and Otis, because of the Delta House failure, meant last year showed accelerating decline which is unlikely to recover. Na Kika has a few gas leases, and a new long distance tie-back, Coulomb II, is due soon, but mostly the gas now is associated with the oil and will decline accordingly.

chart/

Deep Water Well Decline Rates

I had a go at finding the decline rates of the wells in the more recent deep-water fields. In the charts below for each field all the wells are lined up so month one is their first production or January 2014, whichever is later, and a decline curve is fitted, from the third operating month to avoid the ramp-up period, assuming all wells in a field follow the same exponential decline and according to how many wells were producing for each month.

Most of the fits came out reasonably well. Six of the largest fields are shown in detail below. The overall (stacked) decline curves indicate the expected decline rate for all the wells remaining online, they are not predictions of future production.

chart/

The fields where the fit was poor were either new projects that are still on plateau, have had fairly patchy start-ups, or have produced a lot of water (or all three) and include Lucius, Stones and Odd Job; or ones where there has been some sort of well rework, e.g. K2, which had gas lift added, and Mad Dog, which had various new measures including water injection added on some blocks. I didn’t include Na Kika as it is a collection of several different fields, some of them gas, and has a pretty uneven production history. The individual decline rates for each field are shown in parentheses after the name and run from 0% for fields on early plateau, up to 40% and with a pretty good spread between.

chart/

The decline rate for the fields analysed is likely to increase because of new projects coming off plateau, water breakthrough or acceleration (e.g. at Great White, Mad Dog, Lucius and Mars-Ursa might be the most likely) and a normal development feature that the best wells are drilled first; but overall that would likely be balanced by new projects reaching plateau. The overall average decline rate came out as 16%, which is maybe not surprising given that depletion rate for the whole GoM based on BOEM 2P numbers for 2016 (the latest available data) was also 16%. With depletion and decline close it would imply there isn’t much being added to reserves on operating fields, or any that has been was quickly put on-line.

Applying these decline rates to the 2017 field production rates gives an expected drop this year of 175 kbpd. Shallow fields are likely to decline 30 kbpd and the deep-water fields that I didn’t include about 45 kbpd. So total would be 250 kbpd; assuming 90% availability that would require 275 kbpd of additional nameplate capacity added to hold production steady.
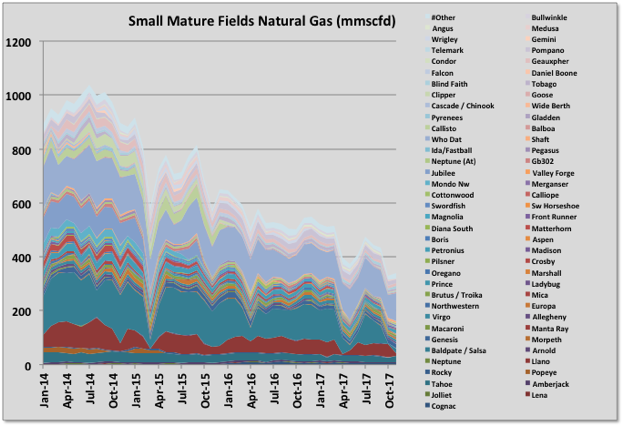
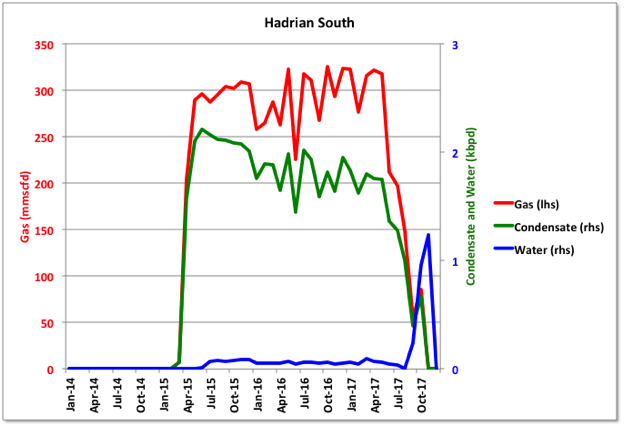
2018 and 2019 Developments

The only certain major new fields this year are Stampede, adding up to 60 kbpd, and Kaikias Phase I, which may add about 20 kbpd averaged over the year. Constellation was due but looks to have been pushed into 2019, and Big Foot is due late but may not contribute much to the average, although could boost the 2018 exit rate. There are four smaller field tie-backs for LLOG with one or two wells: Red Zinger, Crown and Anchor, Claibourne and La Femme / Blue Wing Olive. Some of these may be limited by available capacity at the host, and will contribute only in the second half of the year. Recent small field wells tend to start at around 6000 to 8000 bpd and immediately decline, but those fields together could add 50 to 60 kbpd at end of year. Bigger wells are likely to come from in-fill and development drilling at Jack / St. Malo (two wells), Horn Mountain Deep and Marlin for Anadarko (three wells, but very high decline rates if they are like the recent ones), Tonga (I think one last production well), one side track well at Holstein (with three more next year), continued BP drilling at Thunder Horse, and Shell projects at Mars-Ursa, Stones and Great White. BP and Shell wells may add the most but they are also the ones with the least information.

There should be some offline production returning at Rigel and Baldpate, maybe 40 kbpd, but also fast declining. With the new fields that would leave 120 to 180 kbpd needed this year from the in-fill drilling to keep annual rates about average (the range is dependent on the timing of all the wells coming on); I think that is going to be difficult. Next year decline is likely to accelerate because a lot of the mentioned in-fill wells and tie-backs are the last available for those projects and some of the rigs are being released, plus Kaikias has been accelerated, so will contribute less additions next year than originally planned. Atlantis Phase III has also been moved back to 2020. 2019 has some planned continued development for Thunder Horse, tie-backs for Hadrian North and Buckskin to Lucius and the delayed Constellation tie-back to Constitution, but overall things look thinner than this year, at least until Appomattox (with 175 kboed nameplate) begins ramp-up towards the end of the year.

The drop off in the number of wells showing drilling or work over in the chart below highlights the possible slowdown coming in 2019.

chart/

Better projections will be possible when the BOEM reserve estimates for the end of 2016 are available. These are quite late compared to last year, but in the past they have come out in July or August, and EIA reserve estimates were also pretty late this year.

EIA Forecasts

The above summary for near term new developments and added production does not agree much at all with EIA predictions, either in outcome or details: U.S. Gulf of Mexico crude oil production to continue at record highs through 2019

Among the fields given it lists significant new oil production as expected from: Amethyst, a small and failed gas project and Phobos, both of which are rescinded leases with no current activity; Otis, an existing gas field; Son of Bluto 2, a small oil field started in early 2016 with no current drilling and indicating slight decline; Rydberg, a recent Shell discovery with reported 100 mmboe resource base, which I think would be a later addition to the Appomattox project; Gotcha, a lease which is part of Great White, started in 2014 and in slow decline; and Bushwood, a single gas well tie-back started in 2014 and now almost exhausted (although there has been some drilling there this year). There is little new oil, or much significant oil at all, in that collection.

It does also list Horn Mountain Deep, Stampede (though listed as two fields, when it is really only one) and Kaikias, which will be bigger contributors, but not enough by far to meet the given growth expectations (and I think the Horn Mountain developments will be showing rapid decline by next year).

It does not mention Big Foot, Appomattox, Buckskin, Hadrian North, Red Zinger, Crown and Anchor, Claibourne or Blue Wing Olive as new fields, or the Thunder Horse developments and other Anadarko in-fill wells. I don’t know how they come up with their assessments but they seem to be getting more removed from actuality, and not just from being overly optimistic. Similarly the EIA STEO is just a constant exponential growth that is re-zeroed each month to current production figures with no changes made based on FID decisions, reserve numbers or overall production history.

Off Topic Finish

As the last country music link went down fairly well here is another. Two minute thirteen seconds of downbeat alt.country bliss. It’s the title track of an album that I always expect to see in ‘Top XXX’ lists, but never have, which shows how much I know. The singer and writer, Willy Vlautin, also writes books, one of which, “Lean on Pete,” was made into one of my favourite films of the last year, a classic American road movie with a sort of happy ending (though not for Pete).
Richmond Fontaine

And here is Vlautin’s new band, more traditionally country, with an apposite song (I think the singer is the sister of the vocalist on the previous tune).
The Delines

USA and World Oil Production

0
0

All data below is from various sources. All US data is from the EIA. Unless otherwise noted is in thousand barrels per day.

USA data is through April. C+C production was almost flat in April, down 2,000 bpd.

Texas through April. Texas production was up 30,000 bpd in April.

North Dakota through April. North Dakota production was up 61,000 bpd in April.

Alaska through April. Alaska production was down 15,000 bpd in April.

The Gulf of Mexico through April. The GOM was down 98,000 bpd in April.

USA net imports averaged over 12,500 kbpd in 2005 and 2006. They are now down to around 3,400 kbpd.

China data through March from the EIA.

Canada through March, EIA.

Mexico through March, EIA.

Norway and the U.K. through March. I have included historical data here in order to show the total decline from their peaks around the turn of the century. There has been a recent uptick in production from both countries.

Data for this chart is from the Russian Minister of Energy and is through June. Russian production was up 89,000 bpd in June.

World production through March. World C+C production was down 305,000 bpd in March.

World less USA through March. Without the US input, World C+C would have been down 520,000 bpd in March if the EIA’s figures are correct.

Non-OPEC production was down 63,000 bpd in March.

Without US production Non-OPEC would have been down 278,000 bpd in March.

Thanks to Dr. Minqi Li, Professor, Department of Economics, University of Utah for that fantastic post: World Energy 2018-2050: World Energy Annual Report (Part 1)

I don’t do natural gas or coal but I do have a few comments on his oil numbers. In the table below I have converted metric tons to barrels using 7.33 barrels per ton. All data is in billion barrels. I have calculated cumulative production by subtracting RRR from URR. Even though their estimate of URR may be highly inflated, and I believe it is, this makes no difference because they calculated RRR by simply subtracting cumulative production from their estimate of URR. I simply reversed that process.

All data is crude plus natural gas liquids. Of course, that includes condensate.

I think the EIA data for the US is highly inflated. They are grossly overestimating the input from shale oil here. The BP data for OPEC, obviously what BP has done here is just to take each OPEC nation’s word for their reserves. I have no comment on their Canadian numbers.

The Hubbert Linearity method was fairly accurate before the age of creaming. As long as conventional wells were used, the Hubbert method gave you a pretty good estimate of URR. And you could also calculate the probable decline rate with the Hubbert method. But no more. A field is creamed by massive infill drilling with horizontal wells that skim the very top of the reservoir. The decline rate is then drastically reduced while the depletion rate is drastically increased. Things will go just great until the water hits those horizontal wells at the top of the reservoir. Then production will drop like a rock.

Daqing was creamed. A UPI article from December 2014, China’s largest inland oil field depleting, had this comment.

The field has produced more than 15 billion barrels since operations began in 1960. Last year’s annual production was around 290 million barrels, though that should fall to around 234 million barrels by 2020, the employee at PetroChina said in an interview published Sunday.

In 2015 Daqing produced about 800,000 barrels per day. If it were to produce 234 million barrels in 2020 then that would be about 640,000 barrels per day or a decline of about 160,000 bpd. Looking at the chart below I think those figures are extremely optimistic.

China’s production has dropped by over 400,000 barrels per day in the last three years. And the lions share of that decline has to be Daqing.

In the table below I have converted the data Dr. Minqi Li presented in metric tons per year to million barrels per day. Again, this is C+C plus natural gas liquids.

The source for this chart is the same as the table above. I believe due to OPEC massively inflating their URR, and the inaccuracy of the Hubbert method due to the creaming of all giant fields, the expected peak dates here are highly inaccurate. Well, all except three. The rest of the world did peak in 2004, China did peak in 2015, and the world will peak by 2021 or before. Congratulations to Dr. Minqi Li, the most accurate future peak there is the one that he calculated.

U.S. & World Oil Production and ExxonMobil Outlook

0
0

Here are the latest oil production numbers from the EIA. All data is in thousand barrels per day unless otherwise noted.

The USA through May 2018. The upward surge has stalled for the last two months. US production was down 30,000 bpd in May.

It is a little astonishing how close the Texas chart resembles the USA chart. Texas is, by far, the USA’s largest producer. As Texas goes, so goes the USA. Texas production was up 20,000 bpd in May.

North Dakota production has increased significantly in the last two months. They were up 67,000 bpd in April and up another 25,000 bpd in May.

Gulf of Mexico production was down 99,000 bpd in April and down another 75,000 bpd in May.

Alaska was down only 1,000 bpd in may but that was 12,000 bpd lower than last may. They are now entering the maintenance season. Expect huge drops in June and July.

The EIA data in this chart is through April and the National Energy Board data is <b>estimated</b> through December 2018. The EIA data is usually lower than the NEB data but they both agree on April production.

World crude oil production was up 326,000 bpd in <b>April.</b>

Non-OPEC production reached a new peak in April, up 405,000 bpd to 47,159,000 bpd. Most of that increase was Canada, up 317,000 and the U.K., up 111,000 bpd.

Here I am adding a few charts and comments from ExxonMobil’s 2018 Outlook for Energy: A View to 2040. Their text is in italics. Any bold in their text is mine.

• Technology improvements lead to wind, solar and biofuels increasing, with a combined growth of about 5 percent per year
• Non-fossil fuels reach about 22 percent of total energy mix by 2040
• Oil continues to provide the largest share of the energy mix; essential for transportation and chemicals
• Natural gas demand rises the most, largely to help meet increasing needs for electricity and support increasing industrial demand
• Oil and natural gas continue to supply about 55 percent of the world’s energy needs through 2040
• Coal’s share falls as OECD countries and China turn to lower-emission fuels
• Nuclear demand grows 70 percent between 2016 and 2040, led by China
• Wind, solar and biofuels reach about 5 percent of global energy demand

They assume that supply will always evolve to meet demand.

This is what they say we will need in 2040 and will therefore be delivered by technology.

And here is where all that oil will come from. North America is the US and Canada. They count Mexico as part of Latin America. In 2040 they have total North American conventional production down to about 3.5 million barrels per day.  They have at about 12 million bpd and oil sands at about 4.5 million bpd as best as I can eyeball the chart.

They have almost all conventional oil coming from the Middle East and Russia/Caspian. Caspian is mostly Azerbaijan.

• Global liquids production rises by 20 percent to meet demand growth
• Technology innovations lead to growth in natural gas liquids, tight oil, deepwater, oil sands and biofuels
• Technology enables efficient production from conventional sources, which still account for more than 50 percent of production in 2040
• Most growth over the Outlook period is seen in tight oil and natural gas liquids, which reach nearly 30 percent of global liquids supply by 2040
• Continued investment is needed to mitigate decline and meet growing demand
• Liquids trade balances shift as supply and demand evolve
• North America swings to a net exporter as shale growth continues
• Latin America exports increase from deepwater, oil sands and tight oil supplies
• The Middle East and Russia/Caspian remain major oil exporters to 2040, and Africa shifts to an importer
• Europe remains a net oil importer, as demand and production both decline
• Asia Pacific imports increase to 80 percent of oil demand in 2040

This chart is a little shocking. They have total liquids declining to about 18 million bpd by 2040 without investment. That means if everyone stopped drilling today, or in 2016, that would be the natural decline of what is online today. But to meet demand we will need 97 million barrels per day of new oil.

And this is what they say we have left, about 4.5 trillion barrels of remaining recoverable resources.

• Without further investment, liquids supply would decline steeply
• More than 80 percent of new liquids supply needed to offset natural decline
• Per the International Energy Agency, about $400 billion a year of upstream oil investment is needed from 2017 to 2040
• Global oil resources are abundant
• Oil resource estimates keep rising as technology improves
• Technology has added tight oil, deepwater and oil sands resources
• Less than one-quarter of global oil resources have been produced
• Remaining oil resources can provide about 150 years of supply at current demand

So not to worry. Peak oil will not be reached in your lifetime, or in the lifetime of your children, grandchildren or greatgrandchildren. Well, that is if these estimates are correct.

Jean Laherrere has a different outlook. He just posted me the below comments and chart. I could not get the chart to post in the comments section so I put it up here.

dear Ron

In your last good post on U.S. & World Oil Production and ExxonMobil OutlookYou mention the optimistic forecast by ExxonMobil on North America exportI sent you my last papers, which are on the site of ASPO France:

-Laherrere J.H. 2018 “Graphs on North America oil & gas net imports” ASPO France meeting 5 June 2018 https://aspofrance.files.wordpress.com/2018/06/namnetimportforecasts.pdf

-Laherrere J.H. 2018 “US, Canada & Mexico oil & gas production, consumption & net import” May https://aspofrance.files.wordpress.com/2018/05/uscame2018.pdf

-Laherrere J.H. 2018 “Forecasts for Canada oil and gas production” May https://aspofrance.files.wordpress.com/2018/05/canada2018.pdf

-Laherrere J.H. 2018 “Forecasts for US oil and gas production” March https://aspofrance.files.wordpress.com/2018/03/lahall19march.pdf

My conclusion is simple: for North America in 2040 the forecasts of EIA or ExxonMobil should change the sign of exports for oil and natural gas: instead of export it would be import.


Viewing all 27 articles
Browse latest View live


Latest Images