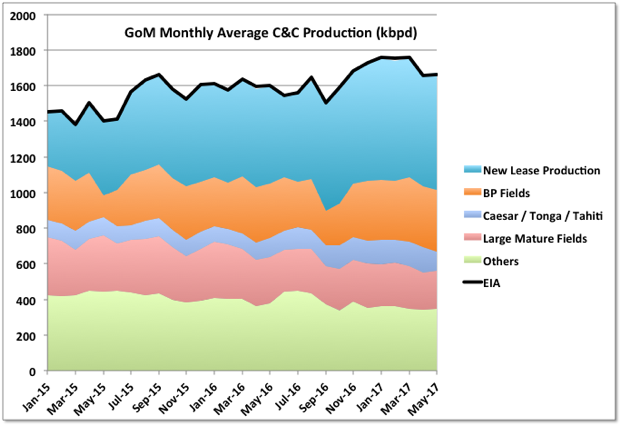
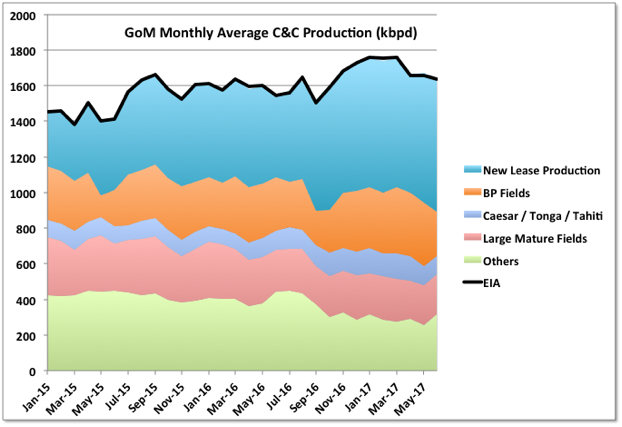
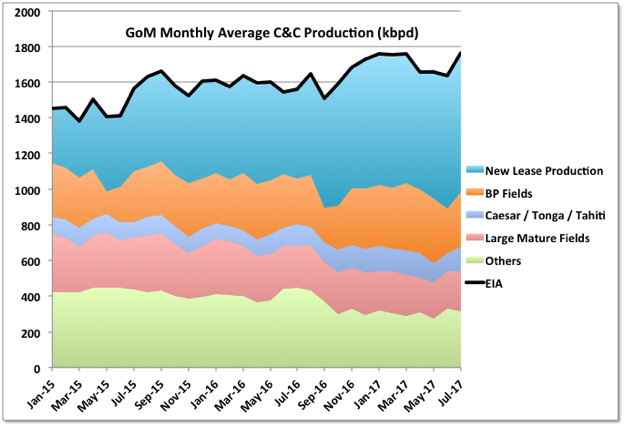
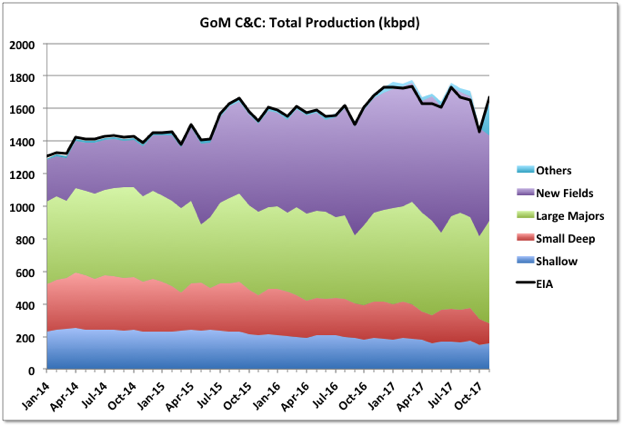
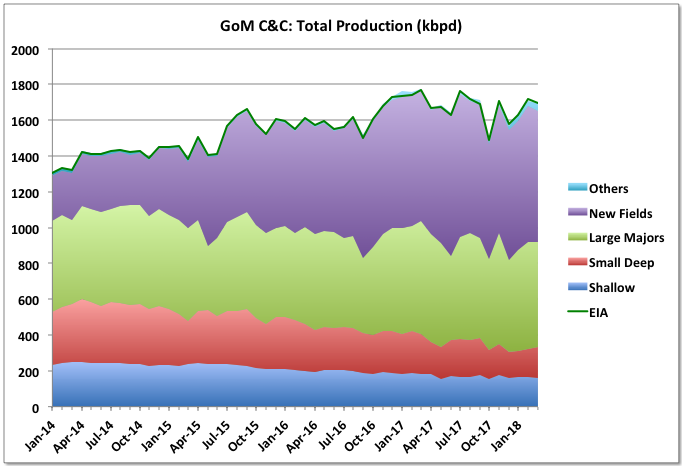
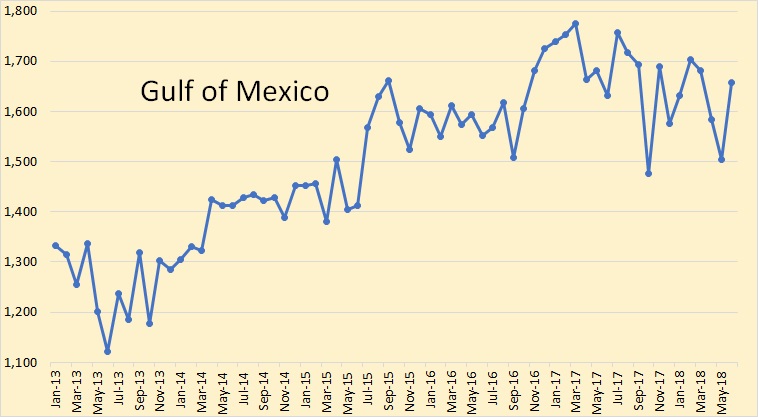
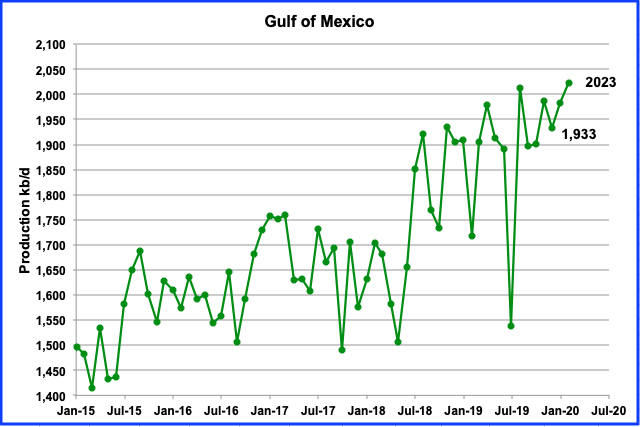
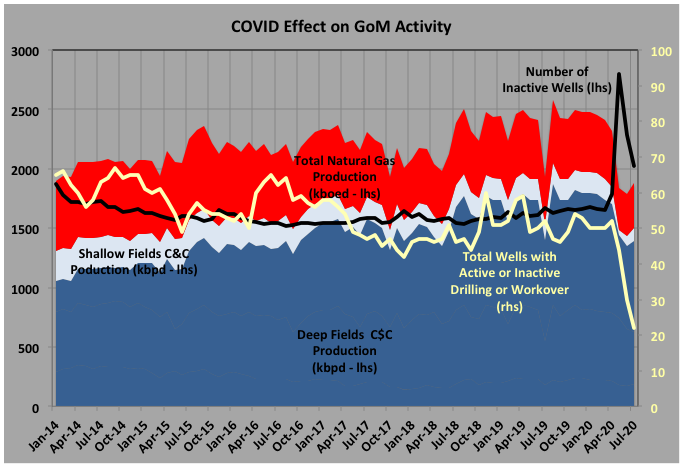
Production for May by BOEM was 1673 kbpd and by EIA 1661, compared with 1661 and 1658 kbpd, respectively in April.
March looks like the peak, at least near term, for the basin, especially with Hurricane Cindy impacting the coming June figures.
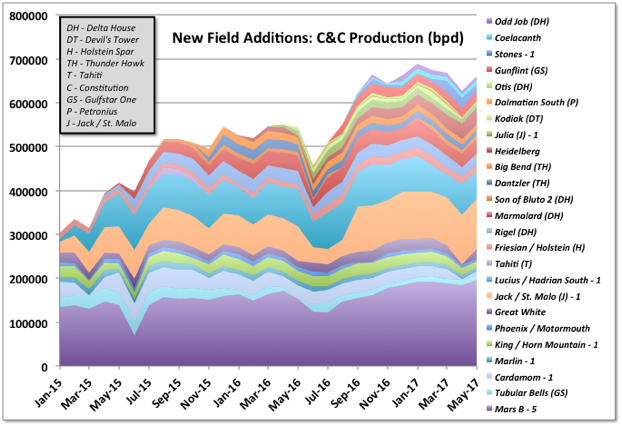
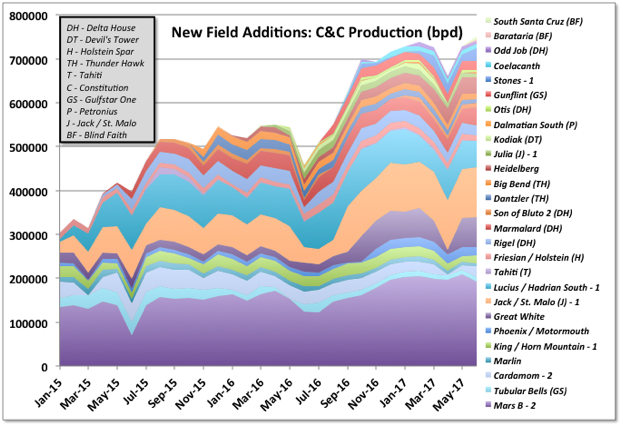
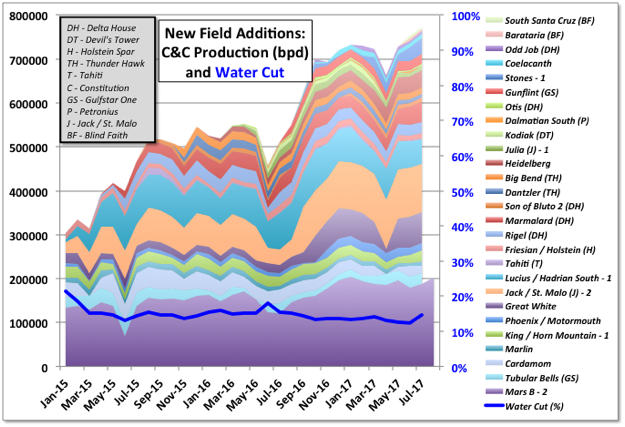
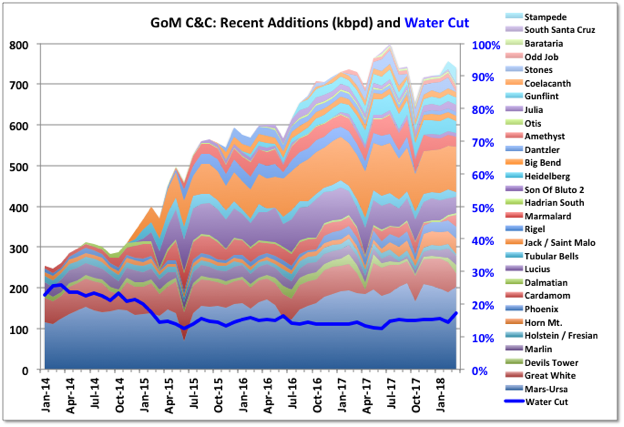
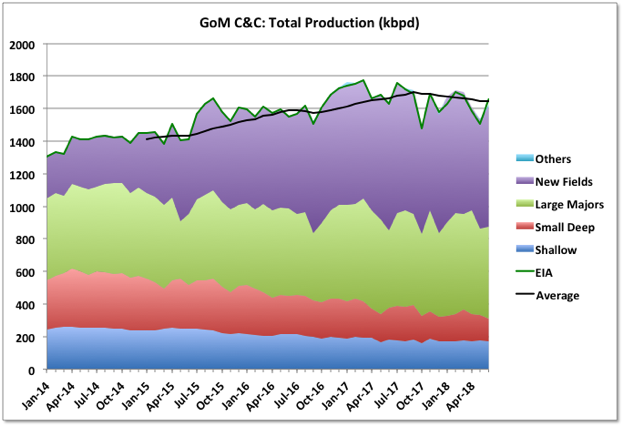
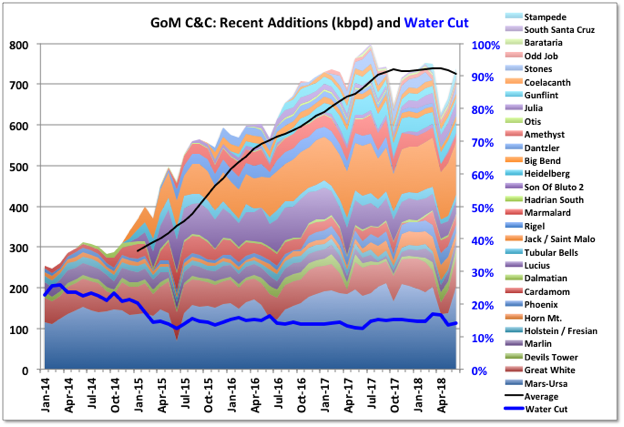
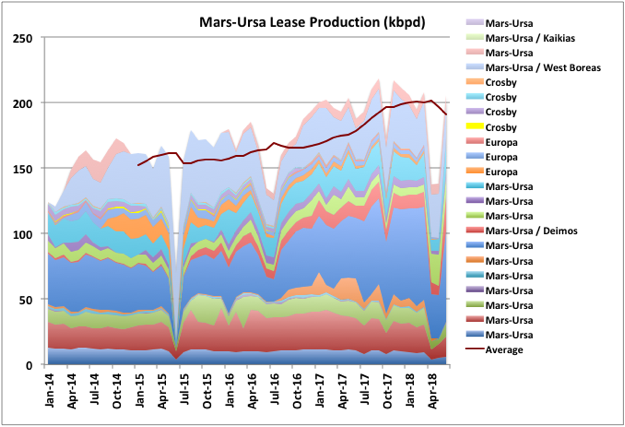
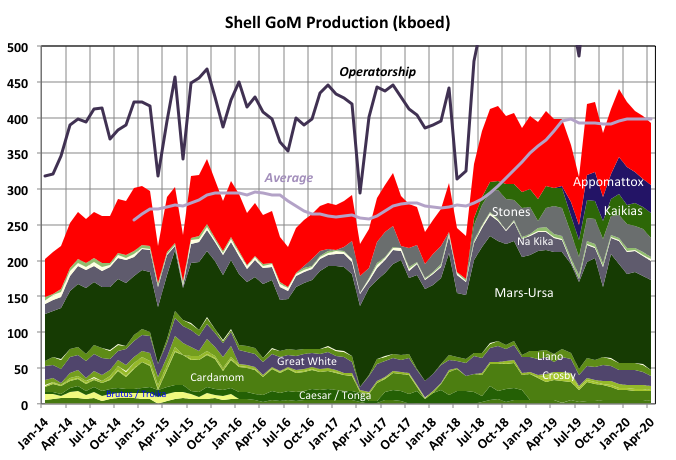
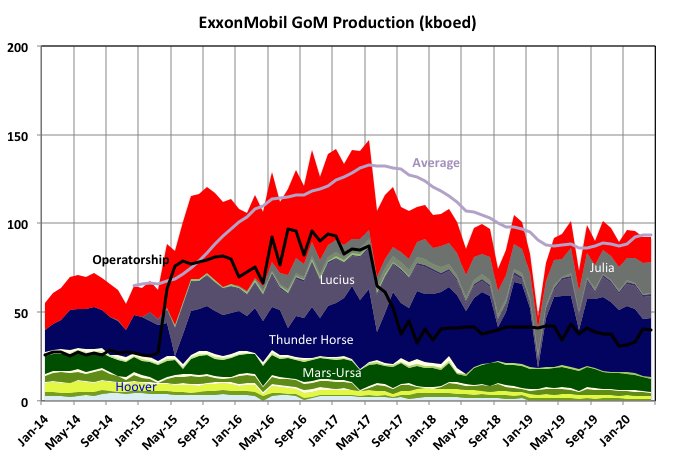
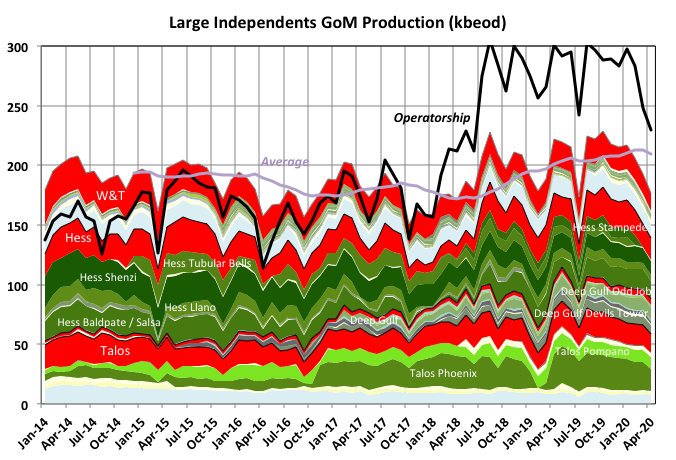
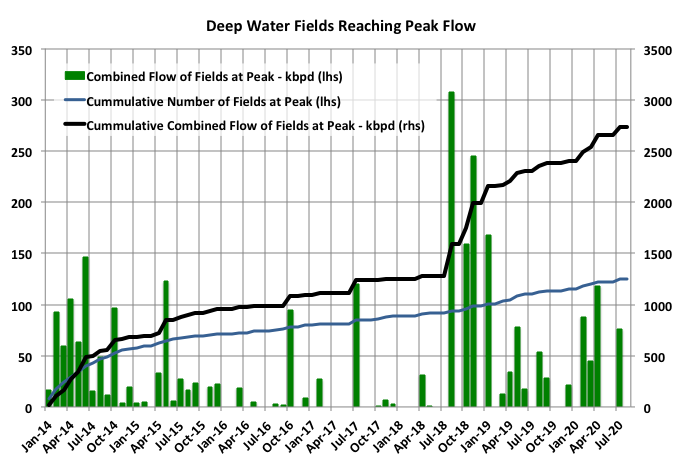
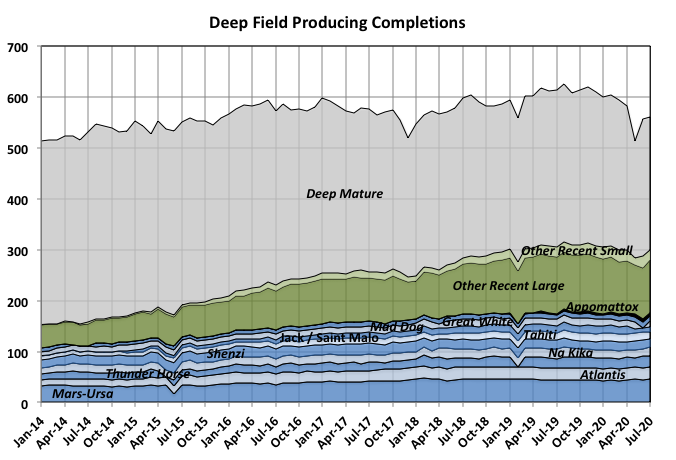
The combined new fields added from late 2014 look to be peaking as well. Great White came back on line but xxx and yyy declined. In previous data I had omitted one big producing lease in Mars, which included the new Deimos field. With this added the production growth through 2017 is higher (and as shown later the decline in mature fields faster) than previously shown. There may be more increase to come: the Mars leases had three rigs operating through June, one dedicated for Deimos, which has now gone. The two platforms on the field each have a dedicated platform rig, so they can continue with in-fill drilling and workovers as they wish. The Kaikias development will be tied into the Olympus TLP on the Mars field in 2019, but it’s a subsea tie-back so would need a separate drilling rig. The facility has nominal capacity of 100 kbpd, but that might be limited by the platform wells and manifolds rather than production trains – if not then Shell must be expecting some decline before Kaikias comes on line.
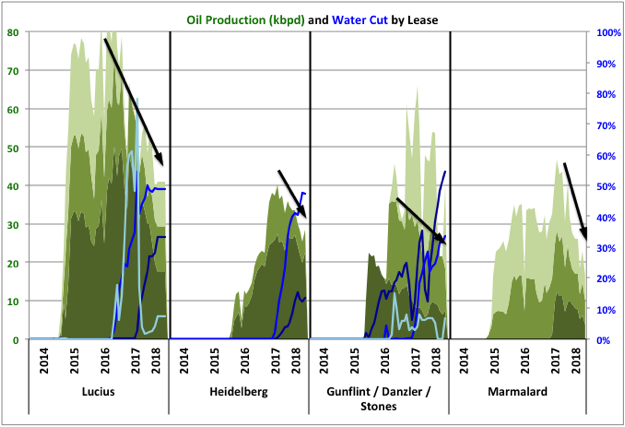
Stones start-up is still not looking good with an 8 kbpd fall – Shell are taking over the operation from SBM by buying the FPSO instead of leasing. Maybe this indicates poor operating performance (if so it’s something for ExxonMobil to be concerned with as they are following the same approach with SBM for Liza), or maybe just a convenient scapegoat. Julia, Cardamom, Stones, Jack and Lucius still have active drilling programs so may have opportunity for growth. Julia had plans for subsea multiphase pumping, I don’t know if that is operating or will be brought on as pressures fall.
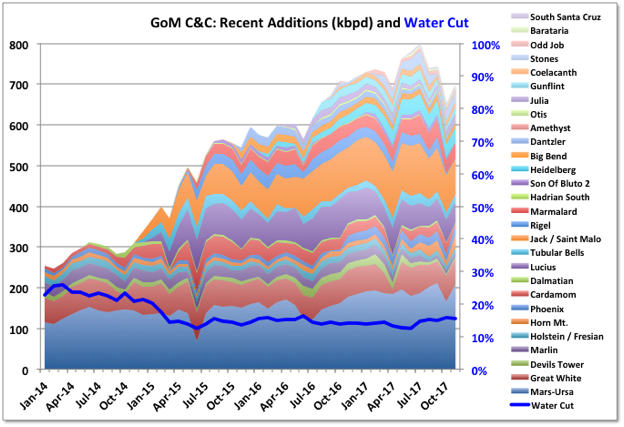
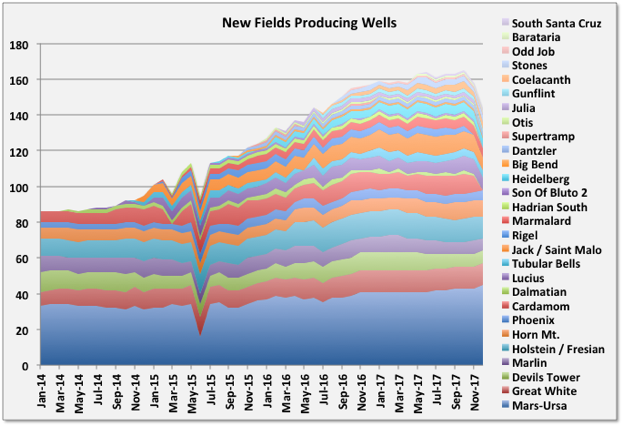
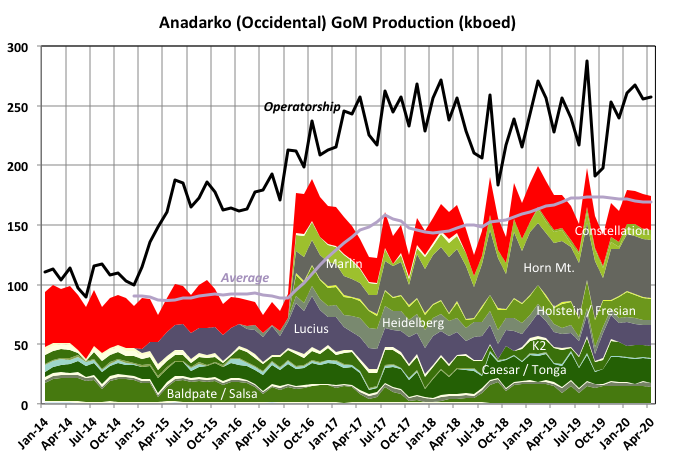
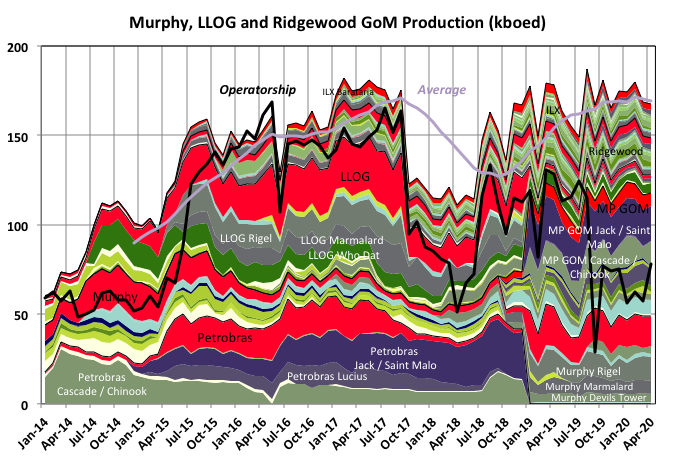
Production from the South Santa Cruz and Barataria fields started in mid June (actually part of Fourier and East Anstey fields by BOEM naming). The first Horn Mountain Deep well, for Anadarko, started production in April, a second well is due to be spudded this quarter. These are the only new fields announced for this year. Anadarko was the only company that had hinted they may develop something else (e.g. with Warrior and Phobos tie backs), but with them slashing budgets for 2017 after poor second quarter results that is now be unlikely: in their investor presentation they indicated they expected flat production out 3 to 5 years, and didn’t sound particularly confident of that to me, and with no mention of Shenandoah so that might be on the way to full cancellation. One new lease in the Marmalard field (the last there) for LLOG was started in late May.
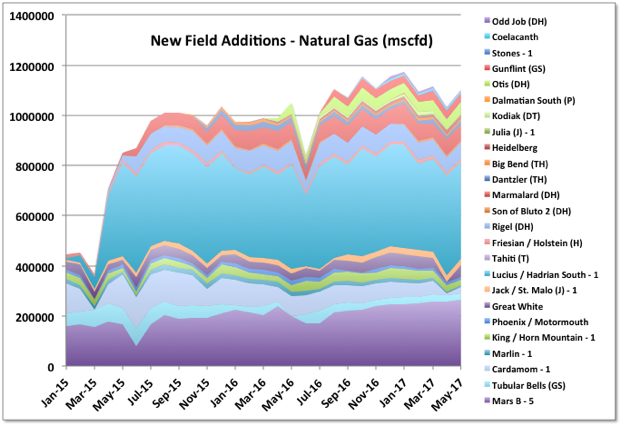
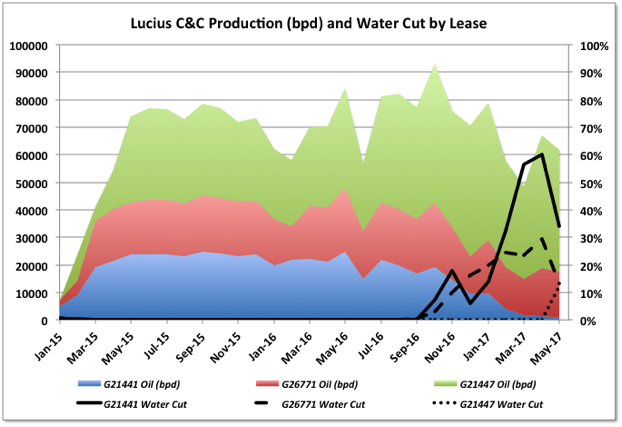
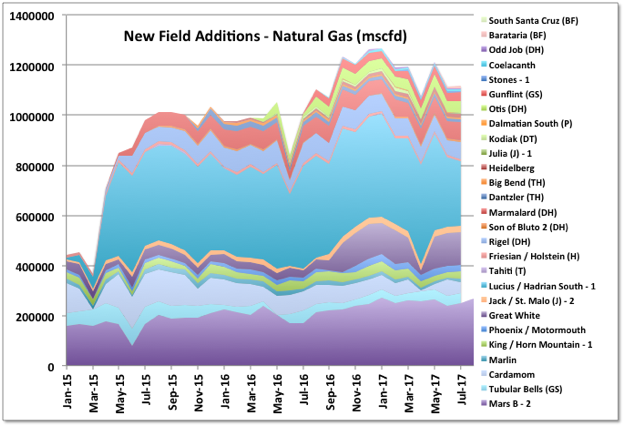
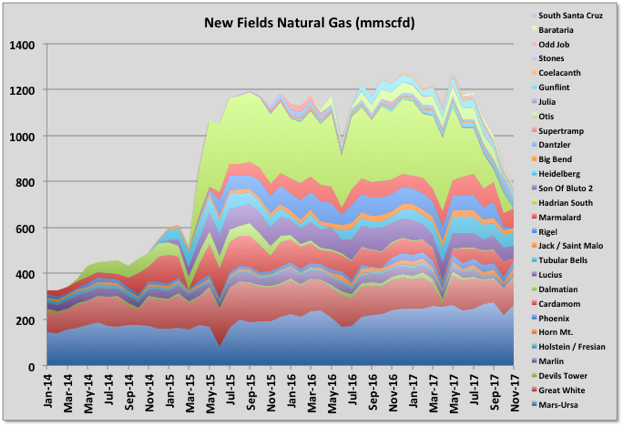
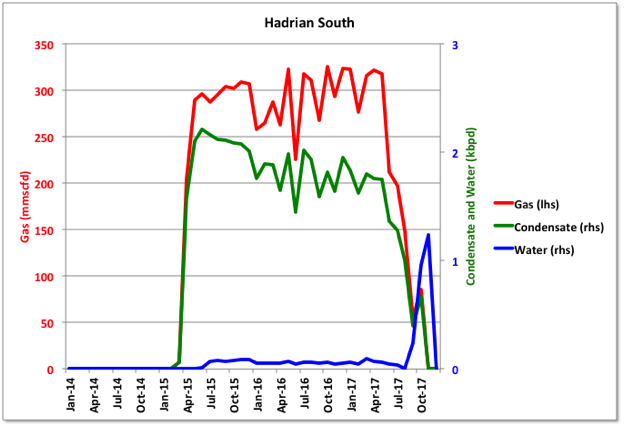
I’ve added natural gas production for the new fields here. Hadrian South and Otis are the only dedicated gas fields. Hadrian South production is a big proportion of the gas total from GoM now. It produces to the Lucius Spar, operated by Anadarko, and according to their investor presentation Hadrian South is supposed to finish by about 2021. I’m not sure if that can be correct, but if so it’s production should be declining significantly soon. Also on Lucius, it’s biggest producing lease, really part of Hadrian North field, started showing a sudden water cut increase in May, and dropped about 8% production (for some reason this does not show up in BOEMs list of qualified fields, but it is definitely tied in to Lucius). The first lease on the Lucius field has been killed in about two years with water break through; it’s not clear what their plans are for it (this is Anadarko as well).
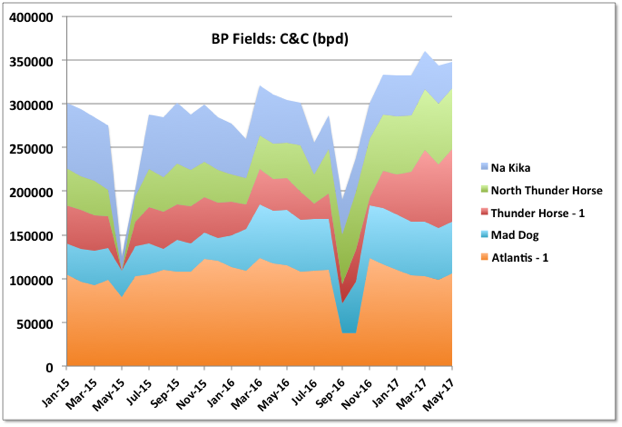
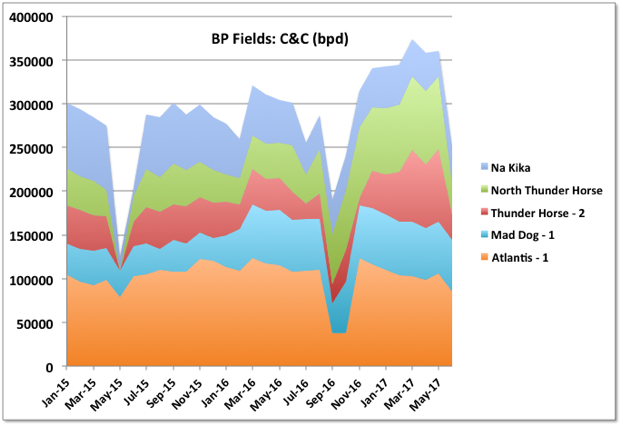
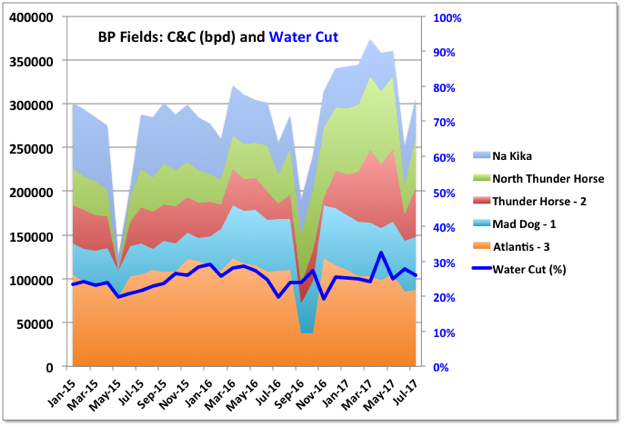
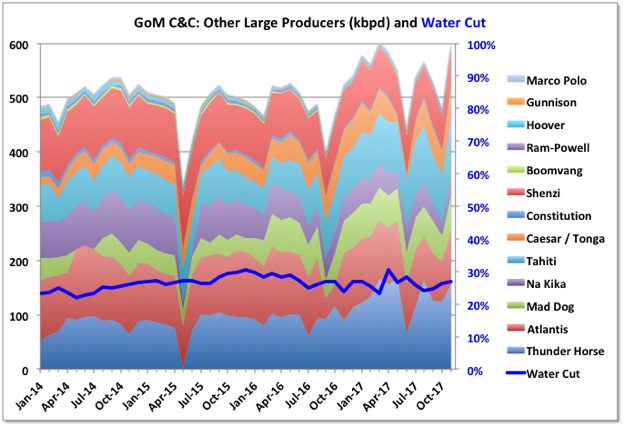
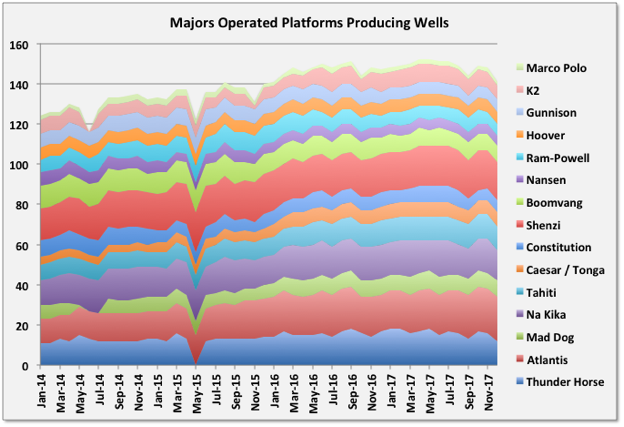
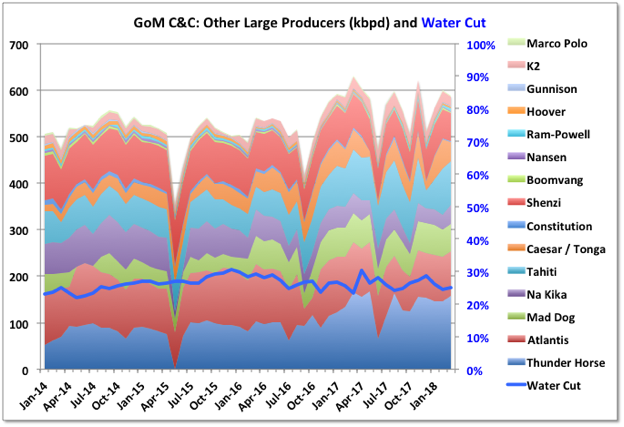
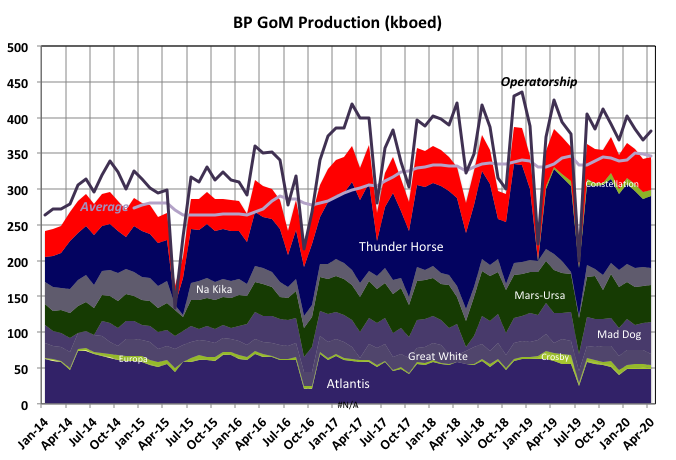
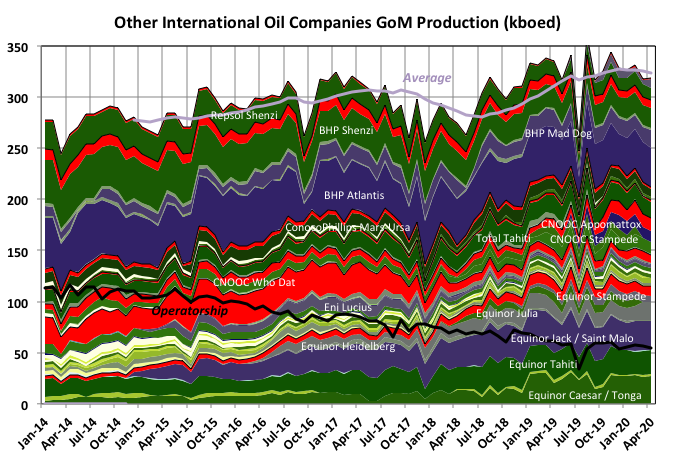
A couple of leases in Na Kika look like they have gone off line so production is down. Thunder Horse numbers were revised and now clearly show the impact from South Thunder Horse with about 35 kbpd increase. There have one rig still operating, but I think they will just maintain plateau now. Atlantis looks to be running about at nameplate capacity, so the coming North Atlantis development is likely only to be able to extend the plateau; there is one rig operating there now.
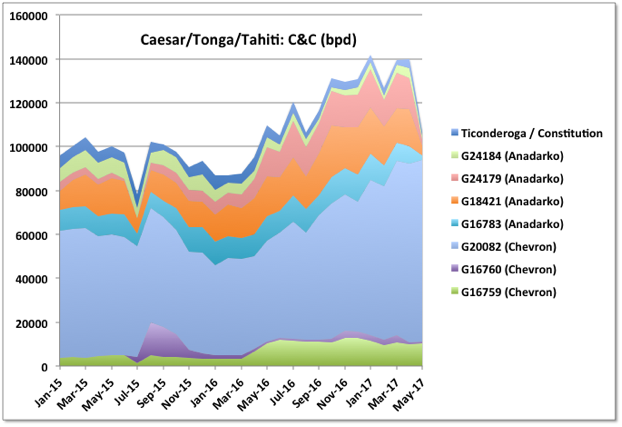
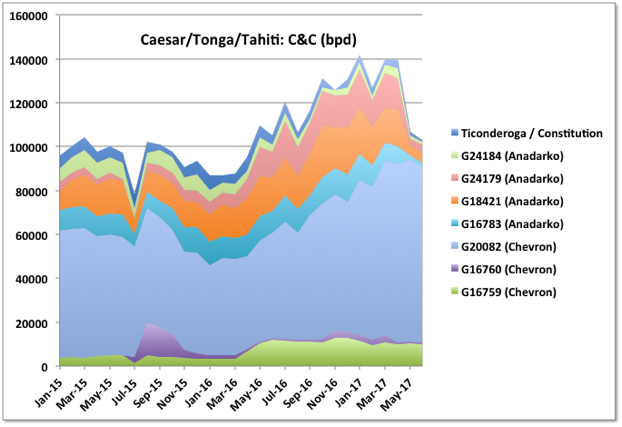
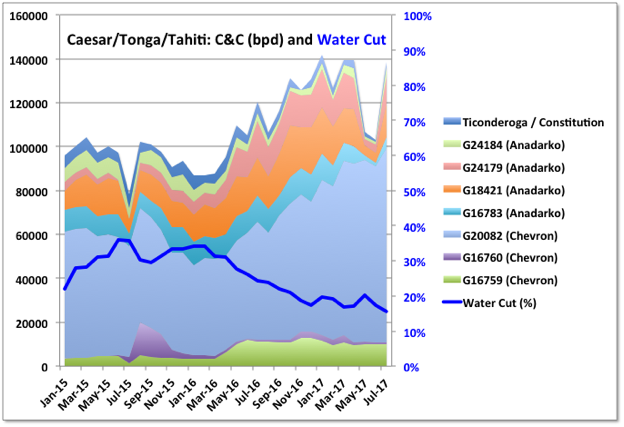
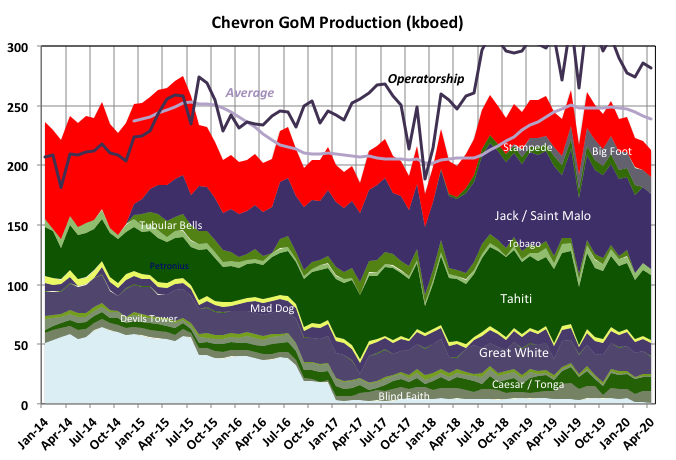
For the Caesar/Tonga/Tahiti fields the Anadarko facility (Constitution Spar) went off line taking off 40 kbpd production (Ticonderoga and Constitution fields go there too). The turn around was for 42 days so will reduce June figures too. The Constellation field is to be tied into the spar next year, the spar has nominal nameplate of 70 kbpd so another 25 or so (average) might be added to overall output.
For the Chevron fields in these leases it looks like production is limited by the gas handling capacity on Tahiti platform, at 70 mmscfd, which is pretty low given it’s oil capacity of 125 kbpd.
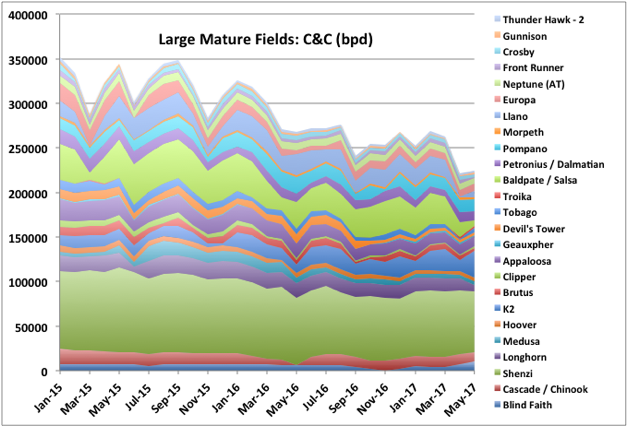
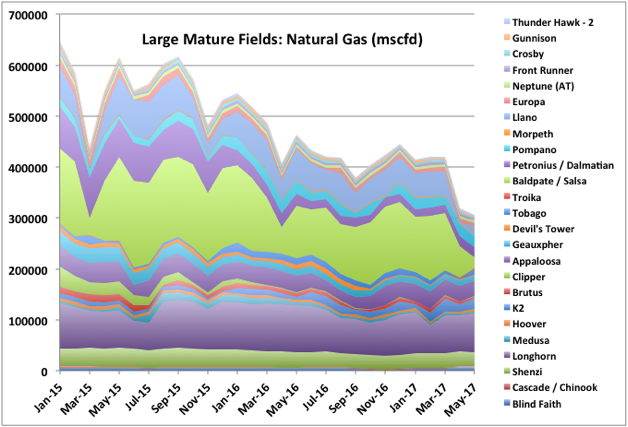
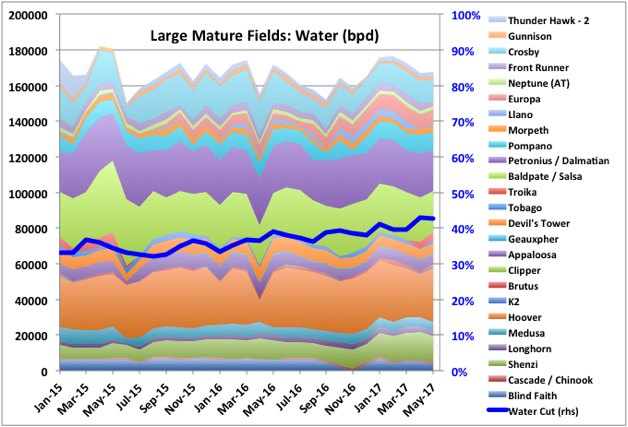
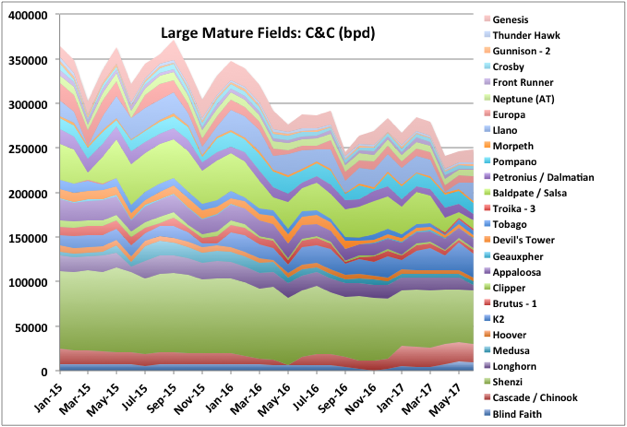
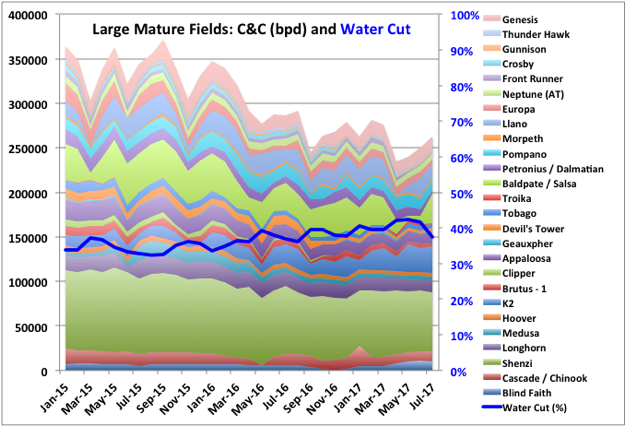
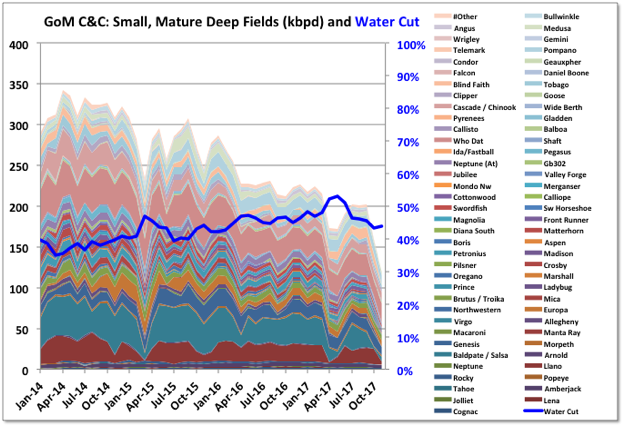
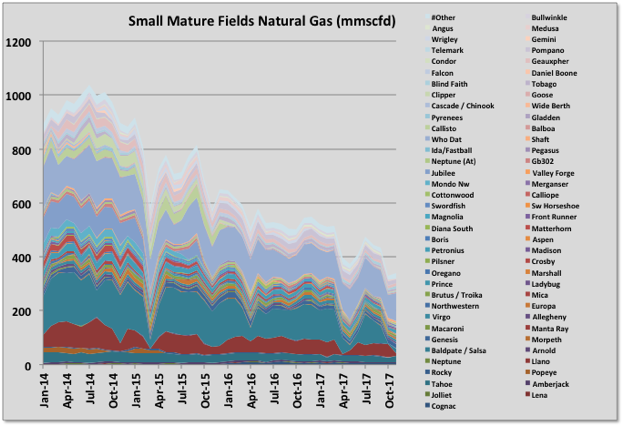
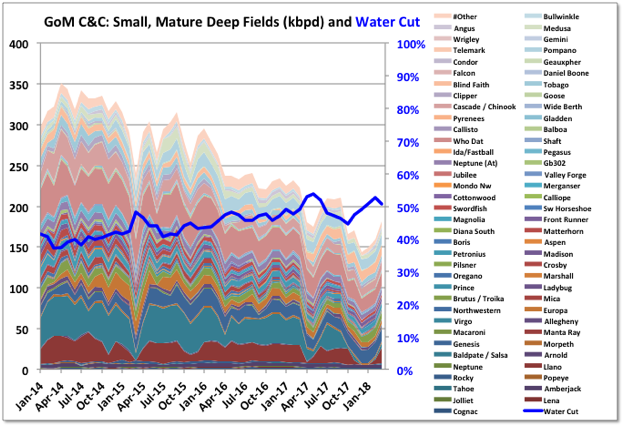
After a bit of a plateau from some brownfield work and new tie backs the decline in the larger mature fields looks like starting up again; the drop in gas is particularly noticeable, but is mostly due to Baldpate turn around. Overall water cut looks like it might be rising as well. Thunder Hawk has two new rigs operating, but I haven’t seen any announcement for new developments there. The smaller mature fields (not included in the charts) seem to be holding up quite well, I will try to get some individual lease data for these next month.
For the GoM activity report from the last week in July, there were 28 rigs drilling, twelve running tools and two in plug and abandon operation. I think the report can mean there is dual activity on a single well (e.g. wire line and drilling). Two rigs are predrilling on Stampede, one on Appomattox and one on Mad Dog II. For the newer fields there is development drilling on Lucius, Cardamom, Mars (two rigs), Stones, Julia, Jack / St. Malo, plus new wells for recently added or due production on Horn Mountain Deep and South Santa Cruz/Barataria. Atlantis also has a new rig, which may be for development of the Atlantis North discovery – it’s noticeable how any reasonable discovery is immediately fast tracked, the North Sea is similar. The Dorado field (operator Anadarko, discovery in 2014) is also being drilled; I think it is one of the last of wells for small fields (King, Dorado, Holstien Deep) being tied back to Marlin, there’s probably one more for King and a couple of others possible. Only Phobos has appraisal drilling.
Five rigs are drilling on unnamed fields, so presumably exploration – four of these are in Green Canyon, which means they are near field, and probably smaller, prospects; the other one is for Shell, in Walker Ridge, and probably a frontier wildcat. With all the predrilling on new fields, most new fields reaching plateau or decline periods, and few exploration wells (and fewer still in frontier regions) it seems likely that the drilling numbers will tend to decline over the next few years as unused well slots and tie back locations on the facilities are exhausted, even with an increase in oil price.
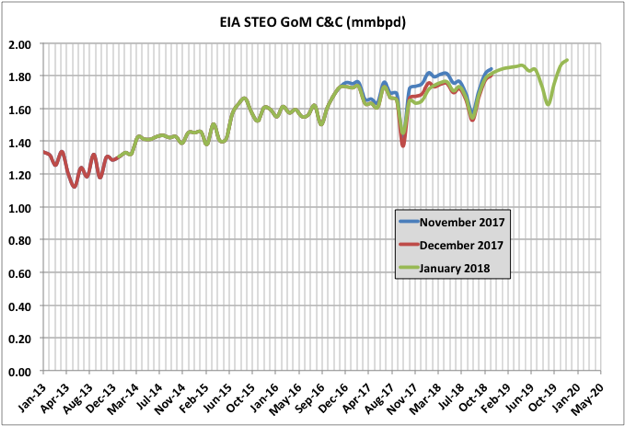
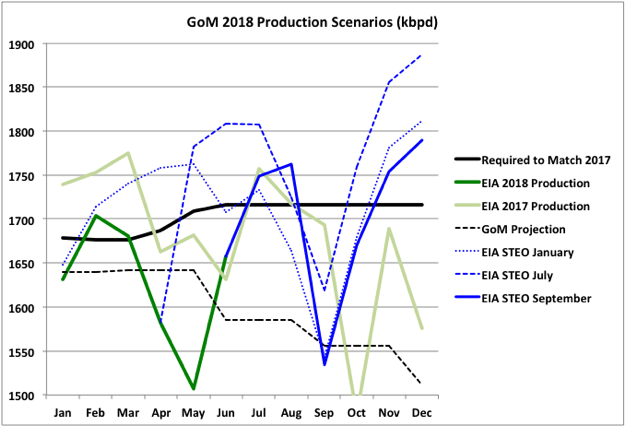
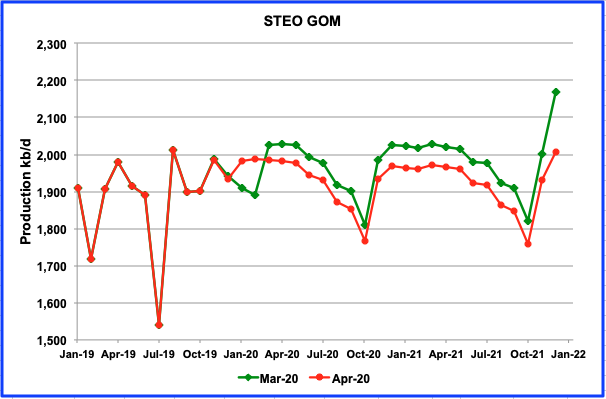
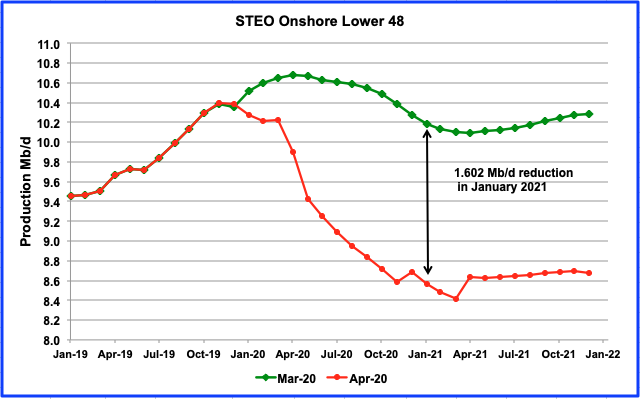
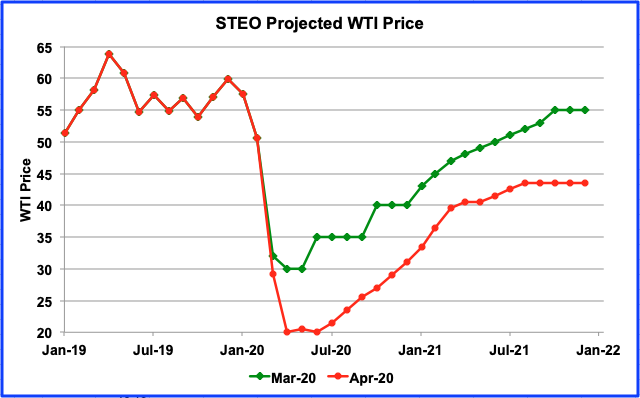
In the past few months as production rose the EIA STEO showed a new production forecast which had the same shape but was just raised to start on the new production number. They didn’t do the reverse as the production fell but instead kept the June STEO forecast with a single dip down for April. The August STEO, showing May data, is due next week.
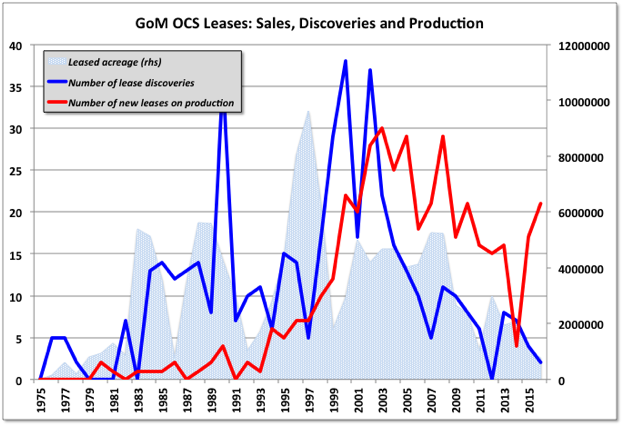
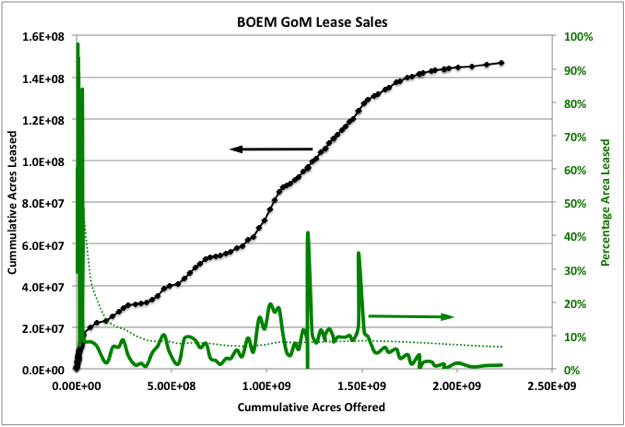
GoM Lease Sales
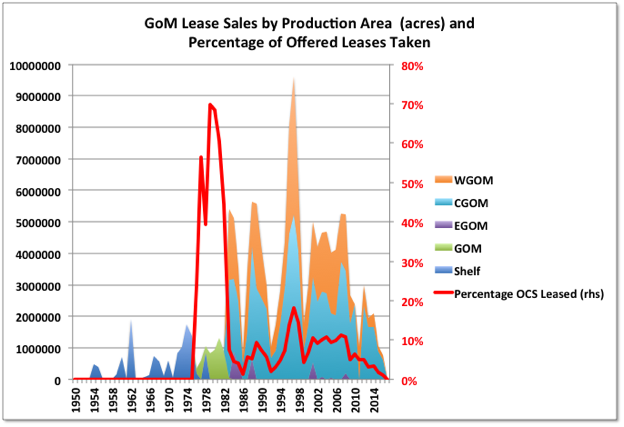
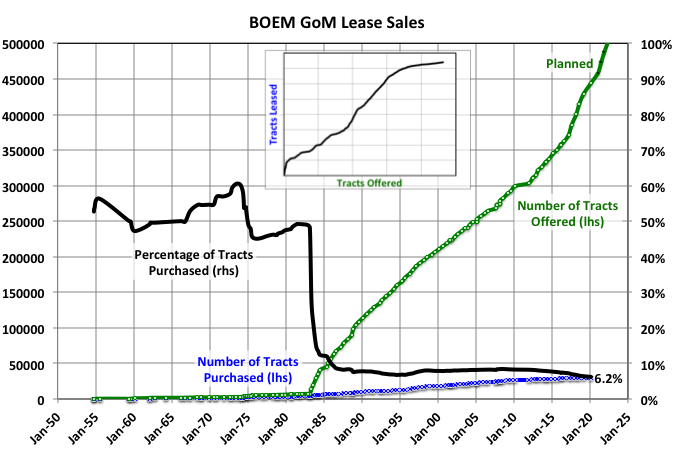
As further support that the current decline in exploration is not just a function of price, the chart below shows the acreage of GoM leases that have been successfully auctioned, plus the percentage of offerings that were taken up (charts are stacked according to BOEM designated production areas to the give total). The numbers before about 1976 are listed against states (FL, LA, TX) and I think are inshore shallow leases, although it might be they just changed naming convention. After about 1990 areas were split from just GOM to east, central and west. The percentage bought calculation only considers the area auctioned after 1990. It is marked how the amount bought and the percentage bought both peaked and rapidly dropped off, even in the high price years through to 2014. However there were obvious impacts from earlier price collapses in the late nineties and 2008.
It’s possible to read too much into these charts but generally it looks like, on average, discoveries follow three or four years behind the lease sales and production about the same length after that. But the recent production rise isn’t in that pattern – maybe disrupted by the 2008 recession and 2010 drilling hiatus, or maybe the high oil prices after 2011 allowed some difficult and expensive long term discoveries to become commercial.
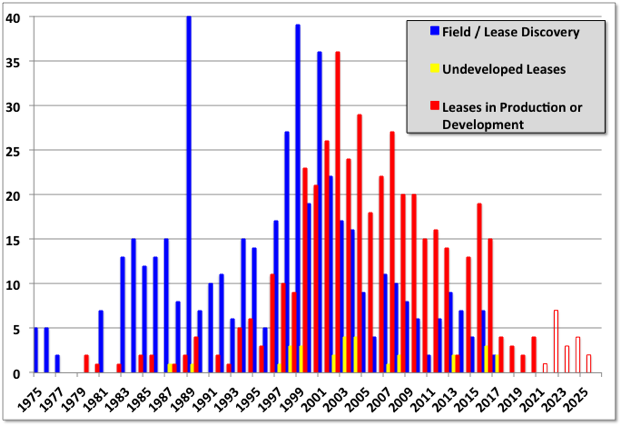
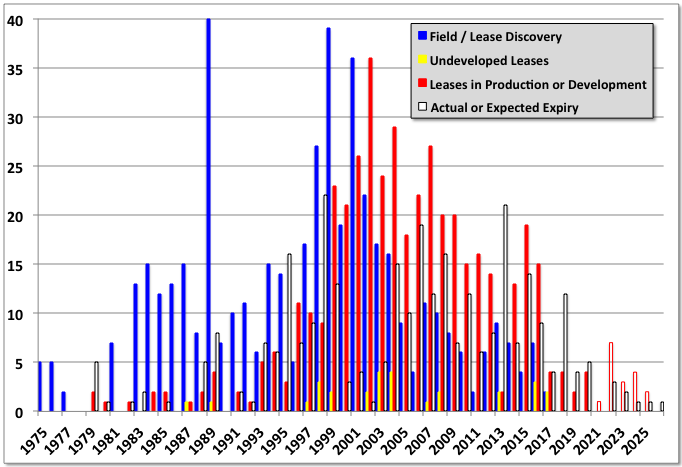
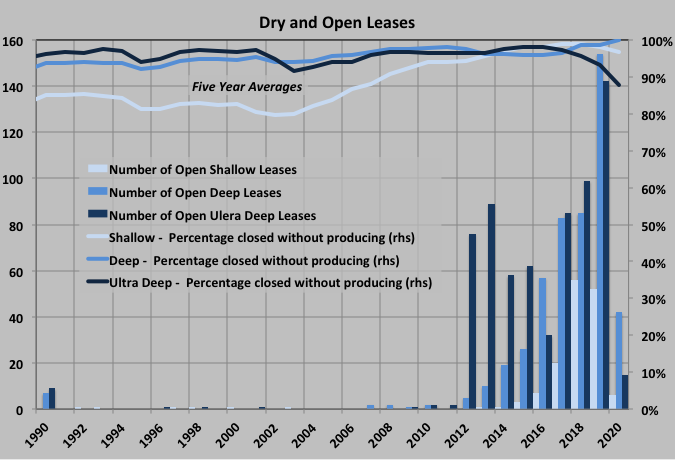
The number of open, undeveloped leases is relatively few, and declining. The chart below shows the number of leases discovered (and not terminated without development), producing or in development, and those still undeveloped. The open bars show my guesses for some larger fields that seem likely to be approved soon (e.g. Vito, Anchor). Most of the undeveloped leases (in yellow) are associated with existing, fairly recent, fields on production (e.g. St. Malo, Tubular Bells( and are likely to be poorer wells, waiting on surface facility capacity to become available before being tied in. There are two new field discoveries this year: Mormont and Khaleesi, by LLOG in Green Canyon (they have switched from Animal House to Game of Thrones naming convention) and are likely to be smaller reserves similar to their Delta House developments.
There is one area that might be expanding: deep shelf pre-salt. These are deep or ultra-deep wells but in shallow water (this is a rare combination and hence one problem is that there aren’t many rigs – jack-ups – that are suitable). W&T brought on Mahogany field this year, in an already producing lease (one well at 5000 boed with up to three others due, although the production data suggests it wasn’t as great as expected) and there may be more to come. The production is high pressure and high temperature, and in places can be too high for the available technology or commercial development, and mostly gas prone.
Production for June by BOEM was 1631 kbpd and by EIA 1636, compared with 1673 and 1659 kbpd, respectively, in May. The decline was mostly from Thunder Horse going offline and Constitution staying offline. Hurricane Cindy didn’t seem to have much of an impact, things will be different for the impact of Harvey on August figures.
Even with the two offline facilities coming back July numbers will struggle to beat those for March, and after that the depletion declines and hurricane disruptions take over. Note that the “others” area includes any assumptions BOEM has made to allow for missing data, which is quite a lot this month.
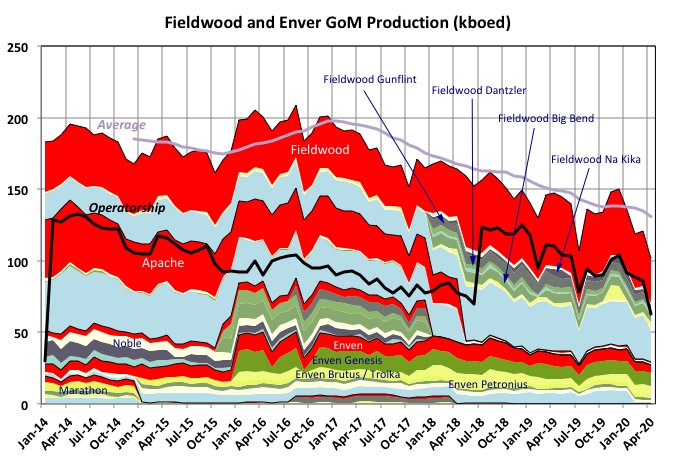
The combined new fields added from late 2014 are holding a plateau with South Santa Cruz and Barataria fields added and a new lease for Marmalard starting (adding about 20 kbpd combined). Stones also had a better month and achieved 70% of nameplate capacity. It’s interesting that five leases have come on line and then have effectively been killed off in this thirty month period: Amethyst (a small gas field that died after sputtering along for about six months, and not shown as the flow was so small), one lease in Lucius, Kodiak, one lease in Caesar/Tonga/Tahiti, and one in Rigel. Dalmatian South production fell immediately after start-up and was offline for a couple of months but came back in June (there are plans for subsea pumping to be installed but I don’t now the present status).
The big drops have been for BP, with Thunder Horse off line for part of June, and for Anadarko with the Constitution shut down extending into a second month (I think a bit longer than was planned).
Mature deepwater fields continue a general decline. Note for all fields there is some missing data for June and even in May – I have assumed production remains constant from the previous given month’s numbers in each case. For some reason Hess’s Tubular Bells has no reported figures for eight months now.
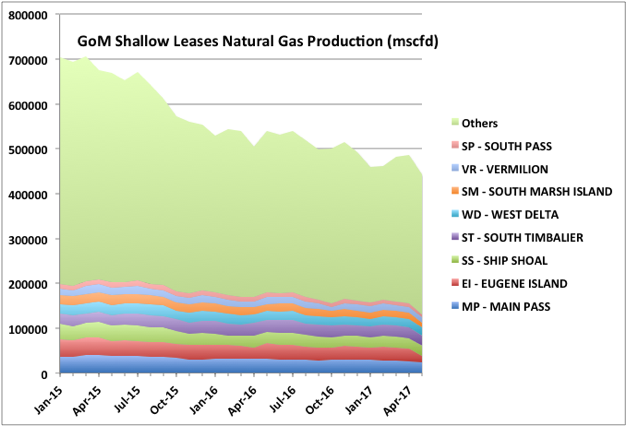
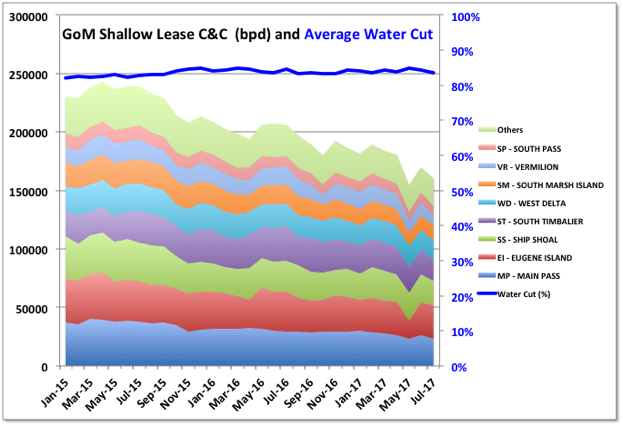
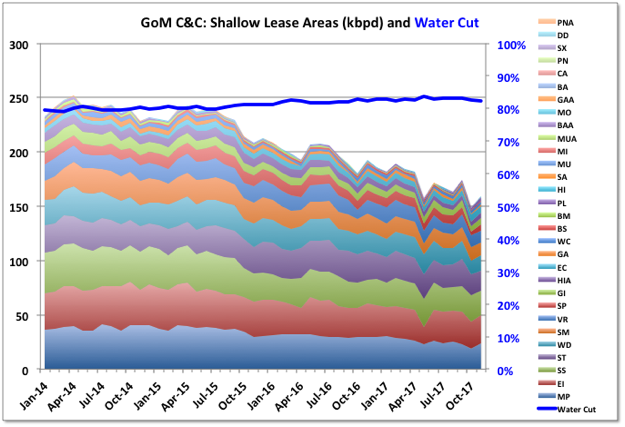
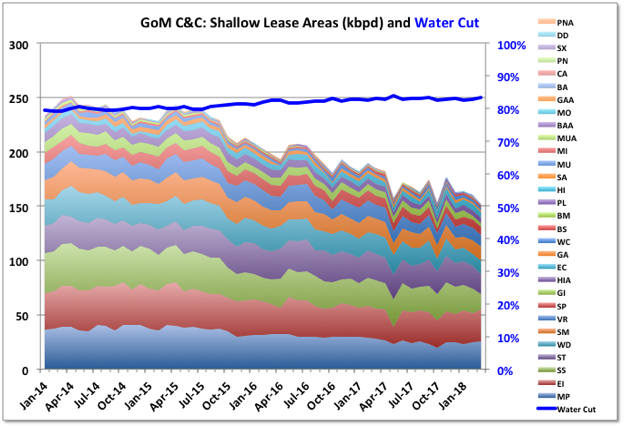
Shallow Fields
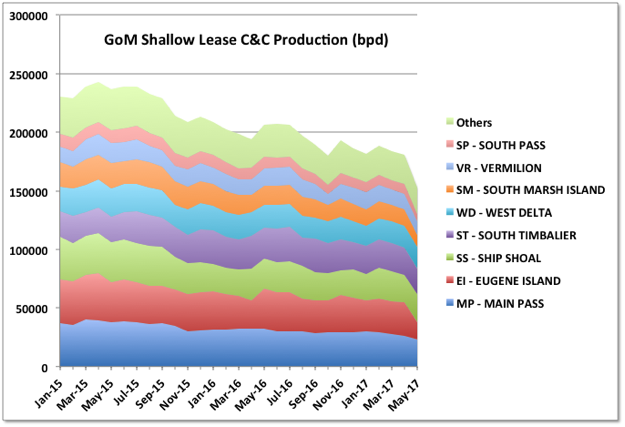
The shallow fields in the GoM are in steady decline for both oil and gas, but different leases are more oil and gas prone.
Production Breakdown
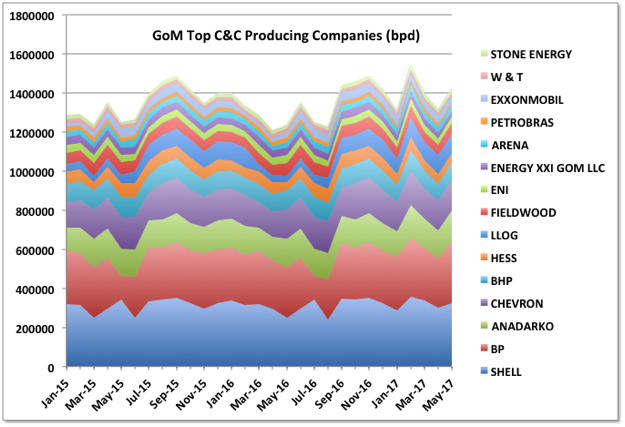
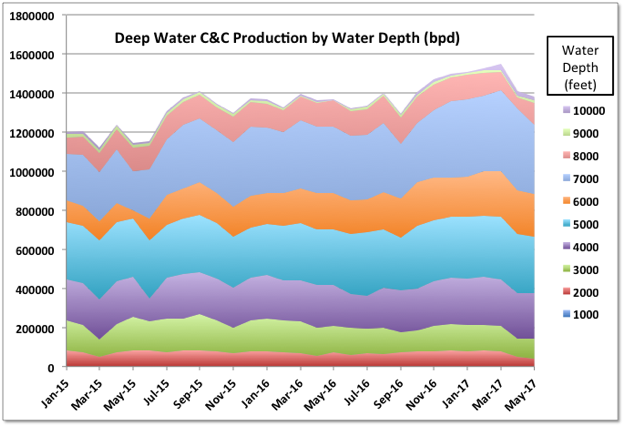
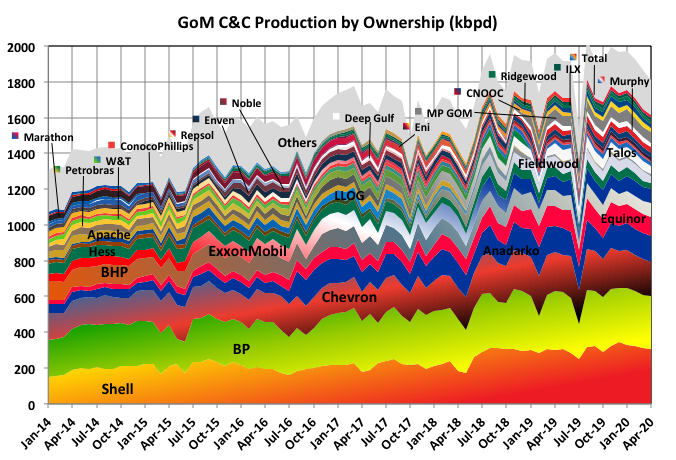
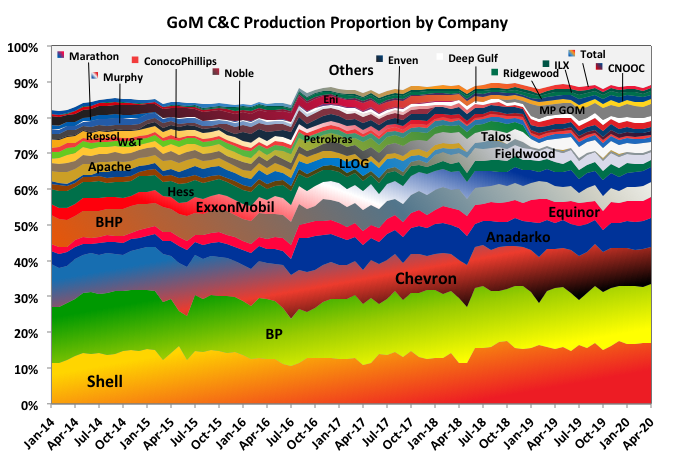
These charts show breakdown of production by company – most oil comes from four companies: Shell, BP, Chevron (including Union Oil) and Anadarko (their historical numbers include those for Freeport McMoRan, which they bought last year) – and by depth, which doesn’t tell me much, except maybe that ultra-deep hasn’t delivered as much as was once expected. Note these charts only go to May as June has a lot of missing data for the shallow leases (and some for May too I think, but it all comes from well numbers and there are too many to check).
Lease Expiry
BOEM provide data of when undeveloped leases have expired or will expire. There has been only one so far this year (Kaskida). However there are a lot due over the next few years, as shown below. Presumably they can be extended, though at some cost, but this may indicate a lot of development decisions (for both greenfield and browfield work) need to be made in the coming couple of years. Some of the big ones due this year are Shenandoah, North Platte and Yucatan; next year and 2019 there are a couple each in Rigel and La Femme, plus Anchor, Leon, Gibson and Samurai, and overall another six or so associated with older producing fields (i.e. that would require tie-backs or outreach drilling).
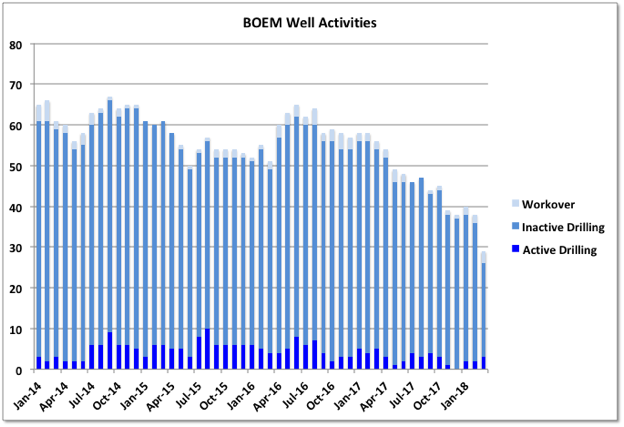
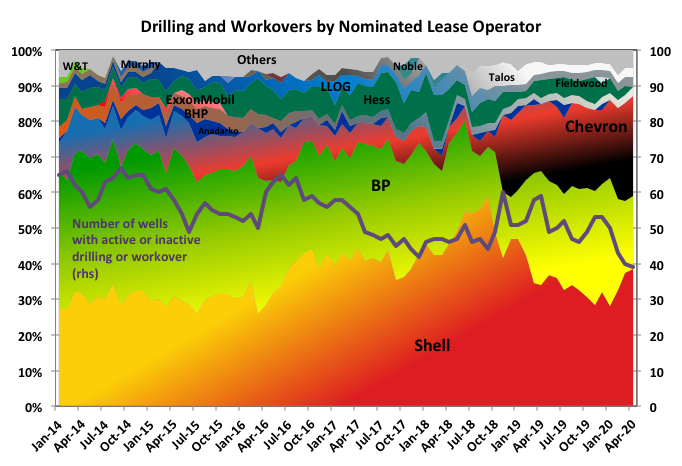
Drilling and Workovers
There are thirty rigs listed with drilling operations in the BOEM deepwater activity for 29th August, plus sixteen workover operations (in any of the charts if there is a number after a name it shows the number of well operations listed against that field). Six rigs have no field listed so are presumably wildcats. There don’t seem to be any appraisal wells in progress. Also any impacts from Hurricane Harvey aren’t apparent (the rigs that were abandoned were mostly jack-ups in shallow water so wouldn’t be included).
Off Topic Finish
This is a house designed by Frank Lloyd Wright for Marilyn Monroe and Arthur Miller but never built. It’s computer generated from his original design drawings, although the second floor private quarters are missing. At the site below you can take a walk though the rendering. Miller didn’t like it and they couldn’t afford it.
I don’t know much about architecture, and I’m not sure if I even know what I like, but Frank Lloyd Wright’s work is unique, he was not much of a fan of right angles. A lot of his designs never got built (as with many architects I expect), but like this many have been rendered in graphics packages, often as an example of their capabilities. He designed a civic centre and transit building for LA, which looks a bit like the Tyrell building from Blade Runner (which, amazingly, was set in 2019 – that seemed a long way away when the film first came out), though I don’t know if it was the model for it.
GoM C&C production for July by BOEM was 1746 kbpd and by EIA 1761, compared with, respectively, 1631 and 1634 kbpd (corrected) in June. The EIA number is a new peak, the BOEM one is still 24 kbpd short of their March numbers. The growth was from Thunder Horse (partially), Constitution and Baldpate/Salsa (which is mostly gas) coming back on-line, plus continued ramp-up in Stones and Marmalard.
C&C Production Details
For new fields added since late 2014, data for Tubular Bell’s, which has not been available since late 2016, has been updated and shows a growth of about 14 kbpd in that period, hence there is now a slight continuing rise shown in new lease production over the past six months, rather than the previous plateau; Tubular Bells looks like it is now on plateau, about 40% below it’s nameplate, and there is no current drilling.
Dalmatian North (online in March 2014) and Dalmatian South (online in December 2015) are small oil fields, which are not performing very well and might well go off line soon. At the moment it looks like their production is cycled every three or four months. Subsea pumping is due to be installed for them in late 2018.
Heidelberg and Marmalard look to be about at their expected rate (Heidelberg is only about 50% of facility nameplate but I think more would have to come from additional tie-backs and I don’t see any drilling for that at the moment). Julia is the one reasonably sized recent addition that is still below nameplate and has current drilling, so could add another 15 kbpd, but with rapid decline in the first year based on the first well (it has subsea pumping installed but I don’t know how much that improves things). Stones is just about at expected capacity after what looks like quite a difficult start-up over about twelve months, but sometimes facilities can achieve higher rates early on, though I don’t know how long the approval process takes in the GoM to go higher.
The water cut on the new fields looks like it’s starting to creep up, a possible sign that the production is plateauing. Of all the new leases started since 2015 only one in Tubular Bells and three in Great White have pressure support from water injection wells (though Jack has provision to add it later). I think the other leases mostly rely on pressure depletion, with some partial aquifer drive or compaction drive support, which means that unless they are limited by surface facilities and have to be choked backed, and I don’t think many are as the facilities are generally operating below nameplate capacity, they will continuously decline unless new production wells are added. There are some older leases within the fields shown also with water injection, for Holstein, Mars-Ursa and King, but overall most of the production shown is likely now to start to show increasing decline rates as development drilling winds down, and as is already evident in a lot of the smaller fields.
Thunder Horse was back online for most of July following a prolonged turnaround. There is still drilling there so there may be some more production to come from South Thunder Horse. Atlantis also has a lot of activity, possibly for North Atlantis start-up next year.
The Constitution Spar also came back on-line after a long turn around. I’m not sure if there is any more to some in the Chevron leases produced through Tahiti, but there has been significant growth there over the past year (it was started in 2009 and a more typical production facility would be coming of plateau about now).
The deep mature fields continue a general decline at 15 to 20% y-o-y. The water cut has declined a bit, possibly as some of the older wells water out and are shut in.
The shallow wells show steady decline, note however that there is missing data for July, and probably a bit in June.
Hurricanes and Other Unplanned Outages
Thunder Horse was shut down and fully evacuated following a power failure mid September. That is a pretty major upset and shouldn’t happen (it would, in theory, require at least two independent failures), and would take a few days to find and correct the problem and get permission to restart. I wouldn’t be surprised if it was related to previous evacuations for hurricanes. Thunder Horse produces about 180 kbpd.
The estimates for hurricane related lost production were 84 kbpd (average over the month) for August and 60 kbpd for September – the Thunder Horse electrical outage might add another 20 kbpd to that. There may be some natural decline to add as well. On the other hand Thunder Horse was not at full capacity in the July figures, so could add another 40 kbpd when it finally gets there.
For natural decline rates the mature deep-water fields are dropping just under 80 kbpd per year and shallow fields about 40 kbpd per year, so maybe 10 kbpd per month overall. The new fields and the BP and Tahiti related fields also have natural decline on many of their wells but it is being covered by ramp-up of new fields and in-fill development wells. However both those sources are starting to ease off so the overall decline rate will start to climb, eventually to as high as 20 to 25% based on R/P numbers.
Overall then, there is likely to be a slight decline seen in the next couple of reports for August and September, but not as dramatic as the hurricane news might have suggested. However the impact from Nate in October, plus a bit from the shut-ins on Delta House following the subsea pipe failure and subsequent leak, will be more significant, around 300 kbpd on average, and with some knock-on impact into November and later because of the drilling rig outages and depending on how much of, and for how long Delta House production is lost. I will probably not put together another update until the November figures come out as it will be difficult to tell what is happening on individual fields given the various shutdown and restart disruptions, but it will be interesting to see what EIA do with their STEO predictions.
Natural Gas Production
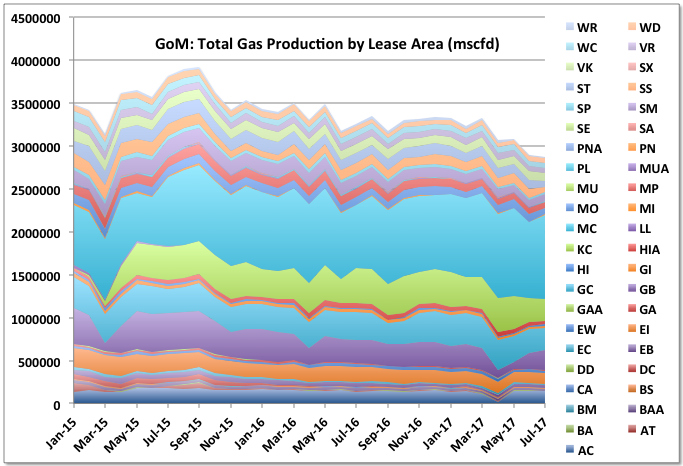
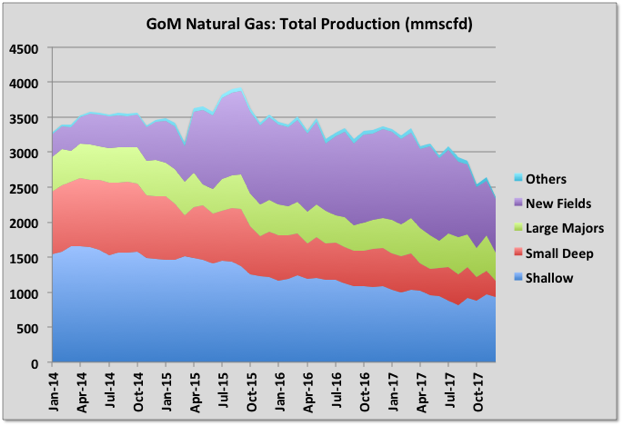
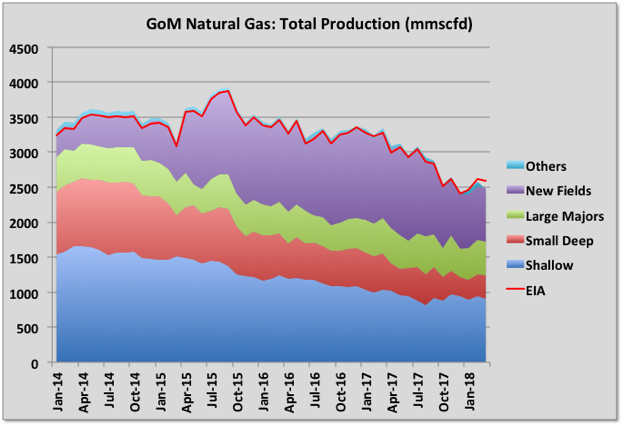
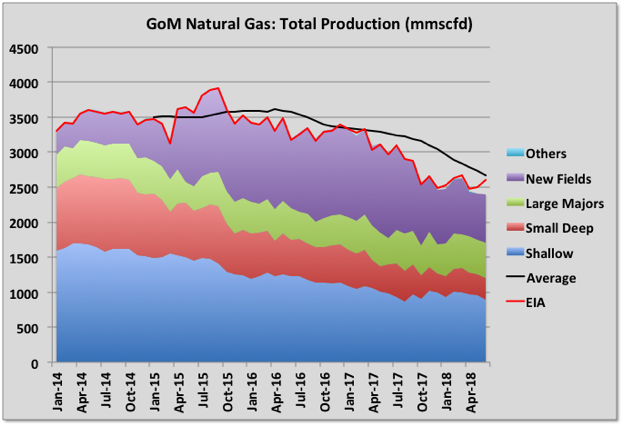
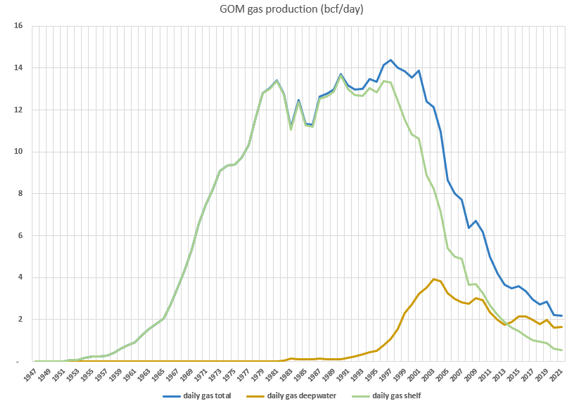
Most gas production is associated gas and is in slow decline from a local peak in 2015 (note this was about 80% lower than the main peak in the 90’s when there were still large gas fields in operation). Most gas comes from the main deep water areas: GB – Garden Banks, GC – Green Canyon, MC – Mississippi Canyon, and KC – Keathley Canyon. The thin lines on the top of the chart are mostly shallow lease areas and are in steep decline at over 20% y-o-y. As oil decline picks up so will the overall gas decline.
The new fields gas production is now showing clear signs of decline, mainly coming from Hadrian South (the only recent, largish natural gas field that’s come on line, but with R/P of only a couple of years based on remaining reserves from January 2016 at nameplate capacity, so bound to decline fast at some time).
Recent Drilling and Leasing Activity
By the BSEE report for the last week of September there were 41 GoM well related activities in progress. Only two unnamed wells, indicating wildcats or appraisal, were being drilled: one, by BHP is Scimitar in GC 392 (which follows an announced oil show in Wilding-2 in a nearby block – Wilding-1 had a mechanical failure and had to be re-drilled); and one by Shell in WR 376. There are two P&A operations, eleven rigs running tools through wireline or coiled tubing, and twenty-nine active drilling rigs (including three predrilling for Stampede, Mad Dog II and Appomattox).
Total and Chevron have entered into an agreement to drill eight near field exploration wells around the Anchor and Appomatox discoveries. The first was spudded in July on the Ballymore prospect (MC 607), which is listed against the East Anstey field, so may not count as a true wildcat.
There were no new discoveries, start-ups or lease qualifications in September. One producing lease expired: Dalmatian, a small gas field started in March 2014; it had produced 30bcf and 0.15 mmbbls.
Recent Business Decisions
There has been one definite FID decision in September for Buckskin. That will be tied in to Lucius, which would suggest there are no expectations that the lease there that was killed off in a couple of years with high water cut will be recovering. Buckskin will use two 8” flowlines. I haven’t seen expected production but I’d guess around 20 kbpd, due in late 2019 for LLOG (after Chevron, Maersk and Repsol have all pulled out as operator). At one time a large, stand-alone development combined with Moccasin (now dropped as an active lease) was expected. It is deep-water, high pressure but uses riser base gas lift, which suggests a tight reservoir, and probably fast decline with depletion drive.
LLOG also announced tie-backs on a number of other small developments that are due in mid to late 2018 (I don’t know if these are formal FIDs yet, LLOG is a private company so doesn’t follow quite the same requirements as publicly listed ones, but these projects do have other partners who would need to agree): Clairborne, two wells tied to Coelacanth; Red Zinger, one well tied back to Delta House; Crown and Anchor, two wells tied back to Marlin; and La Femme / Blue Wing Olive (apparently a type of fly used in fishing), three wells tied back to Delta House. These will all be fairly small flows, I’d guess totaling around 45 to 60 kbpd nameplate and likely quite fast declining. All the wells to be tied back have already been drilled as exploration or appraisal.
In terms of net additional production there is little or no spare capacity on Delta House (before the leak it was at an average of 90 kbpd and rising on a nameplate of 100, and it is designed with minimum on-line sparing so availability would be low), so the additions there imply the existing production is expected to be declining: the sister platform, Who Dat, showed quite fast decline after three years, which is about how old the Delta House fields will be mid 2018. There is quite fast decline on a couple of the fields on Marlin already, but there is existing spare capacity. Coelacanth is only at 11 kbpd on a nameplate of 30 so there’s plenty of capacity but I think Claiborne is small even by recent standards.
On the other hand Anadarko, who had continued to be fairly active in exploration and development offshore, have signaled that they are going to use their cash flow for share buyback rather than seeking more growth (the Freeport MacMoran purchase last year may not be turning out to be such a great idea). With Anadarko cutting back LLOG is the most active player for developments at the moment though the recent pipe failure and shut down at the LLOG operated Delta House may delay things.
With these announcements there are now only five named discovered fields in the GoM that are not being produced or have fairly firm production plans, if not quite at FID yet – two small ones discovered this year, the other three also fairly small. There are a few other likely discoveries that have not been fully appraised and some undeveloped leases attached to existing fields.
Shenzi (shown as the largest producer of the mature fields in the chart above) is operated by BHP. Some activist investors there are trying to get the company to pull out of oil and gas completely. Shenzi is not a typical asset to sell, as it’s a fairly major producer in mid life. BHP is the fifth largest producer in the Gulf.
Well Permits
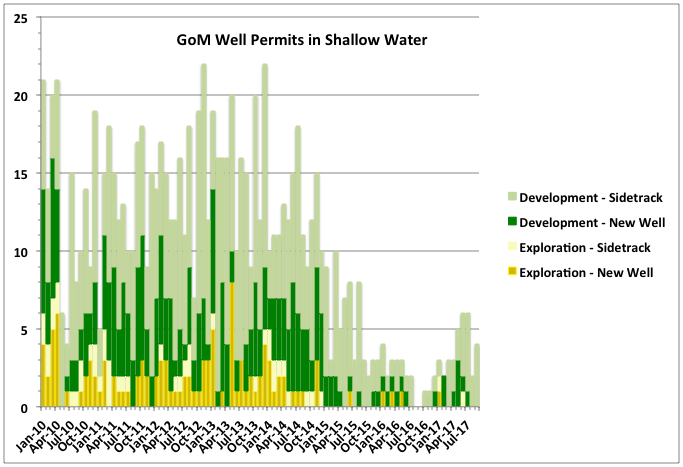
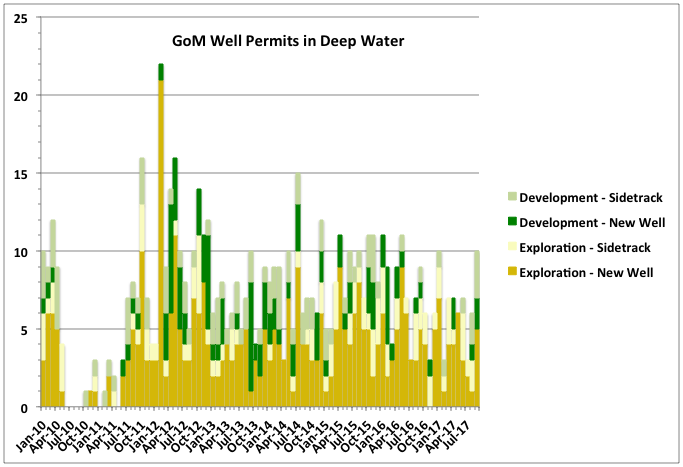
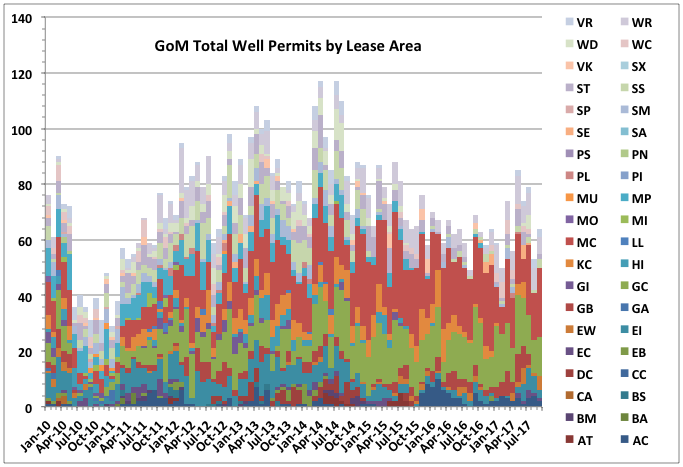
As an indicator of longer-term production trends well permit numbers come after lease auction bids. Exploration wells indicate possible discovery rates and later FIDs and development well numbers indicate expected production in the nearer term. BOEM has extensive and up to date permit records. The charts below show numbers from 2010, with the hiatus in drilling following the Deepwater Horizon accident clear in each. They all show oil, gas or injection well numbers as I couldn’t find anywhere that these are differentiated, however most will be related to oil fields. For the first two charts I’ve only included new wells and sidetracks – i.e. wells with newly identified targets – and excluded amendments and bypass wells. The exploration numbers include appraisal wells.
Shallow exploration has pretty much finished now, and development wells are also tailing off, with recent ones being sidetracks of older wells. Sidetracks mean well slots, and maybe wellheads, on exhausted wells can be reused for new targets without requiring new facilities (I’d guess there are now no free well slots on any of the older, shallow platforms).
Deep water exploration and development numbers are also declining but relatively slowly. However with recent low lease sales, a big drop in new projects coming on line and some of these development wells being predrilled for the few coming projects there could be a sudden drop next year (pace other influences, e.g. a sudden price rise might prompt more in-fill and exploration drilling).
For all permits, including amendments, numbers are steadier but still dropping slowly. Most of the action is in the four main deep water lease areas: MC, GC, GB and KC (see names above).
Off Topic Finish
EVs obviously have a lot of longer term advantages but whatever else they may do they don’t sound like classic supercharged muscle cars:
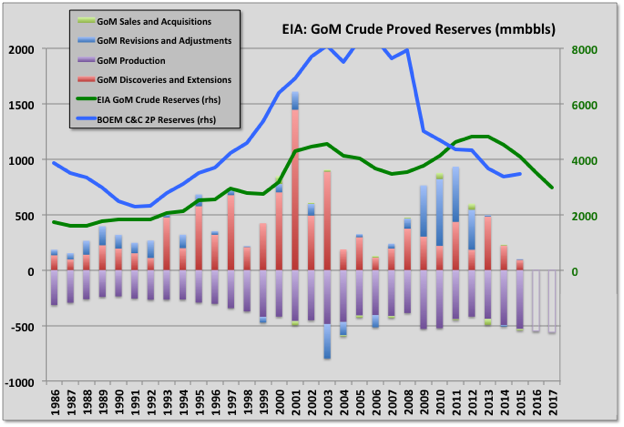
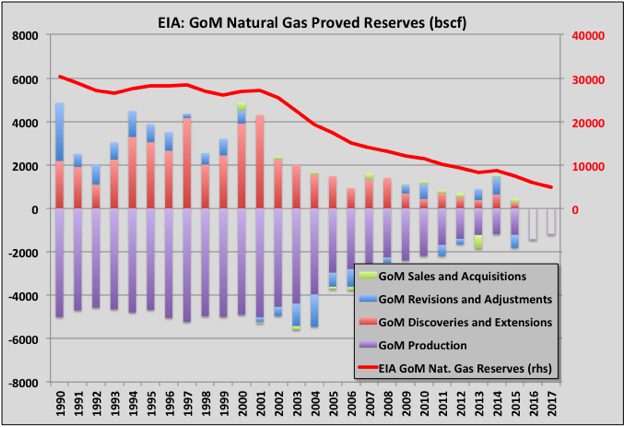
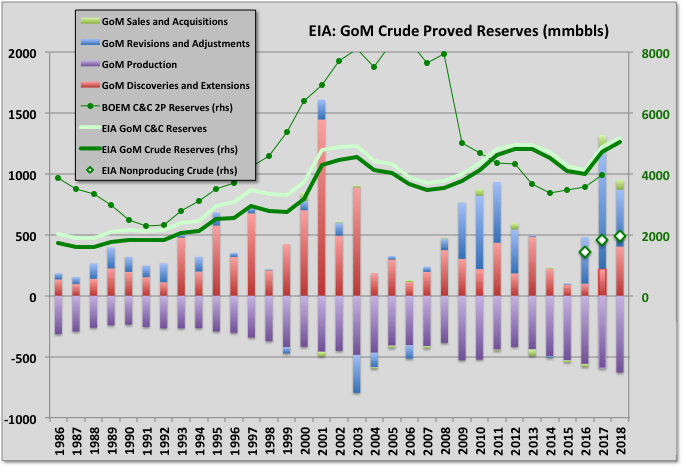
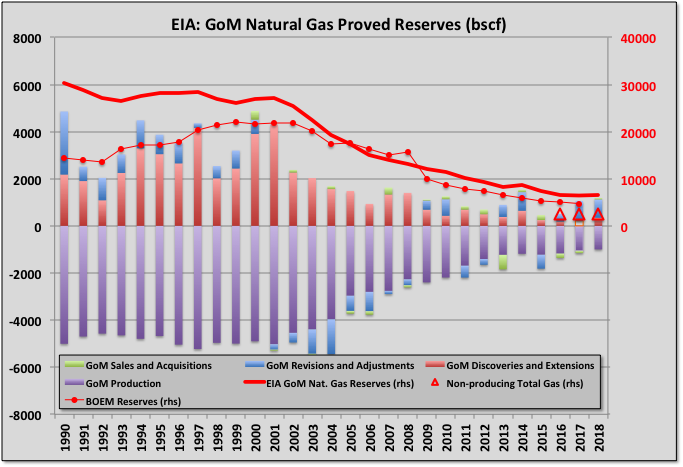
EIA provides estimates of proved reserves based on information from the E&Ps on form EIA-23 for crude only, and also shows the categories for changes (discoveries, production, revisions etc.). This data with updates for 2016 has been due since November but so far has been twice delayed. BOEM make their own estimates for 2P (i.e. proved and probable) based on strict adherence to SEC/SPE rules (i.e. the reserve must be on production or be expected to be produced within five years). I think this usually comes out in May. In the absence of the latest EIA numbers I’ve presented the 2015 numbers with adjustments for subsequent production. There will be revisions and additional discoveries to include once the actual data is available though I think fairly small, especially for gas, but it will be interesting to see.
Despite excluding probable reserves and counting crude only, the EIA estimates have recently exceeded those from BOEM. It looks like a lot of the probable reserves were converted to proved through positive revisions in the period 2008 to 2011; i.e. possibly due to some price increases then, but also immediately following the SEC rule changes to exclude reserves without firm development plans, which may or may not be coincidental: the E&Ps may be less strict on applying the SEC/SPE rule, which they are allowed to do for large, long term projects. The BOEM estimates are pretty much flat over recent years as additions (which then become backdated “discoveries”) from new projects going through FID balance production, whereas EIA estimates are declining with revisions recently zero to negative.
Sales and acquisitions mostly balance out, sometimes with a year or so lag, though overall slightly positive, which I guess means the purchasers are able to get a bit more from the fields than the sellers. There are few extensions to conventional fields (unlike LTO where they are the largest positive factor) and discoveries have trended down significantly over the last three or four years (this would probably have happened a couple of years earlier but for the drilling hiatus caused by the Deep Horizon accident).
C&C Production
For November the production losses from Hurricane Nate have been recovered but more than 100 kbpd streamday was lost because of the subsea connector failure on LLOG Delta House Rigel template and the Shell Enchilada gas line failure. Total oil by BOEM was 1675 kbpd (up 211 kbpd m-o-m but down 16 kbpd y-o-y) and by EIA 1666 kbpd (up 209 kbpd from October, but down 21 kbpd y-o-y). Note that several leases did not report November numbers so I have had to estimate production based on data from the months before the hurricanes started to have influence.
New fields production has peaked for the time being, even allowing for the offline fields. Stampede might give it another boost once it comes on-line soon. The smaller additions are generally in decline, but there has been some in-fill additions for Horn Mountain, Holstein and Phoenix.
The large platforms, and Mars-Ursa should be considered with the ones listed, are holding and increasing production the best. I don’t know how much more there is to come, but certainly Tahiti and Atlantis have large brownfield developments in progress. The larger ones shown are around ten years old, which would normally be around the end of a plateau period, but equally they tend to have a lot of excess processing capacity. If nothing else some of them must be due for major turn-arounds in the next couple of years, which would take about as much production out for a year as Nate did.
The smaller, mature fields took a hit with Enchilada offline, but maybe not as big as might be expected given their continuing steep decline.
Shallow fields continue to decline. There was some headline news concerning Byron drilling the South Marsh Island 71 block, but it only has about 4,500 bpd capacity.
Recent News and Activity
The Enchilada pipeline is still offline with no date for restart published yet, which is keeping about 75 kbpd oil production offline from Baldpate, Salsa, Cardamom and Magnolia since early November. The workers injured in the incident have started proceedings against Shell for compensation due to safety failings. All these fields were in fairly steep decline so the production, and therefore revenue and interest, is only lost while they are offline rather than being deferred several years, as would be the case for a system on plateau. The subsea failure on the Rigel manifold feeding Delta House has resulted in Rigel, Otis and Son of Bluto 2 being off line for most of October and all of November (about 40 kbpd capacity). I have seen no news that this has been repaired. Without these two major unplanned outages November would just about have beaten the March record for production.
Anadarko relinquished the Phobos lease after poor appraisal well results. It had been the only qualified lease in the far south Sigsbee Escarpment lease area and was being planned as a long tie-back to Lucius.
Maersk Drilling has lain off workers that had been working on the Maersk Viking for ExxonMobil’s Julia field, which seems to have finished ramp-up although there had been plans for a phase II there. It had been in quite steep decline but there has been about 6,000 bpd increase in the flow over the last two months and it may be near a new peak. Stones drilling has also stopped, it has a nameplate of 40 kbpd but has only so far exceeded 30 for one month. Heidelberg drilling, too, has now stopped and it has achieved about 40 kbpd of a nameplate of 70 kbpd; phase II is due in 2021.
Tornado II started production in mid December at about 10 kbpd oil. Combined flow for Tornado/Phoenix is currently reported at about 21 kbpd oil, or net 8,000 bpd up on the average with Tornado I alone. There’s also been a big increase in the Horn Mountain lease, which has gone from less than 10 kbpd and declining in May, to now over 32 kbpd.
Two non-quantified discoveries have been announced as variously “major”, “significant” and “amongst our biggest”: Whale for Shell/Chevron, which does sound pretty big and is near the Perdido platform, and Ballymore for Chevron/Total, which is near Blind Faith. I suspect both will be tie-backs as the reason for concentrating on near field exploration was to save money on subsequent developments. Perdido has 100 kbpd nameplate and currently produces 66 kbpd, and Blind Faith has 60 kbpd with over 37 kbpd capacity available, and rising. Appraisal drilling is continuing on both, and that hasn’t always been as great as the initial announcements (e.g. Kaskida, Shenendoah and, recently, Phobos). I’m not certain, but think they both may count against last year’s discoveries and the announcements have been delayed to be immediately concurrent with the 2017 financial statements.
Wood Mackenzie was reported as giving predicted 2018 GoM deep-water production of 1935 kboepd, a new record. I think this is an average rather than a peak or exit rate, but I couldn’t find for sure. Note this is oil and gas (reported as including 80%, I think C&C only, but could be total liquids) and doesn’t include shallow water, which may be below 500’ (common industry limit) or 1000’ (BOEM limit), the report didn’t say. I don’t know why it was made so complicated, probably so they can declare a record of some kind that would help to try and sell the full report.
Currently (early February) there are forty-nine deep-water well related operations in progress reported by BSEE. Thirty-four are drilling related, with five pre-drilling for future projects and four on unnamed fields (so wildcats or appraisals). Of the fifteen running tools one is for P&A on Tick, which is fairly shallow water. Numbers in brackets on the production charts show the number of listed activities for each field. There is no current indication that the increased oil price is leading to increased drilling and the Baker Hughes count of active rigs has actually fallen slightly recently, though there may be signs of an uptick in non near field wildcats, but probably still early to say.
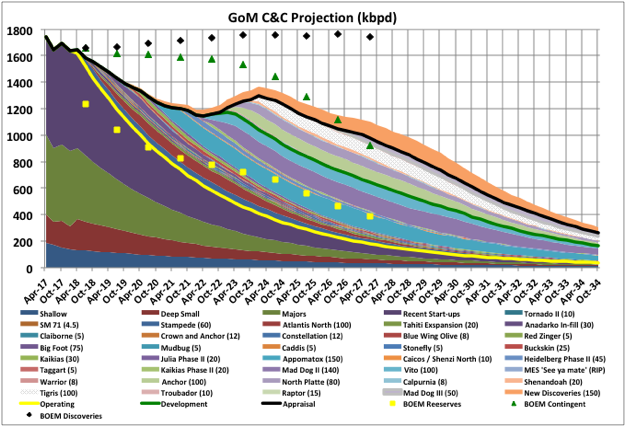
Future Production Scenarios
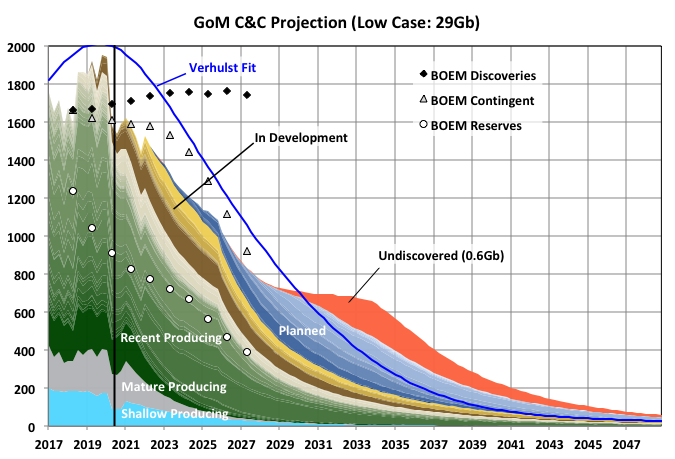
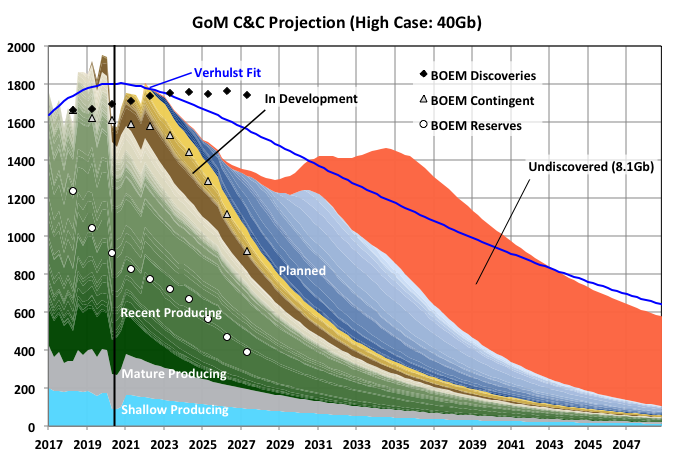
Below is an updated projected scenario (i.e. guess) for future production. The curves are adjusted so the total production in each section equals the estimated reserves for those fields from BOEM numbers for January 2016 less any production since then. Their estimates for this year (showing January 2017 numbers) have not yet been issued. For projects under development and discoveries I’ve used the E&P numbers for reserves, production and start-up where available or just made a guess. Numbers in brackets are nominal crude and condensate nameplate capacity for the expected development. I’ve included some nominal new discoveries with total reserves of 500 mmbbls, but may have to change that once the Whale numbers are announced.
I’ve also shown the 2018 BOEM production forecast, which I don’t fully understand. For instance they have on-line production suddenly dropping about 400 kbpd this year, but being made up with contingent numbers, which I would have assumed is possible development but can’t be; but also can’t be planned start-ups because there is nothing like that amount due this year. They also have a large amount of new discoveries that come on line very quickly – i.e. ten years to bring on line 800 kbpd, which would be some combination between eight big discoveries and eighty smaller tie backs. Nothing in recent history of exploration success or lease sales, or usual cycle times for deep-water projects, would suggest that is likely.
EIA STEO has its normal steady exponential rise, now extended through 2019, with bites out for hurricane season.
Off Topic Finish
Black domestic cats might be about to start to go extinct, as they don’t show up well on Instagram and the like. In one Bristol, UK rescue centre all forty cats that haven’t found homes are black. Owners of black cats are being particularly encouraged to get them neutered. The world is turning upside down.
2017 was the highest producing year for oil in the GoM and included the record month in March. Gas, which has tended to come from shallow water wells, had accelerated decline. The production would have been higher but for some disruptions from Hurricanes, in particular Nate, though that had the least impact onshore, and some unplanned outages in November and December due to equipment failures. The failure to Delta House subsea manifold affected Rigel, Otis and Son of Bluto 2 fields, and the first two still appear to be off-line while Son of Bluto 2 resumed production in December (LLOG, the operator, I think calls the Rigel field Neidermeyer, which is much better for the Animal House theme). The Enchilada gas pipeline appears to have ruptured at the main platform and has resulted in Baldpate, Salsa, Llano, Cardamom and Magnolia going off-line. Plans were recently announced to restart Baldpate/Salsa, which do not go through the platform, but I haven’t seen any notice of the restart.
Oil Average
Oil Exit Rate
Gas Average
Gas Exit Rate
Total Average
Total Exit Rate
(kbpd)
(kbpd)
(mmscfd)
(mmscfd)
(kboed)
(kboed)
2016
1600
1728
3308
3363
2151
2289
2017
1685
1570
2955
2381
2177
1967
Change
85
-158
-354
-982
26
-322
Ratio
5.3%
-9.1%
-10.7%
-29.2%
1.2%
-14.1%
C&C Production
December production numbers were dominated by the unplanned outages, so comparisons with November don’t mean much. As well as the two issues given above the Tahiti and Caesar/Tonga fields were off line for a few weeks, though I have seen no news why (these share a common set of leases but are produced separately to the Tahiti and Constitution platforms). Each month that these are three issues hold current outages would knock about 10 to 12 kbpd off the achievable average production for 2018.
Despite recent variability it certainly looks like the new fields brought on since late 2013, and which have seen all the net growth since then, have peaked. Any average decline rate can’t really be extrapolated yet, given the recent upsets, but the BOEM reserve estimate updates, due in the next couple of months, will provide better R/P numbers as there will be longer operating data for all the fields.
BP, Shell, Anadarko, Chevron and BHP have completed a lot of brownfield work and in-fill drilling to maintain production at their large, operated platforms, but they may be running out of options for the next couple of years, and there is some evidence of rising water cut in some of the larger leases at Shenzi, Atlantis and Thunder Horse (and also in West Boreas, a recent start-up for Shell in Mars-Ursa).
Natural Gas
Natural gas production saw accelerated decline through 2017, mostly from rapid decline of Hadrian South and the Enchilada outage. Shallow fields added some production late in the year, all from one lease in the Eugene Island area.
Apart from Hadrian South most of the gas from new fields is associated with the oil production and will decline in line with that. Otis is a small gas field that has been held offline by the Delta House outage.
The impact from the loss of Baldpate / Salsa production, which are mostly gas producers, is shown here, however also evident is how fast those fields had been declining anyway since 2014.
Hadrian South
Hadrian South looks to have finished. Production had been dropping fast since the summer and then, in October and November, water production appeared and gas flow stopped. On plateau it produced 300 mmscfd from only two wells, which is pretty prolific and slightly higher than planned. The wells had been producing about equally but one died between May and July and the second in November. Both were offline throughout December. Overall the field’s total recovery is lower than the BOEM reserve estimate, but only by about 38 bcf (6.5 mmbbls) so it’s questionable whether there will be any further efforts at increased recovery, certainly in the near future as there is no drilling rig contracted there, although there is another qualified lease for the field that has not yet been produced.
Production Wells Creaming Curves
The following two charts show the number of producing wells for new fields and the larger, mature platforms. They both show how wells were added from 2014 through 2016, leading to the increased production in these two groups, but both numbers have now flattened off, which is likely to precede the start of a decline. For the new additions the move to tie-backs with one or two wells in 2016 and 2017 is evident and the continuous development at Mars-Ursa also stands out.
Drilling Activity
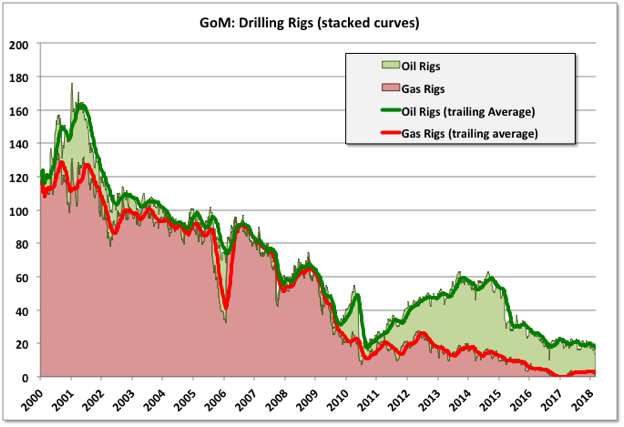
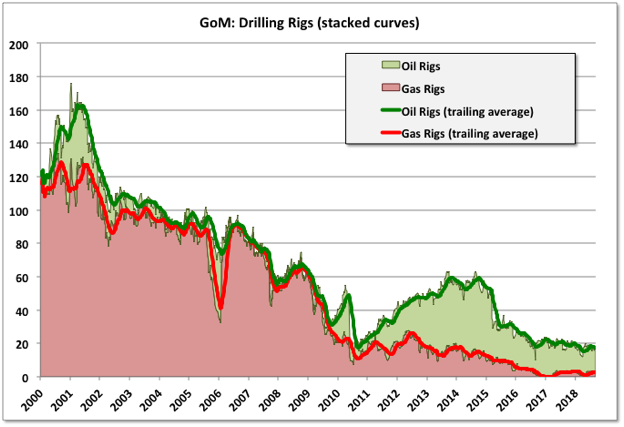
By Baker-Hughes active drill rigs averaged 20 in 2017 compared to almost 23 in 2016, and the numbers have continued to drop this year with a low of 13 earlier in March (the lowest since 2000, though the drop in shallow gas drilling is responsible for, by far, most of the change).
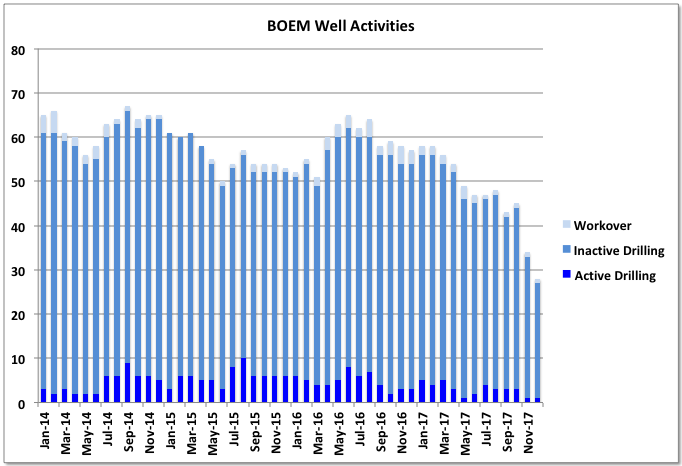
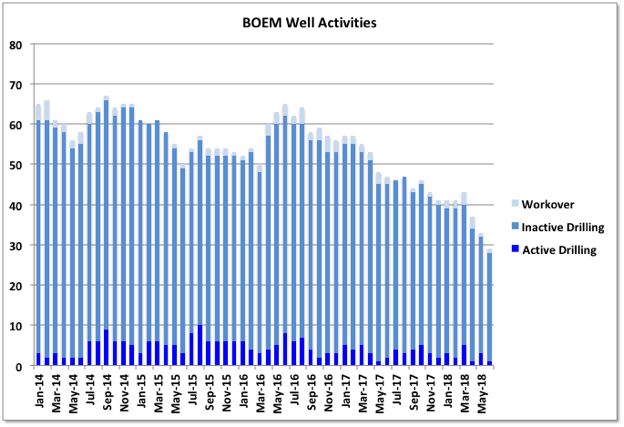
BOEM gives a monthly break down of each well by category, and it is noticeable how the number of wells being drilled has fallen off in the second half of 2017. (I think inactive wells are those that have not yet seen any production, but sometimes these are counted as “temporarily abandoned”, of which there are many and therefore it’s impossible to pick out new ones from old.)
2018 Plans
The Stampede platform started up in January. It has nameplate of 80 kbpd but some of that is for potential future tie-backs. The wells are pre-drilled and it should reach 50 or 60 kbpd streamday production quickly, though maybe not with high availability initially.
LLOG plan to bring several fields on line with one to three well tie-backs to existing platforms. However Red Zinger and La Femme / Blue Wing Olive go to Delta House. The subsea system is likely to be fixed when these are due, but the Platform was operating at nameplate capacity and with extended production deferral may not have processing capacity for these new wells this year.
Anadarko has planned five wells in existing fields, in particular for Constellation with BP, which will be about 15 kbpd. Anadarko have stated that they are looking at redeploying spar platforms onto other fields (probably for Shenandoah). I think that means one or more of their developments are nearing end of life, despite recent near field tie-backs, and that their remaining green field prospects are not very attractive at current oil prices. The platform mentioned was Marlin, though they have other mature Spar facilities like Holstein, which may impact LLOG as their tie-backs for Crown & Anchor are due to go there (but may have relatively short lives) and also is the site for two of this years new wells so maybe this is just conceptual speculation at the moment.
Big Foot is due at the end of the year. It was originally planned for 2015 start-up but had mechanical failures during installation, which are now fixed. Capacity is 75 kbpd nameplate. It is heavy oil and uses dry trees with ESPs. Two wells are pre-drilled but the rest only have the top two conductor sections ready, therefore ramp-up will be through 2019 as new wells get completed.
Off Topic Finish
This painting is by Mary Cassatt. There has been no better painter of children before or since. One theory for this is that she was a woman in, at the time, a man’s field, and the men all tended towards painting nudes; but maybe she was just really good at it. The greens in the carpet and blues in the chairs are gorgeous, though better in real life than here (it’s home is Washington DC), the dog is happier than it has any right to be, and I can’t help thinking the girl grew up to like an occasional night on the town.
BOEM has March 2018 production at 1696 kbpd, which is down 1% month-on-month and 4% year-on-year (March 2017 was the peak production month for GoM so far). EIA numbers were very similar, although last month’s were higher and haven’t been revised yet – typically EIA numbers end up almost exactly corresponding to the BOEM reported total qualified lease production, whereas BOEM can be a little higher, maybe including test wells or non-qualified leases.
The major new project, Stampede, started in January, has no reported production numbers yet. BOEM and EIA estimate non-reported values and then retrospectively adjust their reports when actual numbers are available. I don’t know how they estimate new production but Stampede could produce around 60 kbpd with current plans, though likely a lot less initially as only one of two leases has been ramping up. I’ve assumed 20 and 40 kbpd for February and March respectively, which still might be high. Even allowing for that, and assuming other late numbers are the same as the previous month, since December EIA and BOEM both have estimates about 30 to 40 kbpd higher than the reported lease and well production numbers (which always match closely) would suggest. Usually the difference is no more than ten. It is unlikely that the other late numbers, of which there are few, and none for all four months, will show such large, sudden and unexplained increases so either I’m missing something (maybe a lease not yet included in the numbers, but also not reported as starting up) or there could be some future downward adjustments.
Rigel and Otis are still off-line following the failure at a subsea manifold last October and are taking out about 22 kbpd plus some gas (Otis is a small gas field). Great White, Stones (for the full month) and Caesar/Tonga all had noticeable downtime in March taking about 90 kbpd off-stream.
The Kaikias Phase I development for Shell, a tie-back to the Ursa hub, was brought on line one year ahead of schedule in early June. It has an expected peak nameplate of 40 kboed (which may only be around 30 kpbd average oil), and will likely take a bit of time to ramp up to maximum. Equally to accelerate production like this probably meant using a drill rig that was previously scheduled for alternative wells on Mars-Ursa, so there may be faster than previously planned decline on some of the other leases there.
In the second quarter there is likely to be downtime showing for Marlin, Horn Mountain and Holstein as they have planned turnarounds to prepare them for new production and, presumably, to allow normal maintenance; they should then come back online with higher overall flows. Marlin has one new Anadarko well planned, plus two from LLOGs Crown and Anchor field. Holstein has a platform rig and is developing four side-track wells this year and next. Horn Mountain has one more tie-back from Dorado field planned.
Atlantis has no drilling or work-over activity currently shown and in the past its wells have declined at around 20% year-on-year (see below), which may continue until the first Phase III wells come on line in 2020.
Llano, Cardamom and some of Baldpate/Salsa production came back on line following the partial repair of the Enchilada pipeline, adding around 45 kbpd, but there is some still off line, which I think has to be processed through the Enchilada platform and for which I’ve seen no expected restart news; however Anadarko have said it will be “later this year”, which I’d take to mean a few months yet. All these fields are fast declining so although they give a jump for March they will result in steeper declines for the remainder of the year
The BSEE deep-water activity report showing wells with drilling, completion, P&A or work-over activity currently shows 40 actions, this is down from around 50 at the beginning of the year and has been fairly steady for the past two months.
Overall C&C looks to be continuing an overall slow decline started in the second half of last year, and if the unaccounted for 40 odd kbpd is revised out, then it is clearly accelerating. A lot will depend on downtime for turnarounds and hurricanes. So far this year these losses look higher than last (e.g. the early Tropical Storm Alberto took out about 7 kbpd for about a week, and also disrupted P&A activity on Lena and installation work at Appomattox) plus Mars-Ursa looks set for a partial shut down in April and the current Perdido / Great White turn around looks to be quite prolonged. Another major unplanned outage, like Enchilada or Delta House, is also possible. The Kaikias development by Shell has been advanced, but that may be countered by delays to Constellation, Hadrian North and some Delta House tie-backs.
Natural Gas
Natural gas production is in continuous decline. BOEM had March production at 2.59 bcfd, down 1% month-on-month but 21% year-on-year. The loss of 300 mmcfd from Hadrian South since last year and the losses from Baldpate / Salsa, one of the few other remaining significant gas fields, and Otis, because of the Delta House failure, meant last year showed accelerating decline which is unlikely to recover. Na Kika has a few gas leases, and a new long distance tie-back, Coulomb II, is due soon, but mostly the gas now is associated with the oil and will decline accordingly.
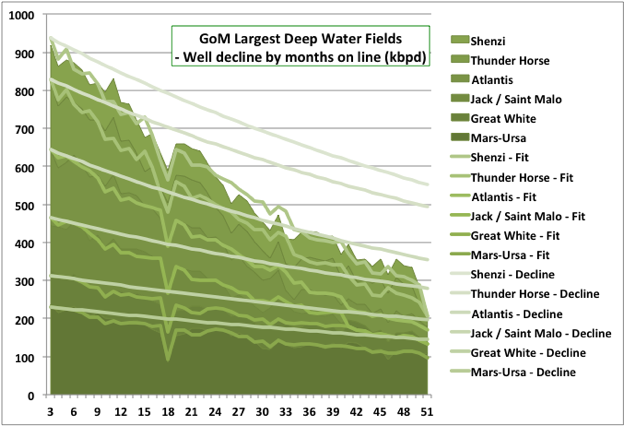
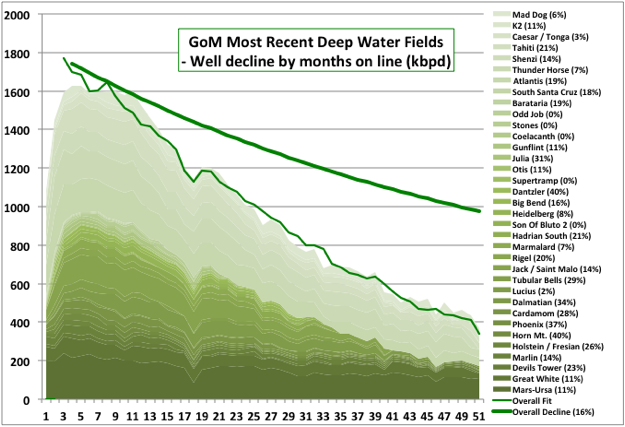
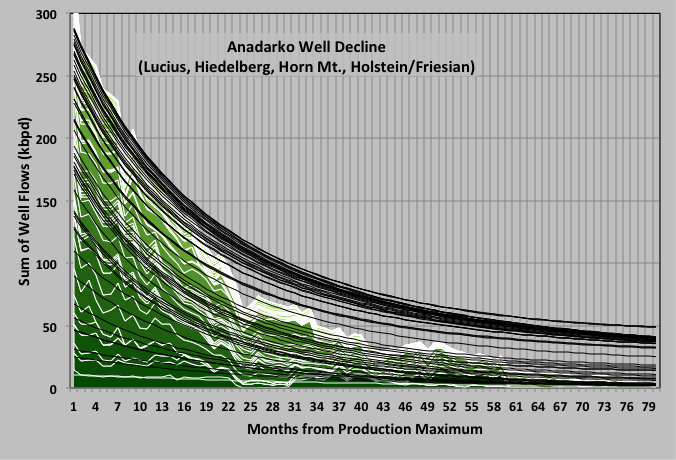
Deep Water Well Decline Rates
I had a go at finding the decline rates of the wells in the more recent deep-water fields. In the charts below for each field all the wells are lined up so month one is their first production or January 2014, whichever is later, and a decline curve is fitted, from the third operating month to avoid the ramp-up period, assuming all wells in a field follow the same exponential decline and according to how many wells were producing for each month.
Most of the fits came out reasonably well. Six of the largest fields are shown in detail below. The overall (stacked) decline curves indicate the expected decline rate for all the wells remaining online, they are not predictions of future production.
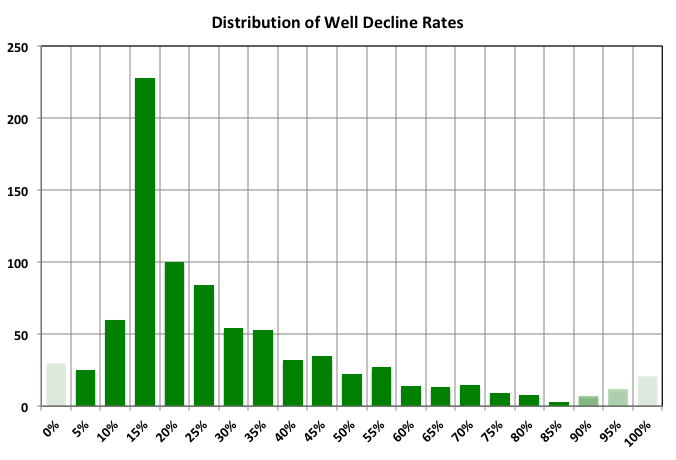
The fields where the fit was poor were either new projects that are still on plateau, have had fairly patchy start-ups, or have produced a lot of water (or all three) and include Lucius, Stones and Odd Job; or ones where there has been some sort of well rework, e.g. K2, which had gas lift added, and Mad Dog, which had various new measures including water injection added on some blocks. I didn’t include Na Kika as it is a collection of several different fields, some of them gas, and has a pretty uneven production history. The individual decline rates for each field are shown in parentheses after the name and run from 0% for fields on early plateau, up to 40% and with a pretty good spread between.
The decline rate for the fields analysed is likely to increase because of new projects coming off plateau, water breakthrough or acceleration (e.g. at Great White, Mad Dog, Lucius and Mars-Ursa might be the most likely) and a normal development feature that the best wells are drilled first; but overall that would likely be balanced by new projects reaching plateau. The overall average decline rate came out as 16%, which is maybe not surprising given that depletion rate for the whole GoM based on BOEM 2P numbers for 2016 (the latest available data) was also 16%. With depletion and decline close it would imply there isn’t much being added to reserves on operating fields, or any that has been was quickly put on-line.
Applying these decline rates to the 2017 field production rates gives an expected drop this year of 175 kbpd. Shallow fields are likely to decline 30 kbpd and the deep-water fields that I didn’t include about 45 kbpd. So total would be 250 kbpd; assuming 90% availability that would require 275 kbpd of additional nameplate capacity added to hold production steady.
2018 and 2019 Developments
The only certain major new fields this year are Stampede, adding up to 60 kbpd, and Kaikias Phase I, which may add about 20 kbpd averaged over the year. Constellation was due but looks to have been pushed into 2019, and Big Foot is due late but may not contribute much to the average, although could boost the 2018 exit rate. There are four smaller field tie-backs for LLOG with one or two wells: Red Zinger, Crown and Anchor, Claibourne and La Femme / Blue Wing Olive. Some of these may be limited by available capacity at the host, and will contribute only in the second half of the year. Recent small field wells tend to start at around 6000 to 8000 bpd and immediately decline, but those fields together could add 50 to 60 kbpd at end of year. Bigger wells are likely to come from in-fill and development drilling at Jack / St. Malo (two wells), Horn Mountain Deep and Marlin for Anadarko (three wells, but very high decline rates if they are like the recent ones), Tonga (I think one last production well), one side track well at Holstein (with three more next year), continued BP drilling at Thunder Horse, and Shell projects at Mars-Ursa, Stones and Great White. BP and Shell wells may add the most but they are also the ones with the least information.
There should be some offline production returning at Rigel and Baldpate, maybe 40 kbpd, but also fast declining. With the new fields that would leave 120 to 180 kbpd needed this year from the in-fill drilling to keep annual rates about average (the range is dependent on the timing of all the wells coming on); I think that is going to be difficult. Next year decline is likely to accelerate because a lot of the mentioned in-fill wells and tie-backs are the last available for those projects and some of the rigs are being released, plus Kaikias has been accelerated, so will contribute less additions next year than originally planned. Atlantis Phase III has also been moved back to 2020. 2019 has some planned continued development for Thunder Horse, tie-backs for Hadrian North and Buckskin to Lucius and the delayed Constellation tie-back to Constitution, but overall things look thinner than this year, at least until Appomattox (with 175 kboed nameplate) begins ramp-up towards the end of the year.
The drop off in the number of wells showing drilling or work over in the chart below highlights the possible slowdown coming in 2019.
Better projections will be possible when the BOEM reserve estimates for the end of 2016 are available. These are quite late compared to last year, but in the past they have come out in July or August, and EIA reserve estimates were also pretty late this year.
Among the fields given it lists significant new oil production as expected from: Amethyst, a small and failed gas project and Phobos, both of which are rescinded leases with no current activity; Otis, an existing gas field; Son of Bluto 2, a small oil field started in early 2016 with no current drilling and indicating slight decline; Rydberg, a recent Shell discovery with reported 100 mmboe resource base, which I think would be a later addition to the Appomattox project; Gotcha, a lease which is part of Great White, started in 2014 and in slow decline; and Bushwood, a single gas well tie-back started in 2014 and now almost exhausted (although there has been some drilling there this year). There is little new oil, or much significant oil at all, in that collection.
It does also list Horn Mountain Deep, Stampede (though listed as two fields, when it is really only one) and Kaikias, which will be bigger contributors, but not enough by far to meet the given growth expectations (and I think the Horn Mountain developments will be showing rapid decline by next year).
It does not mention Big Foot, Appomattox, Buckskin, Hadrian North, Red Zinger, Crown and Anchor, Claibourne or Blue Wing Olive as new fields, or the Thunder Horse developments and other Anadarko in-fill wells. I don’t know how they come up with their assessments but they seem to be getting more removed from actuality, and not just from being overly optimistic. Similarly the EIA STEO is just a constant exponential growth that is re-zeroed each month to current production figures with no changes made based on FID decisions, reserve numbers or overall production history.
Off Topic Finish
As the last country music link went down fairly well here is another. Two minute thirteen seconds of downbeat alt.country bliss. It’s the title track of an album that I always expect to see in ‘Top XXX’ lists, but never have, which shows how much I know. The singer and writer, Willy Vlautin, also writes books, one of which, “Lean on Pete,” was made into one of my favourite films of the last year, a classic American road movie with a sort of happy ending (though not for Pete). Richmond Fontaine
And here is Vlautin’s new band, more traditionally country, with an apposite song (I think the singer is the sister of the vocalist on the previous tune). The Delines
All data below is from various sources. All US data is from the EIA. Unless otherwise noted is in thousand barrels per day.
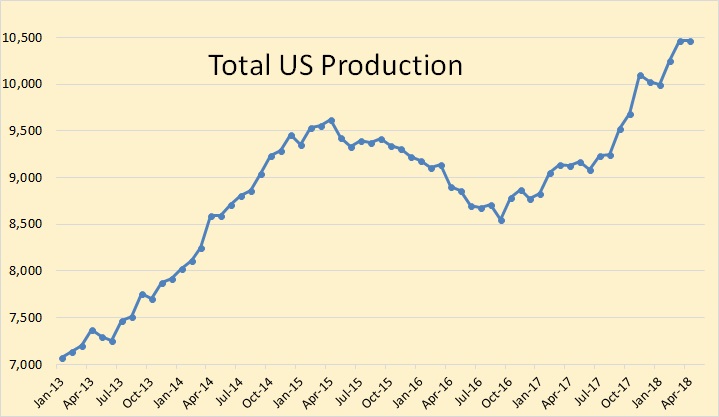
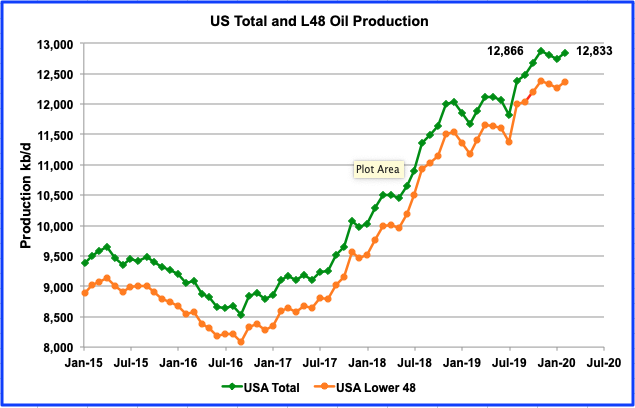
USA data is through April. C+C production was almost flat in April, down 2,000 bpd.
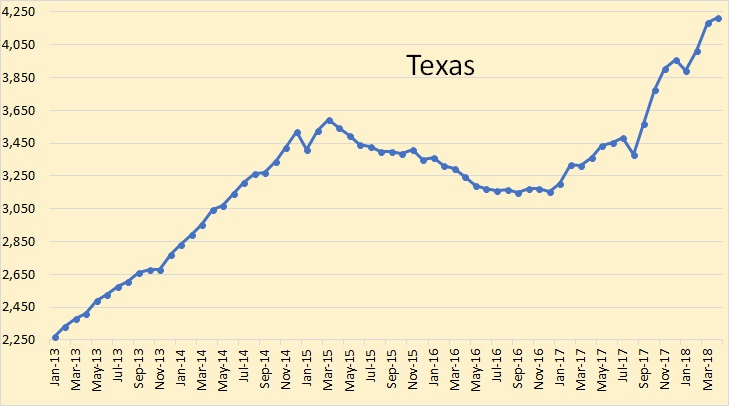
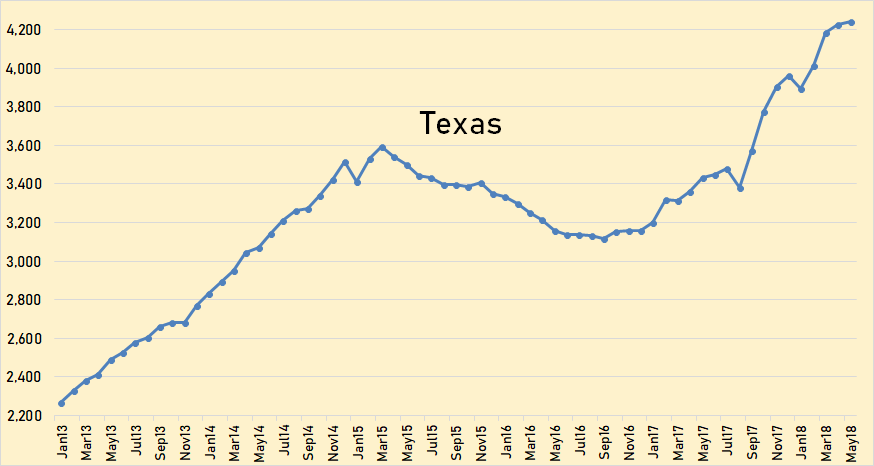
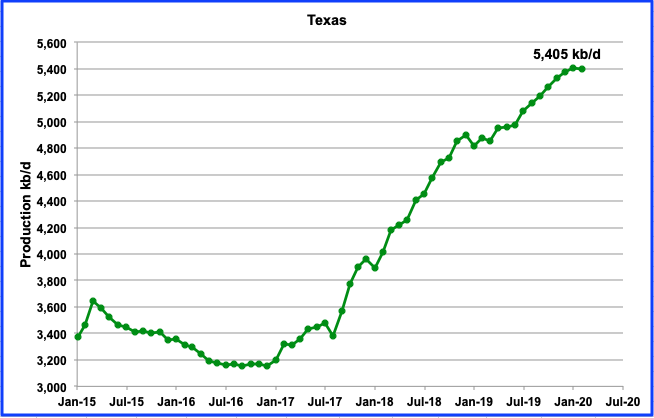
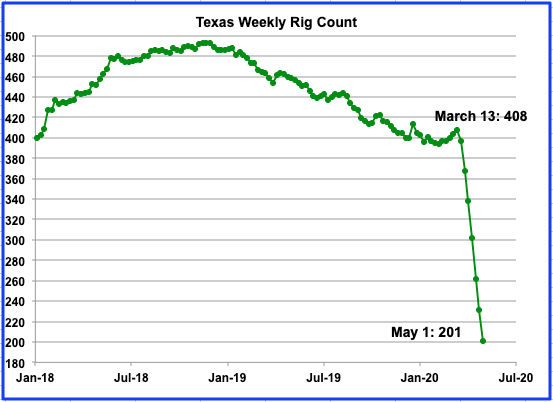
Texas through April. Texas production was up 30,000 bpd in April.
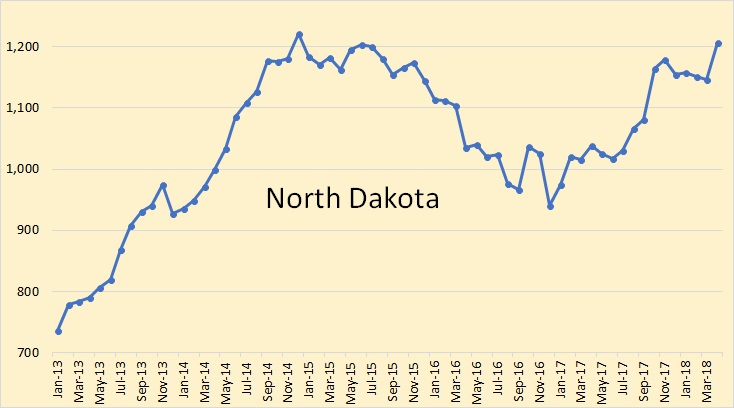
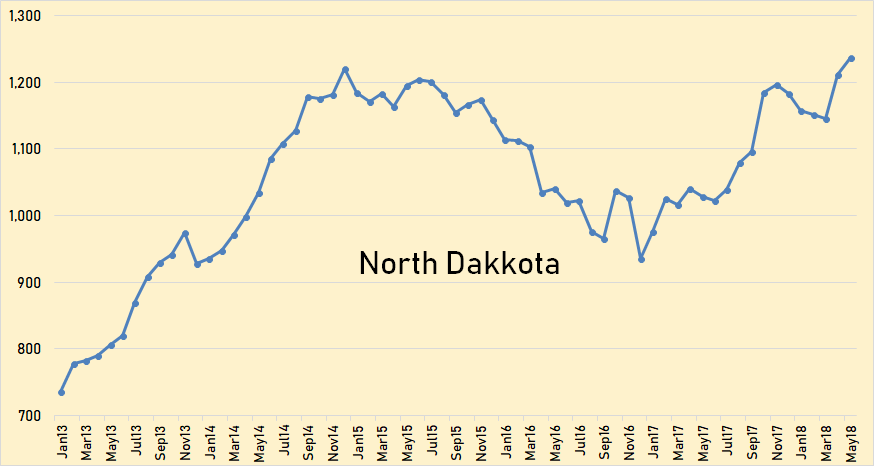
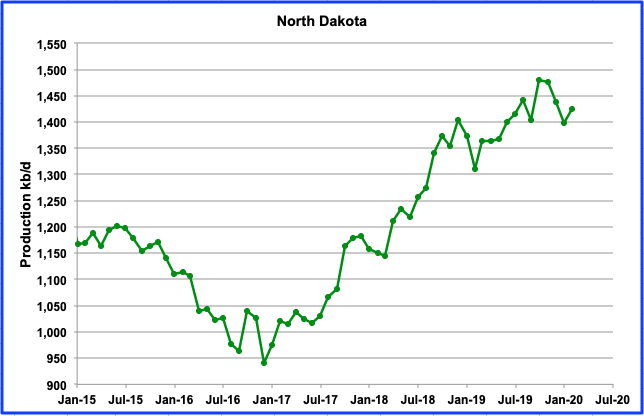
North Dakota through April. North Dakota production was up 61,000 bpd in April.
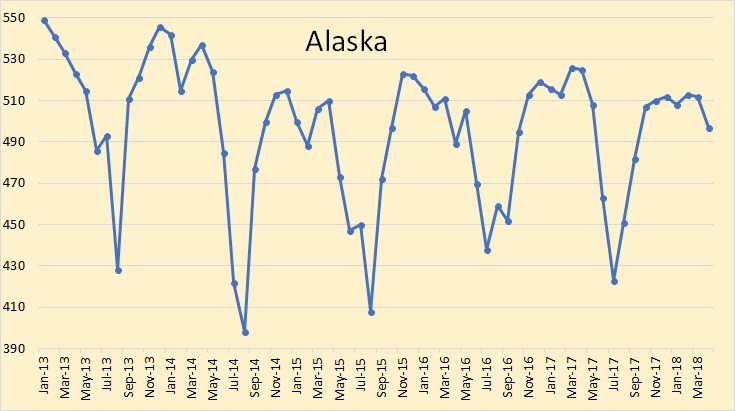
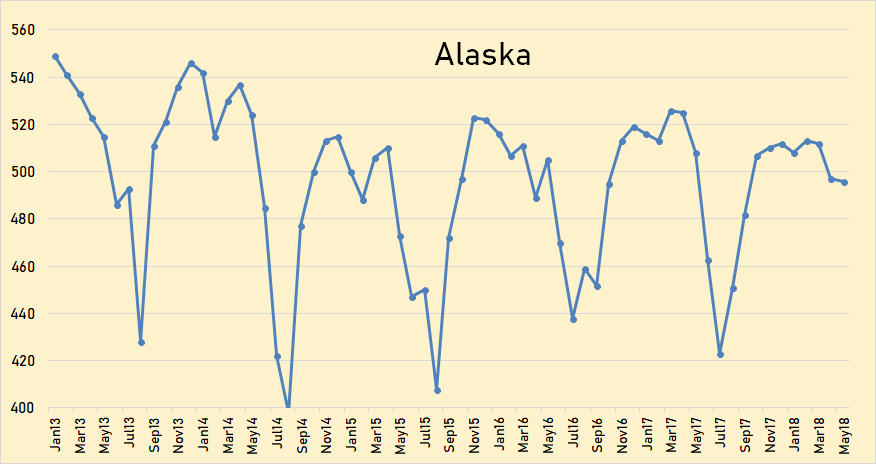
Alaska through April. Alaska production was down 15,000 bpd in April.
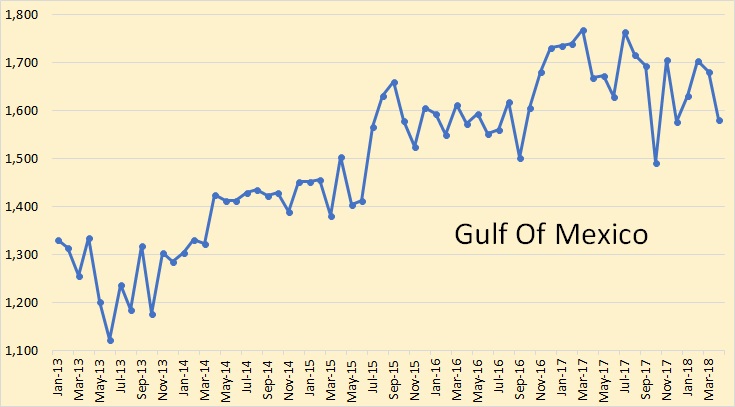
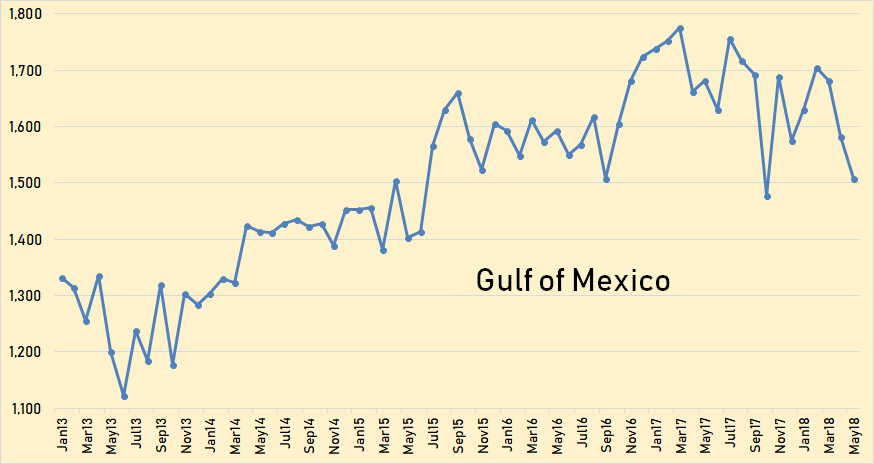
The Gulf of Mexico through April. The GOM was down 98,000 bpd in April.
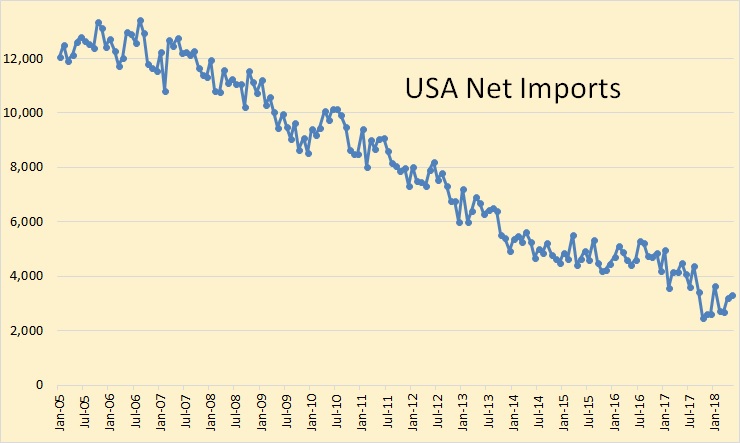
USA net imports averaged over 12,500 kbpd in 2005 and 2006. They are now down to around 3,400 kbpd.
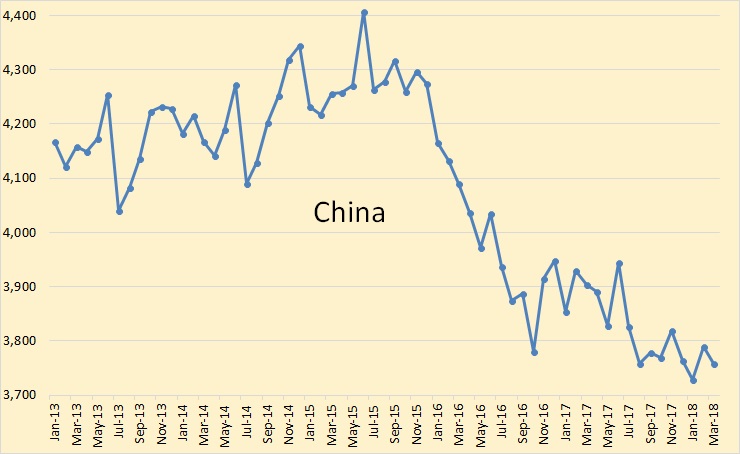
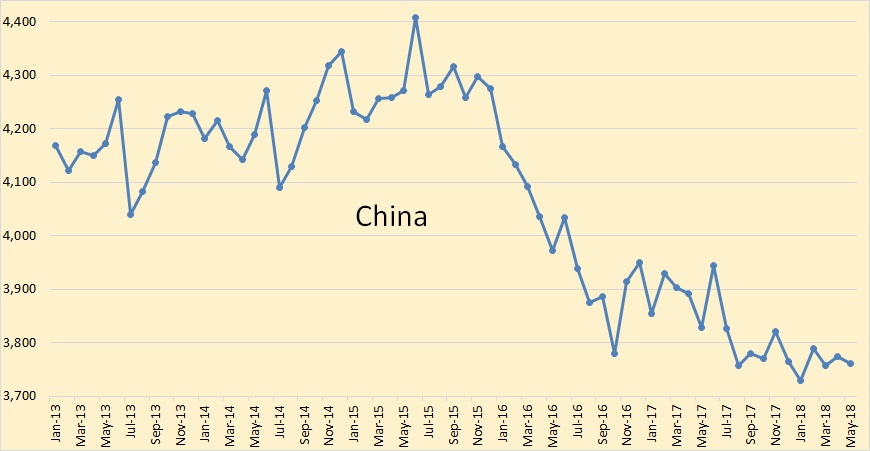
China data through March from the EIA.
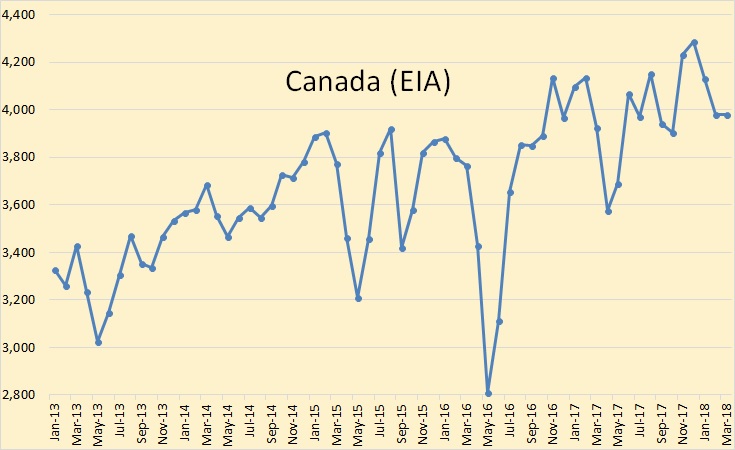
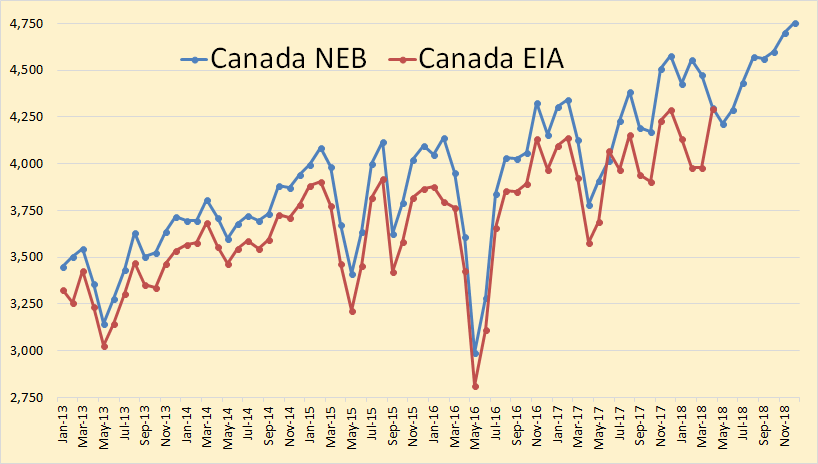
Canada through March, EIA.
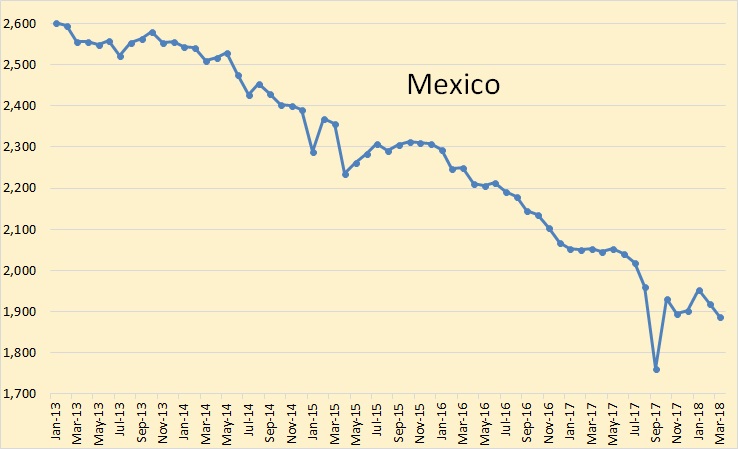
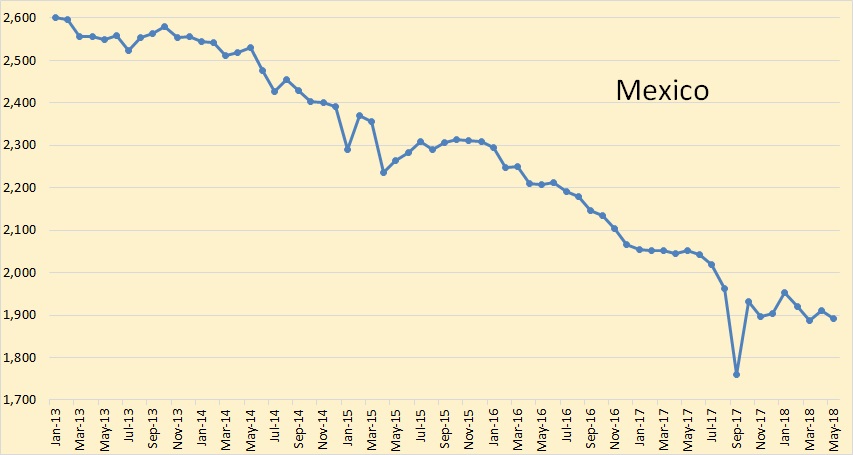
Mexico through March, EIA.
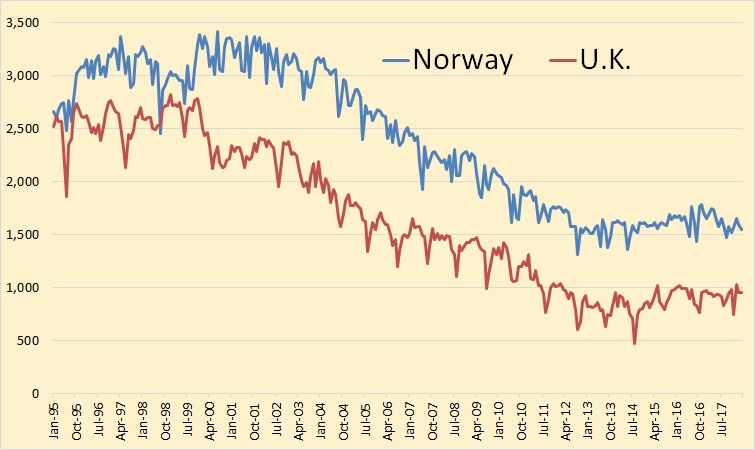
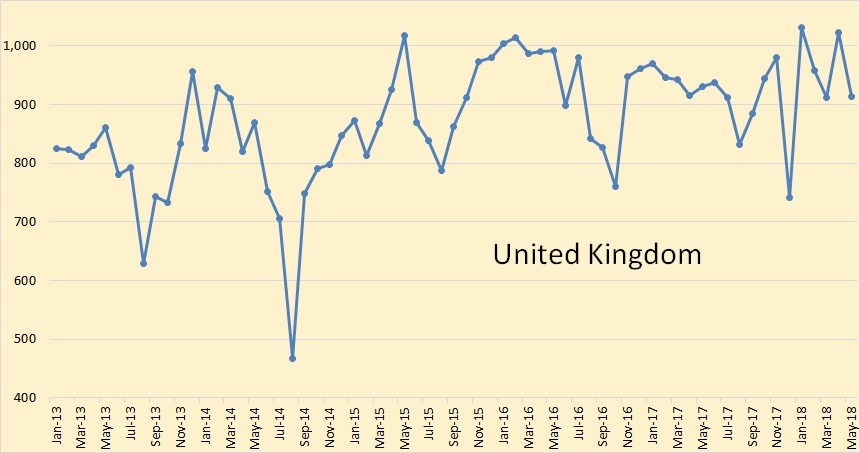
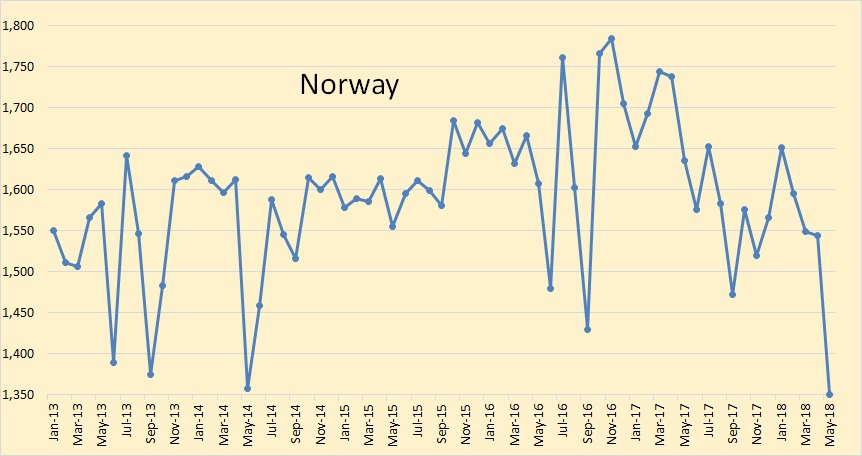
Norway and the U.K. through March. I have included historical data here in order to show the total decline from their peaks around the turn of the century. There has been a recent uptick in production from both countries.
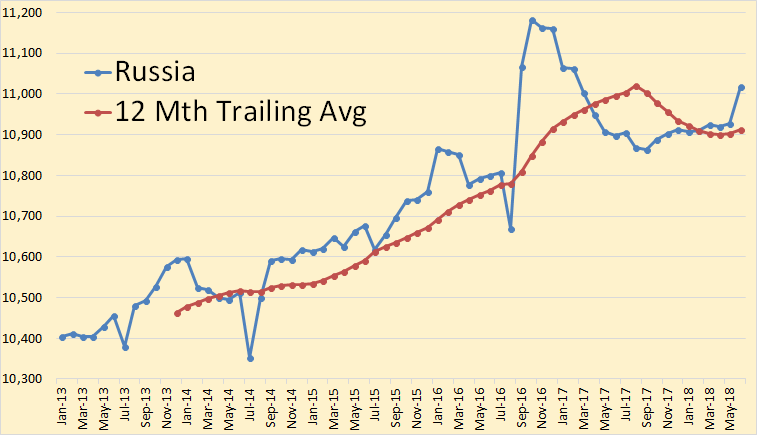
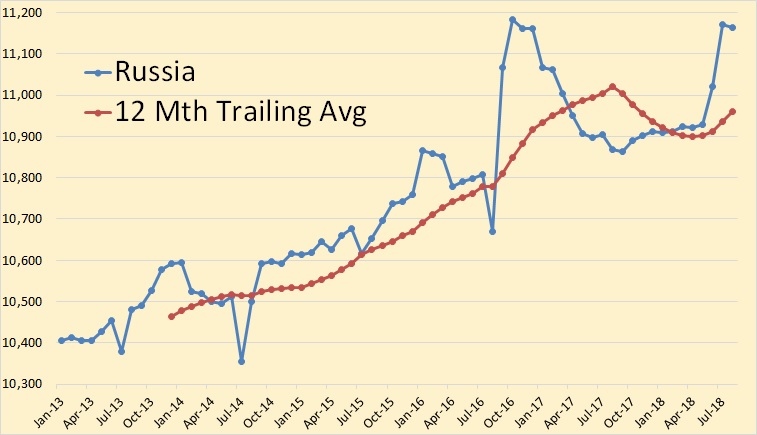
Data for this chart is from the Russian Minister of Energy and is through June. Russian production was up 89,000 bpd in June.
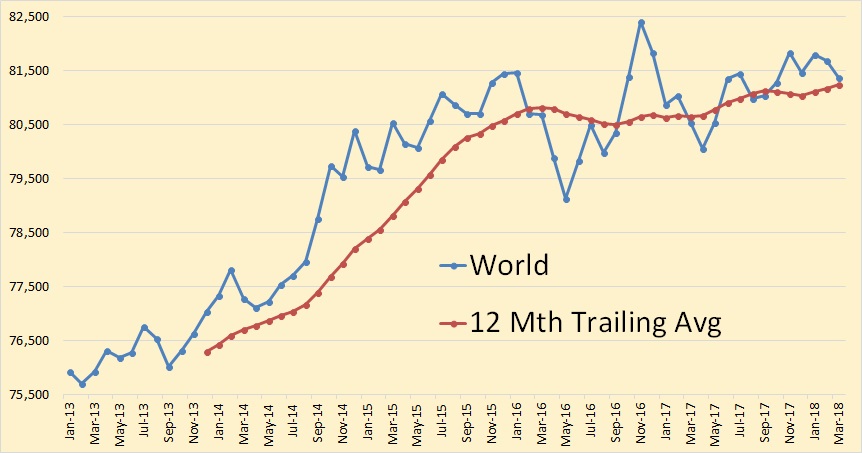
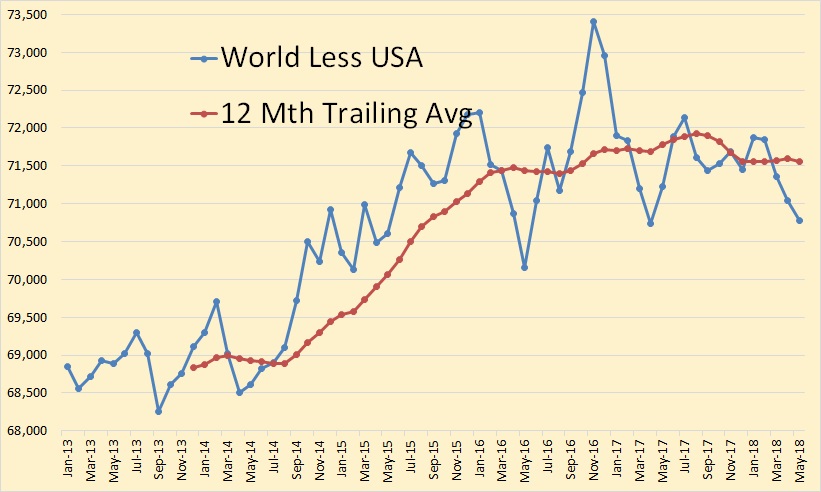
World production through March. World C+C production was down 305,000 bpd in March.
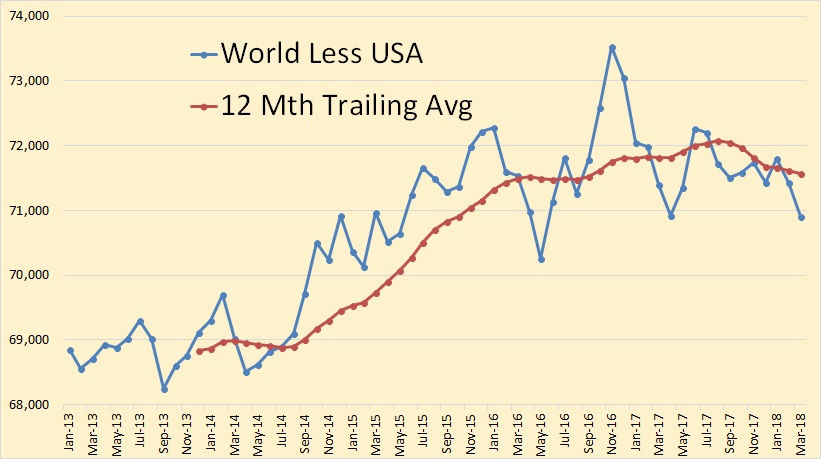
World less USA through March. Without the US input, World C+C would have been down 520,000 bpd in March if the EIA’s figures are correct.
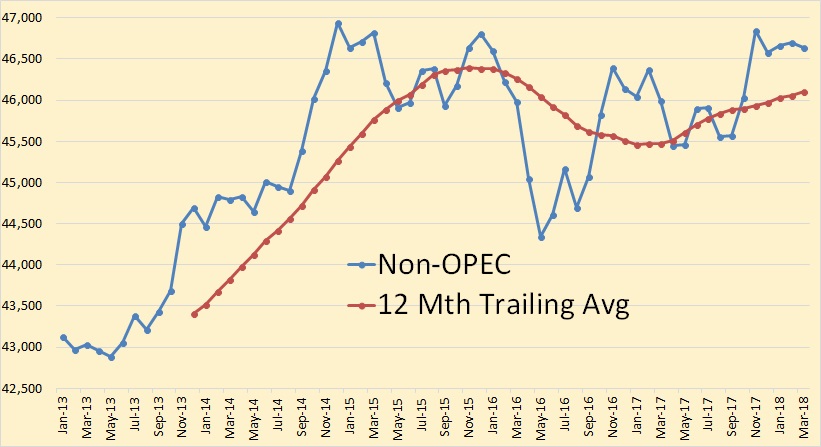
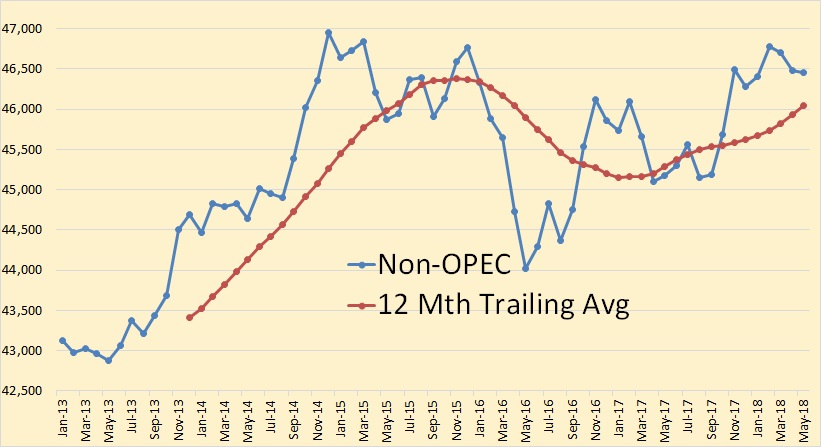
Non-OPEC production was down 63,000 bpd in March.
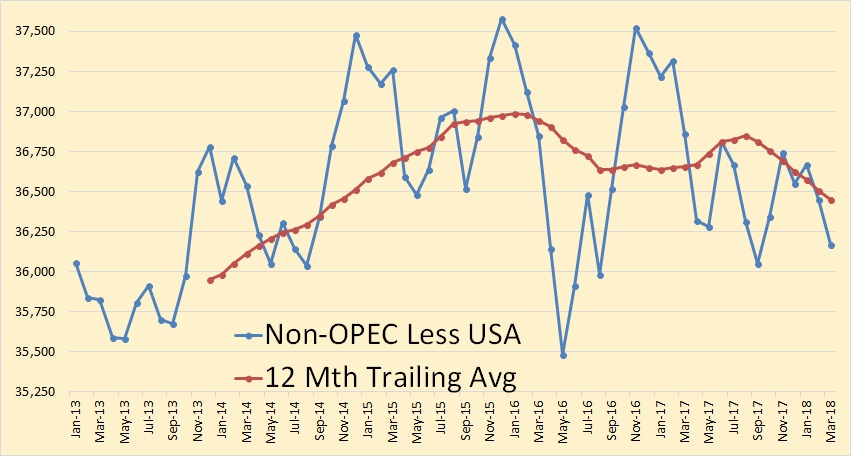
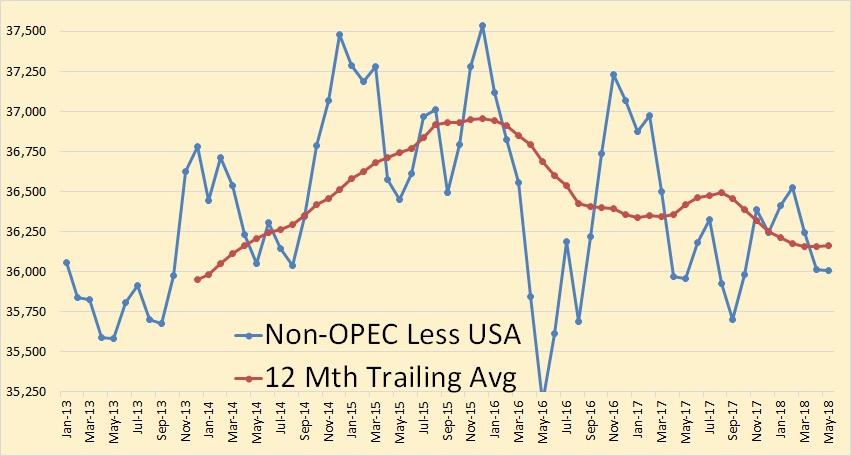
Without US production Non-OPEC would have been down 278,000 bpd in March.
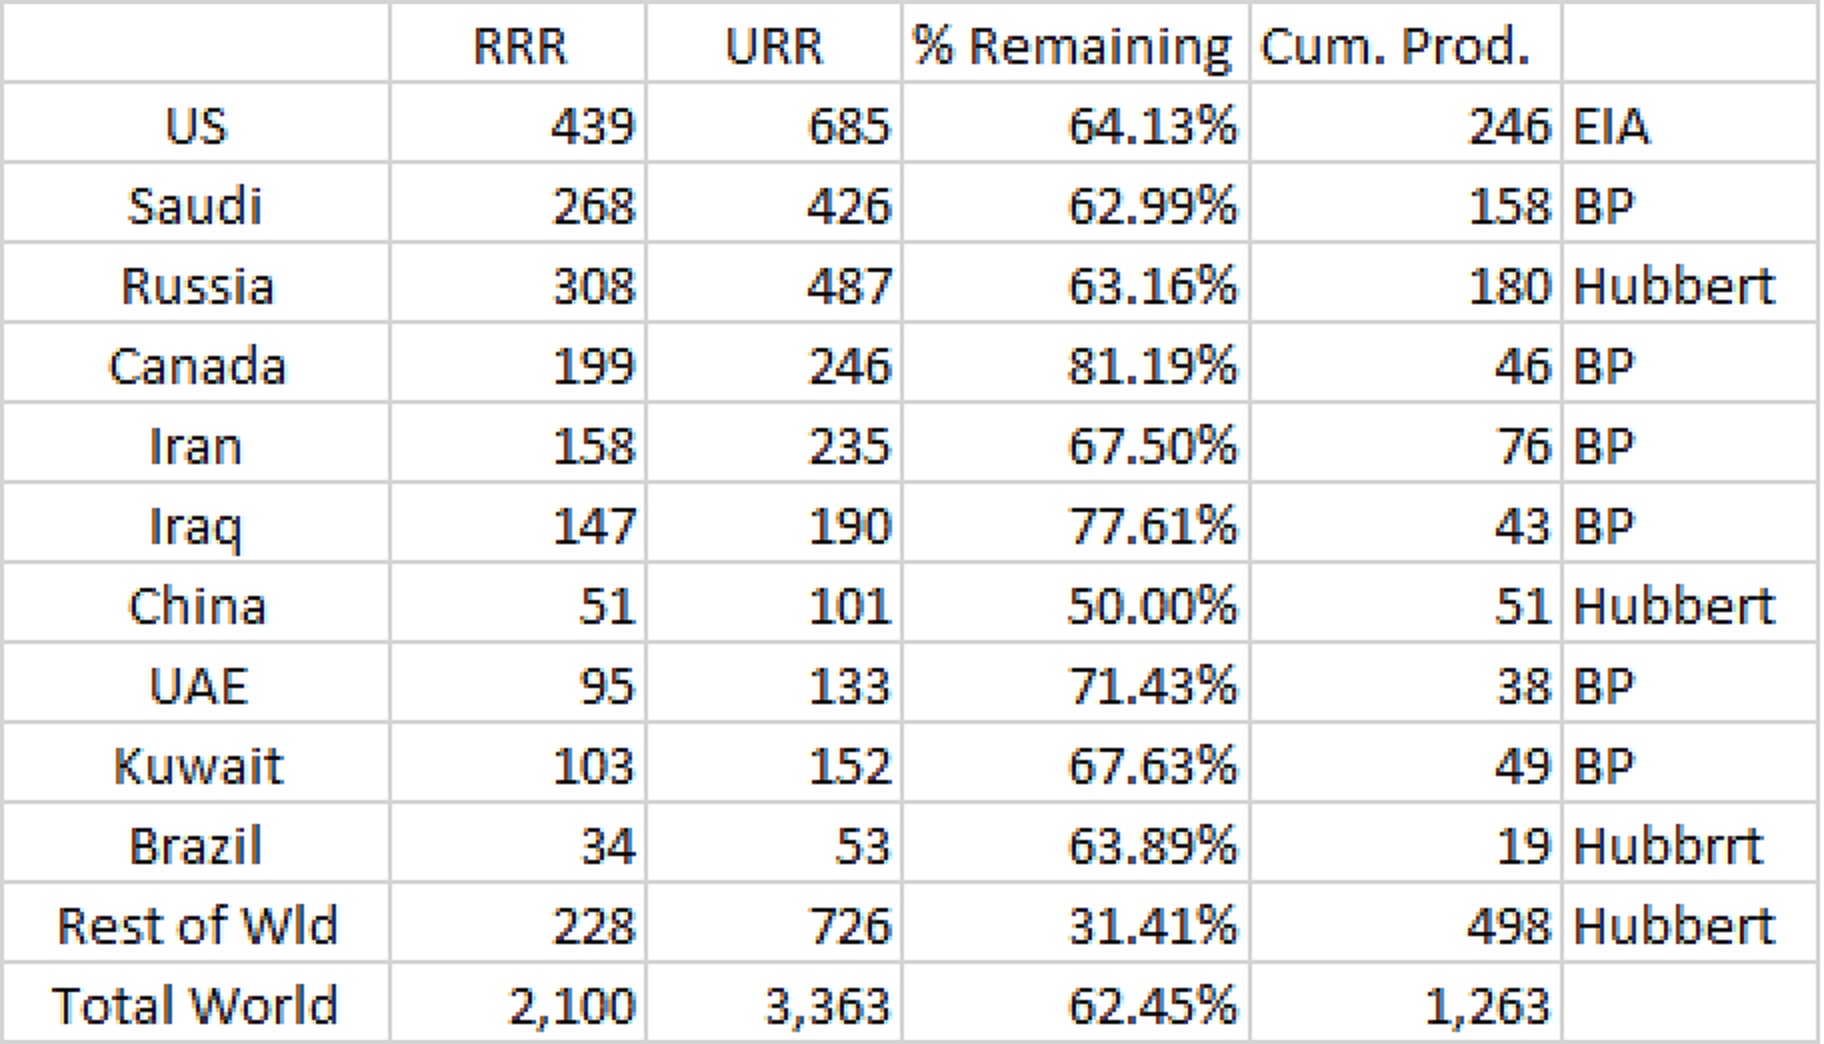
I don’t do natural gas or coal but I do have a few comments on his oil numbers. In the table below I have converted metric tons to barrels using 7.33 barrels per ton. All data is in billion barrels. I have calculated cumulative production by subtracting RRR from URR. Even though their estimate of URR may be highly inflated, and I believe it is, this makes no difference because they calculated RRR by simply subtracting cumulative production from their estimate of URR. I simply reversed that process.
All data is crude plus natural gas liquids. Of course, that includes condensate.
I think the EIA data for the US is highly inflated. They are grossly overestimating the input from shale oil here. The BP data for OPEC, obviously what BP has done here is just to take each OPEC nation’s word for their reserves. I have no comment on their Canadian numbers.
The Hubbert Linearity method was fairly accurate before the age of creaming. As long as conventional wells were used, the Hubbert method gave you a pretty good estimate of URR. And you could also calculate the probable decline rate with the Hubbert method. But no more. A field is creamed by massive infill drilling with horizontal wells that skim the very top of the reservoir. The decline rate is then drastically reduced while the depletion rate is drastically increased. Things will go just great until the water hits those horizontal wells at the top of the reservoir. Then production will drop like a rock.
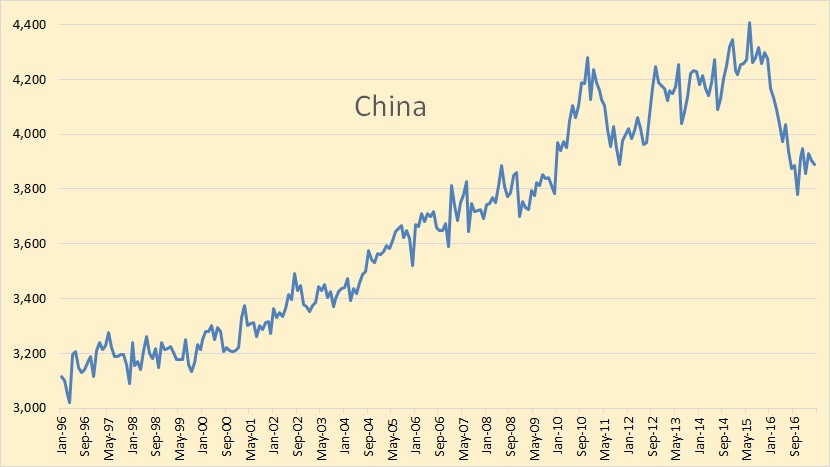
The field has produced more than 15 billion barrels since operations began in 1960. Last year’s annual production was around 290 million barrels, though that should fall to around 234 million barrels by 2020, the employee at PetroChina said in an interview published Sunday.
In 2015 Daqing produced about 800,000 barrels per day. If it were to produce 234 million barrels in 2020 then that would be about 640,000 barrels per day or a decline of about 160,000 bpd. Looking at the chart below I think those figures are extremely optimistic.
China’s production has dropped by over 400,000 barrels per day in the last three years. And the lions share of that decline has to be Daqing.
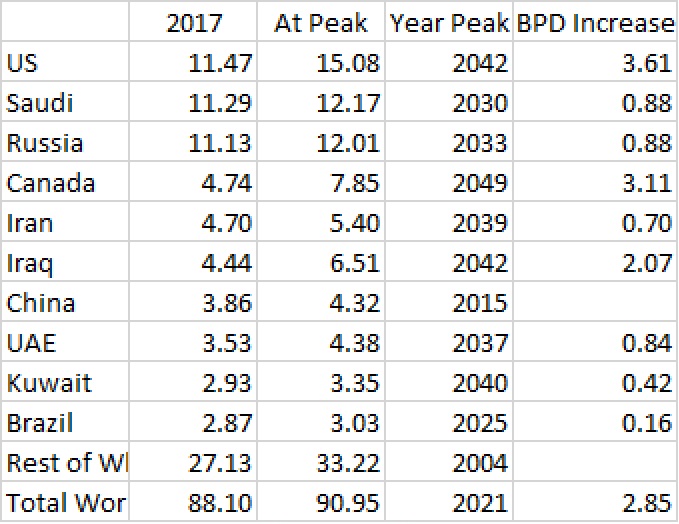
In the table below I have converted the data Dr. Minqi Li presented in metric tons per year to million barrels per day. Again, this is C+C plus natural gas liquids.
The source for this chart is the same as the table above. I believe due to OPEC massively inflating their URR, and the inaccuracy of the Hubbert method due to the creaming of all giant fields, the expected peak dates here are highly inaccurate. Well, all except three. The rest of the world did peak in 2004, China did peak in 2015, and the world will peak by 2021 or before. Congratulations to Dr. Minqi Li, the most accurate future peak there is the one that he calculated.
Here are the latest oil production numbers from the EIA. All data is in thousand barrels per day unless otherwise noted.
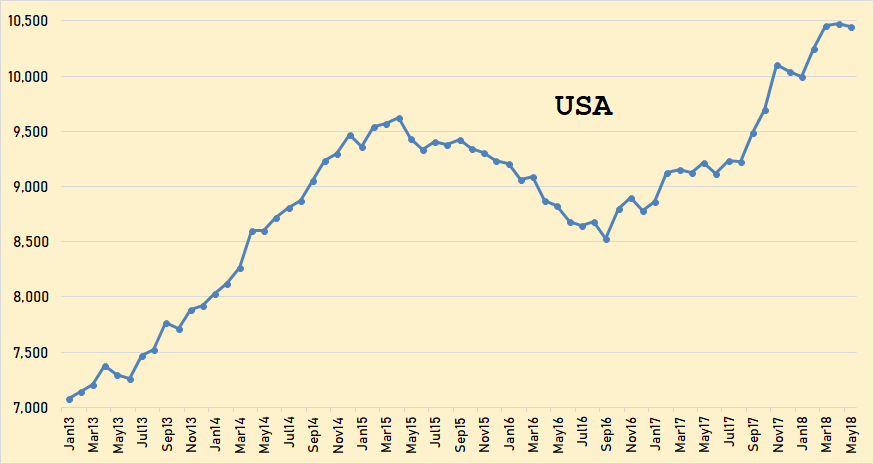
The USA through May 2018. The upward surge has stalled for the last two months. US production was down 30,000 bpd in May.
It is a little astonishing how close the Texas chart resembles the USA chart. Texas is, by far, the USA’s largest producer. As Texas goes, so goes the USA. Texas production was up 20,000 bpd in May.
North Dakota production has increased significantly in the last two months. They were up 67,000 bpd in April and up another 25,000 bpd in May.
Gulf of Mexico production was down 99,000 bpd in April and down another 75,000 bpd in May.
Alaska was down only 1,000 bpd in may but that was 12,000 bpd lower than last may. They are now entering the maintenance season. Expect huge drops in June and July.
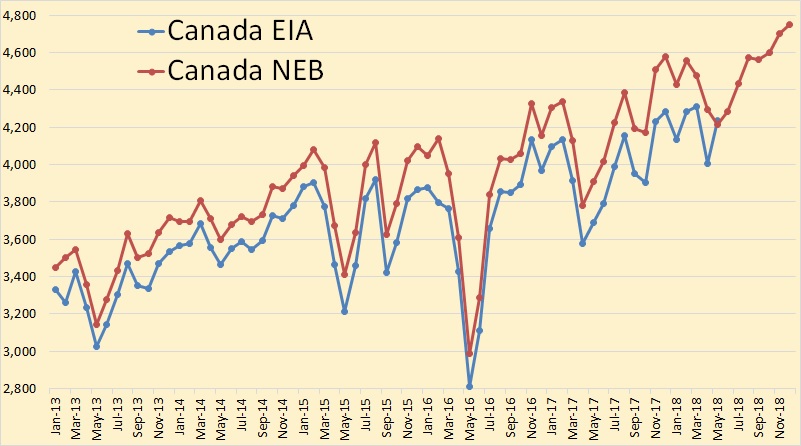
The EIA data in this chart is through April and the National Energy Board data is <b>estimated</b> through December 2018. The EIA data is usually lower than the NEB data but they both agree on April production.
World crude oil production was up 326,000 bpd in <b>April.</b>
Non-OPEC production reached a new peak in April, up 405,000 bpd to 47,159,000 bpd. Most of that increase was Canada, up 317,000 and the U.K., up 111,000 bpd.
Here I am adding a few charts and comments from ExxonMobil’s 2018 Outlook for Energy: A View to 2040. Their text is in italics. Any bold in their text is mine.
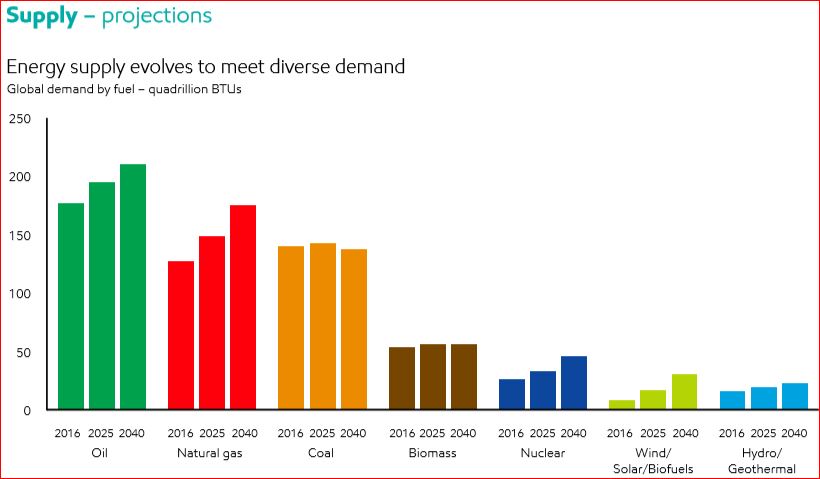
• Technology improvements lead to wind, solar and biofuels increasing, with a combined growth of about 5 percent per year • Non-fossil fuels reach about 22 percent of total energy mix by 2040 • Oil continues to provide the largest share of the energy mix; essential for transportation and chemicals • Natural gas demand rises the most, largely to help meet increasing needs for electricity and support increasing industrial demand • Oil and natural gas continue to supply about 55 percent of the world’s energy needs through 2040 • Coal’s share falls as OECD countries and China turn to lower-emission fuels • Nuclear demand grows 70 percent between 2016 and 2040, led by China • Wind, solar and biofuels reach about 5 percent of global energy demand
They assume that supply will always evolve to meet demand.
This is what they say we will need in 2040 and will therefore be delivered by technology.
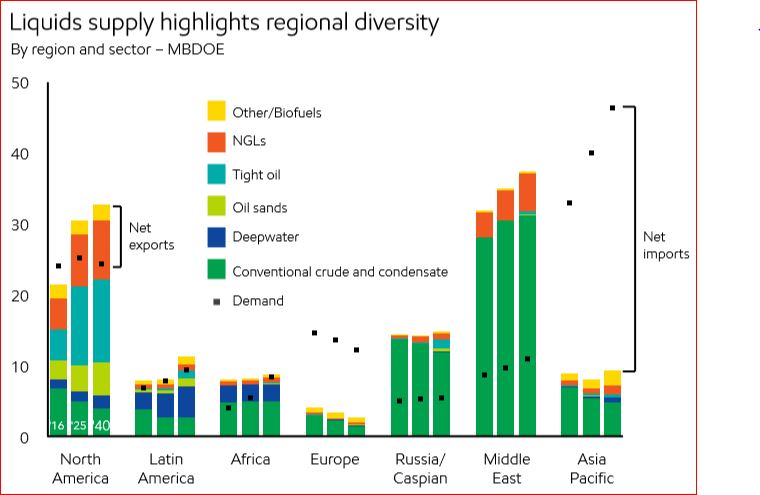
And here is where all that oil will come from. North America is the US and Canada. They count Mexico as part of Latin America. In 2040 they have total North American conventional production down to about 3.5 million barrels per day. They have at about 12 million bpd and oil sands at about 4.5 million bpd as best as I can eyeball the chart.
They have almost all conventional oil coming from the Middle East and Russia/Caspian. Caspian is mostly Azerbaijan.
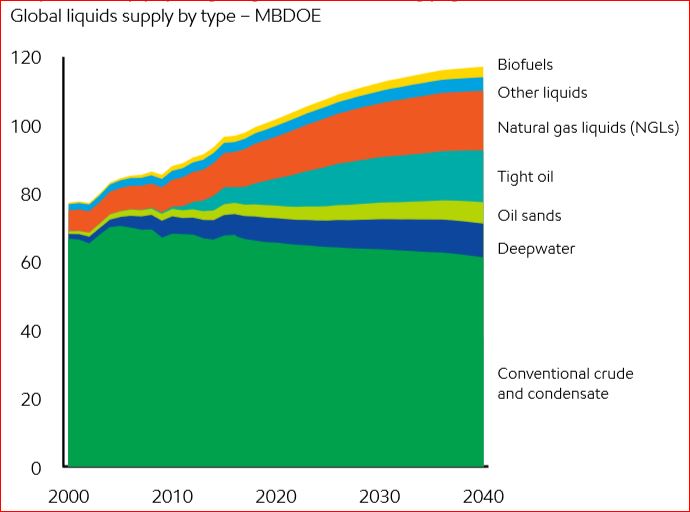
• Global liquids production rises by 20 percent to meet demand growth • Technology innovations lead to growth in natural gas liquids, tight oil, deepwater, oil sands and biofuels • Technology enables efficient production from conventional sources, which still account for more than 50 percent of production in 2040 • Most growth over the Outlook period is seen in tight oil and natural gas liquids, which reach nearly 30 percent of global liquids supply by 2040 • Continued investment is needed to mitigate decline and meet growing demand • Liquids trade balances shift as supply and demand evolve • North America swings to a net exporter as shale growth continues • Latin America exports increase from deepwater, oil sands and tight oil supplies • The Middle East and Russia/Caspian remain major oil exporters to 2040, and Africa shifts to an importer • Europe remains a net oil importer, as demand and production both decline • Asia Pacific imports increase to 80 percent of oil demand in 2040
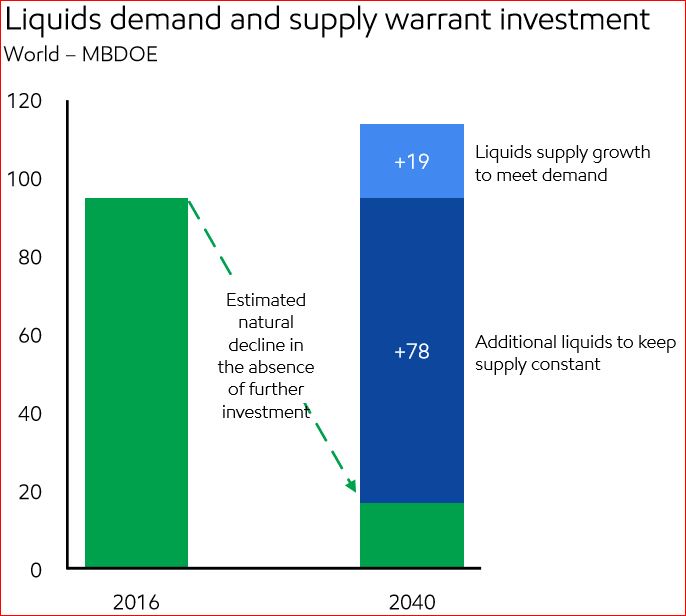
This chart is a little shocking. They have total liquids declining to about 18 million bpd by 2040 without investment. That means if everyone stopped drilling today, or in 2016, that would be the natural decline of what is online today. But to meet demand we will need 97 million barrels per day of new oil.
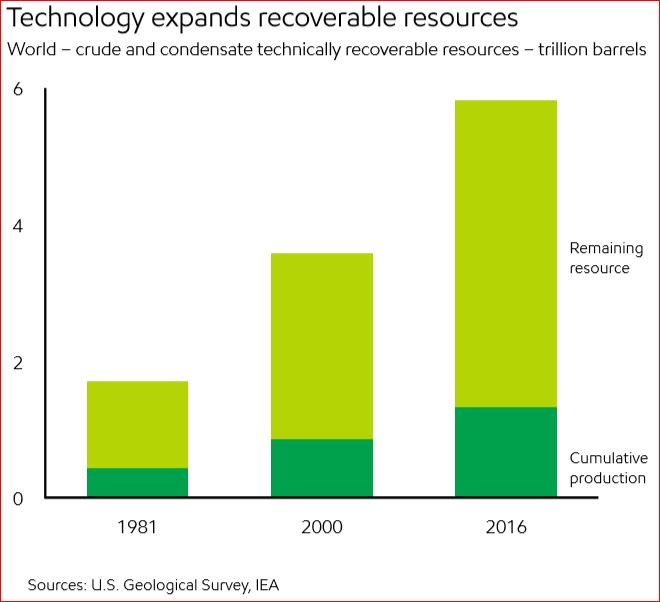
And this is what they say we have left, about 4.5 trillion barrels of remaining recoverable resources.
• Without further investment, liquids supply would decline steeply • More than 80 percent of new liquids supply needed to offset natural decline • Per the International Energy Agency, about $400 billion a year of upstream oil investment is needed from 2017 to 2040 • Global oil resources are abundant • Oil resource estimates keep rising as technology improves • Technology has added tight oil, deepwater and oil sands resources • Less than one-quarter of global oil resources have been produced • Remaining oil resources can provide about 150 years of supply at current demand
So not to worry. Peak oil will not be reached in your lifetime, or in the lifetime of your children, grandchildren or greatgrandchildren. Well, that is if these estimates are correct.
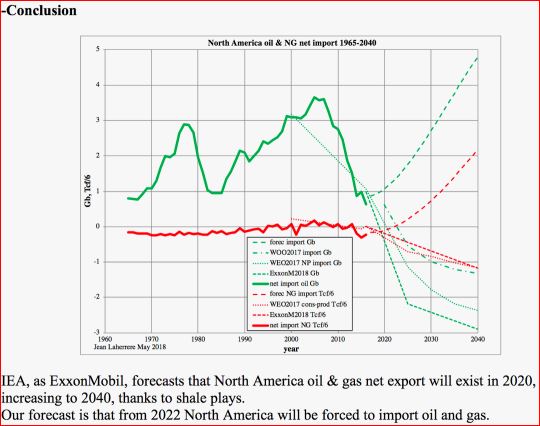
Jean Laherrere has a different outlook. He just posted me the below comments and chart. I could not get the chart to post in the comments section so I put it up here.
dear Ron
In your last good post on U.S. & World Oil Production and ExxonMobil OutlookYou mention the optimistic forecast by ExxonMobil on North America exportI sent you my last papers, which are on the site of ASPO France:
My conclusion is simple: for North America in 2040 the forecasts of EIA or ExxonMobil should change the sign of exports for oil and natural gas: instead of export it would be import.
US C+C production was up 231,000 barrels per day in June to 10,674,000 bpd, an all-time high.
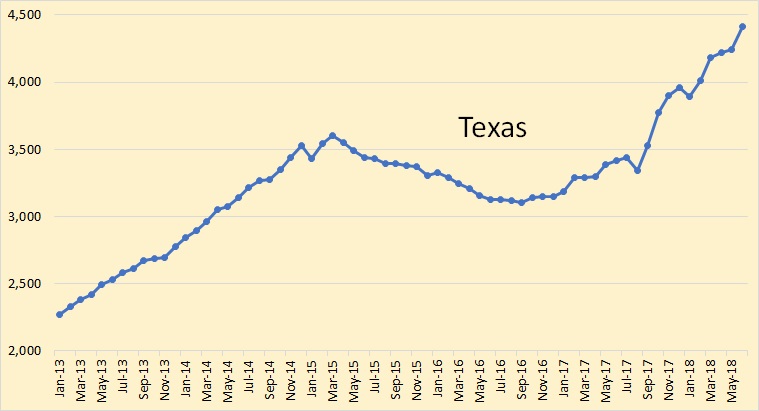
Texas was up 165,000 barrels per day in June to 4,410,000 bpd.
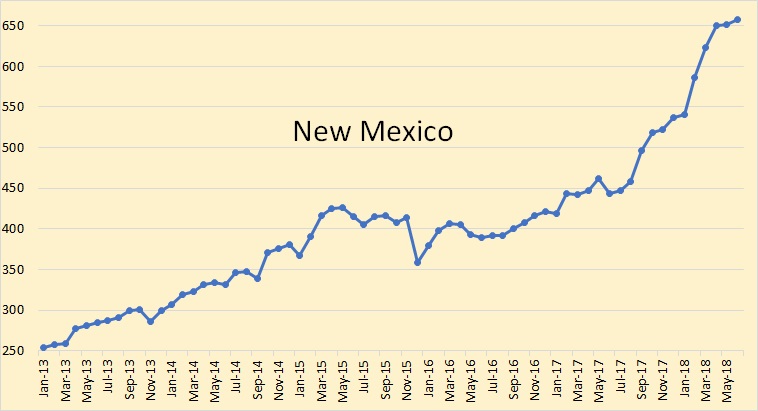
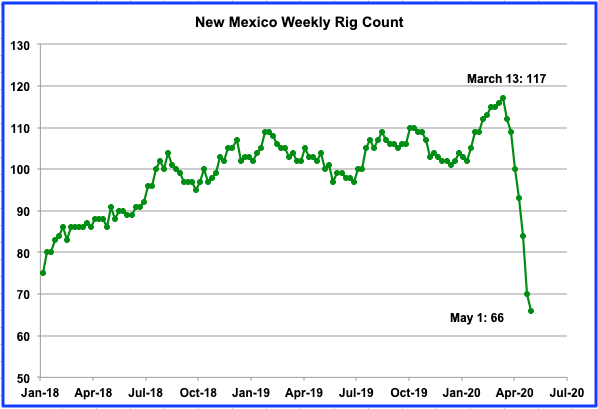
New Mexico was up 5,000 barrels per day in June to 657,000 bpd. The Permian extends into New Mexico.
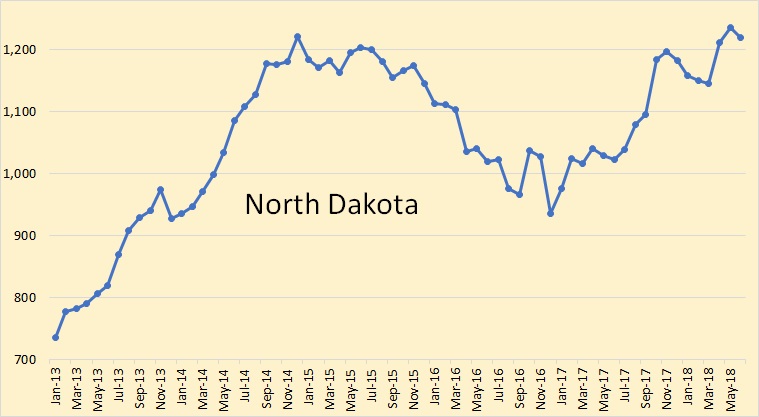
North Dakota was down 16,000 barrels per day in June to 1,220,000 bpd.
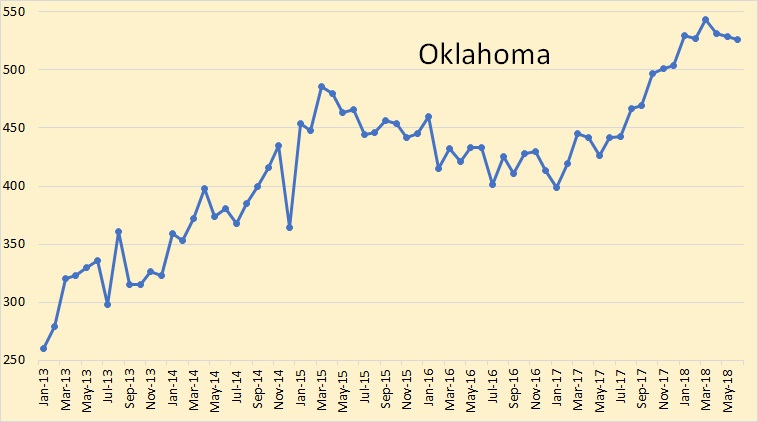
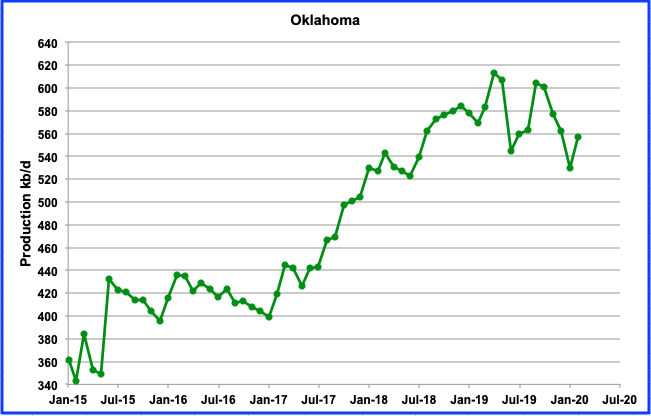
Oklahoma was down 3,000 barrels per day in June to 526,000 bpd.
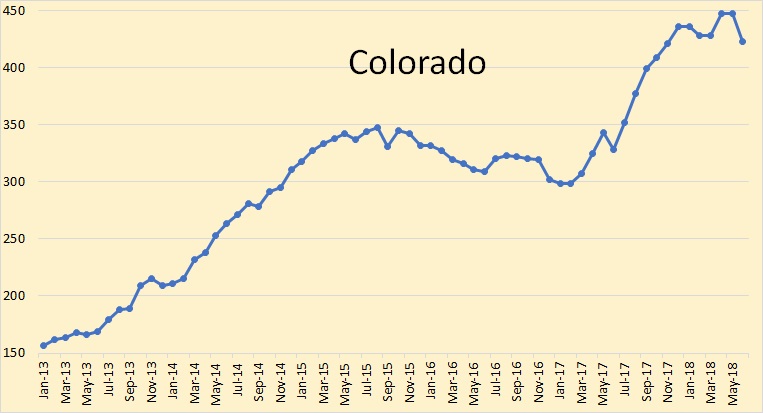
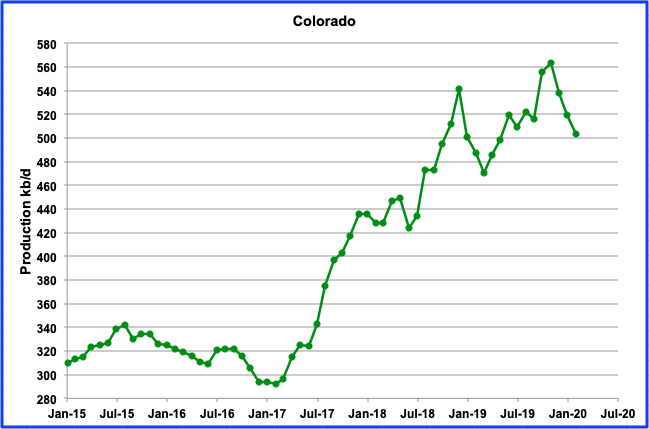
Colorado was down 24,000 barrels per day in June to 423,000 bpd.
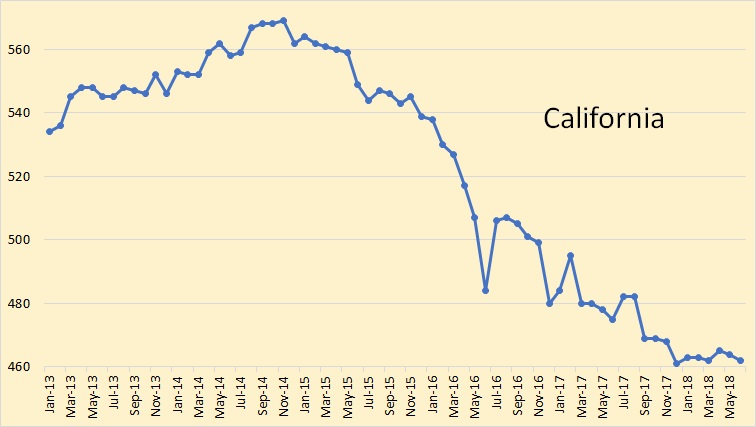
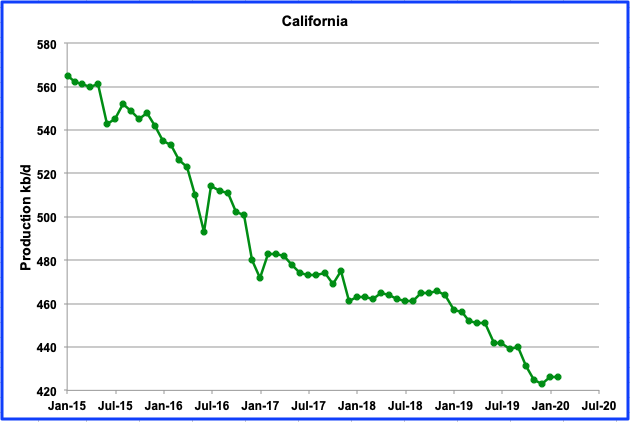
California was down 2,000 barrels per day in June to 462,000 bpd. California peaked in February of 1987 at 1,109,000 bpd.
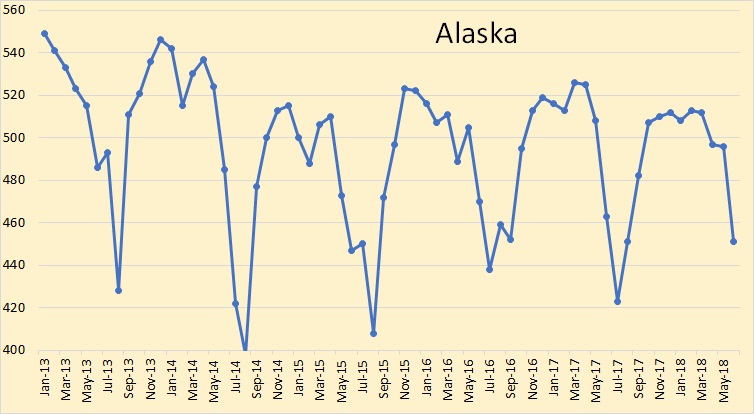
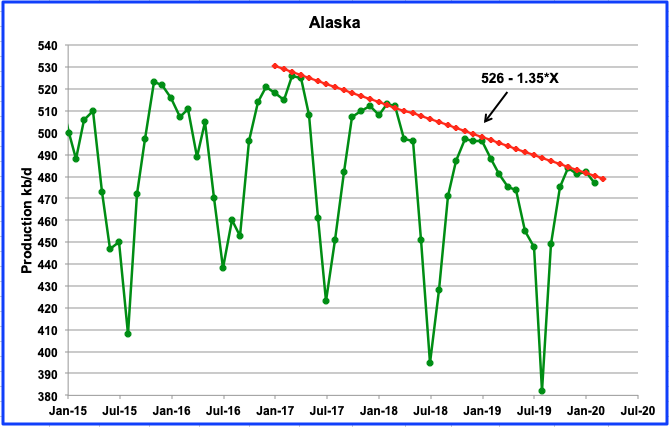
Alaska was down 45,000 barrels per day in June to 451,000 bpd. June, July, August, and part of September are the prime maintenance months for Alaska. The maintenance includes pigging the pipeline and overhauling the pumps along the pipeline.
The Gulf of Mexico was up 154,000 barrels per day in June to 1,658,000 bpd. Just a couple of years ago the EIA was predicting the GOM to be at almost 2 million barrels per day by now. I really don’t think that is going to happen anytime soon.
Using the EIA’s Drilling Productivity report for Permian production, through June, the US less the Permian, is still 357,000 barrels per day below the peak reached in April 2015. It is obvious that the Permian is the driving force behind the major increase in US production.
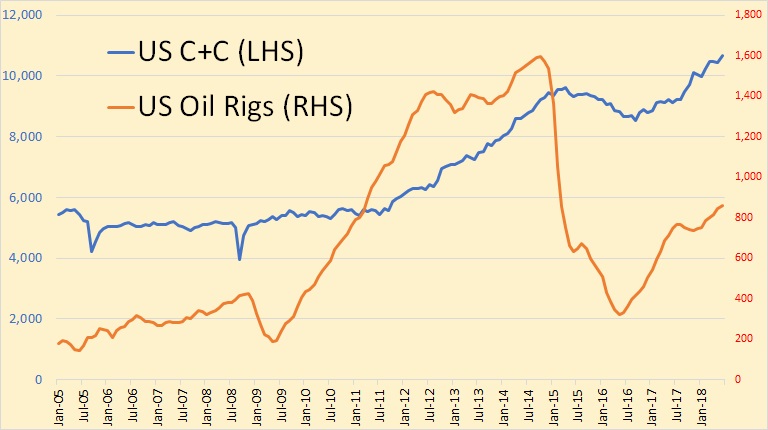
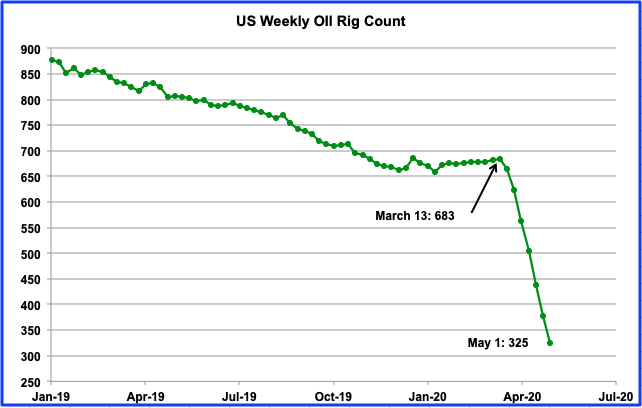
The above data is through June 2018. This is oil rigs only, no gas rigs.
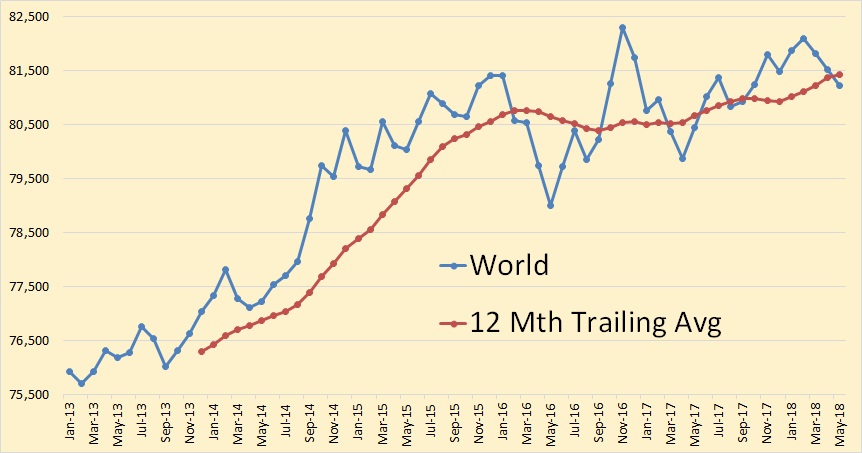
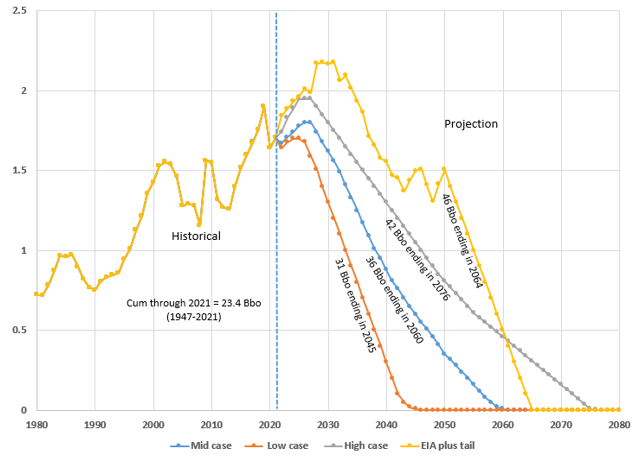
The numbers here are only through May 2018. We are obviously on that proverbial bumpy plateau. A prediction! I see world C+C production peaking around July or August, remaining level to slightly down for about two years, then begin a steady decline.
It all depends on the USA. The US, and to a lesser extent Canada, are the only nations that are still really growing by any significant amount. The US has increased production by 1.6 million barrels per day in the last 12 months, June 17 to June 18. Total world has increased less than half that amount.
Non-OPEC is half a million barrels below its previous peak of December 2014. It may breach that peak later this year, but not by much.
Non-OPEC less USA is 1.5 million barrels below its previous peak of December 2015.
Canada EIA through May with Canada’s National Energy Board’s projection through December 2018.
China has slowed its decline somewhat.
The United Kingdom has, for now anyway, completely halted its decline.
Norway… well that’s Norway.
Mexico, for the time being, has slowed its decline.
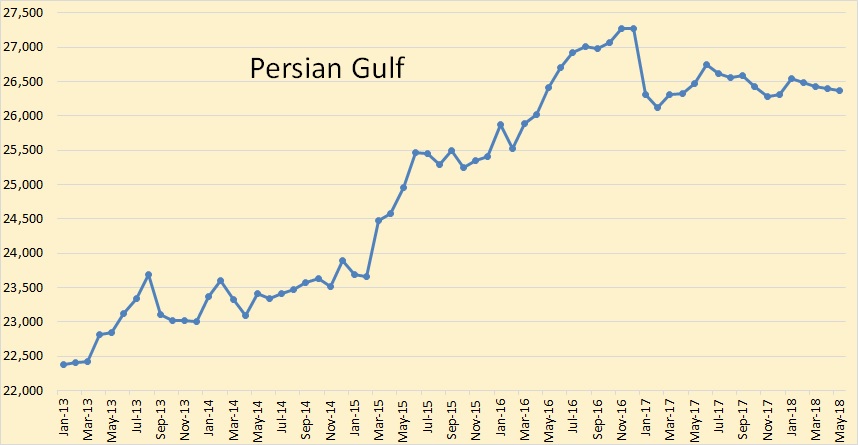
This is the EIA’s estimate of all Persian Gulf production. That includes Saudi Arabia, the UAE, Kuwait, Iran, Iraq, Qatar, Bahrain, and Oman. This is through May. There will be a slight uptick in June, July, and August but will not likely breach the previous high in November and December of 2016.
This is Russia through August 2018 from the Russian Minister of Energy. They are now back to the level they reached in the last quarter of 2016.
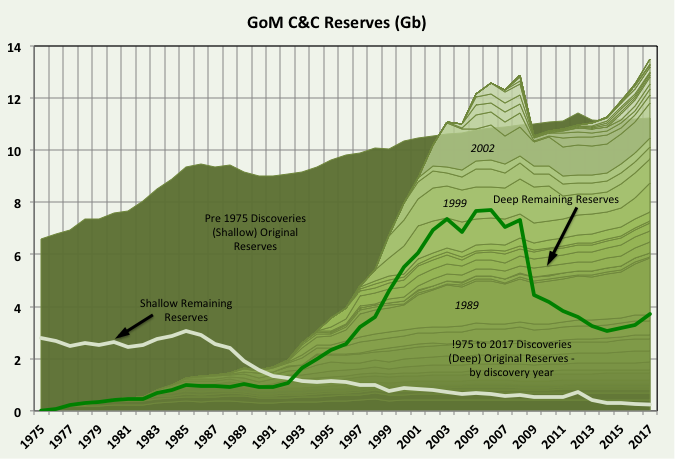
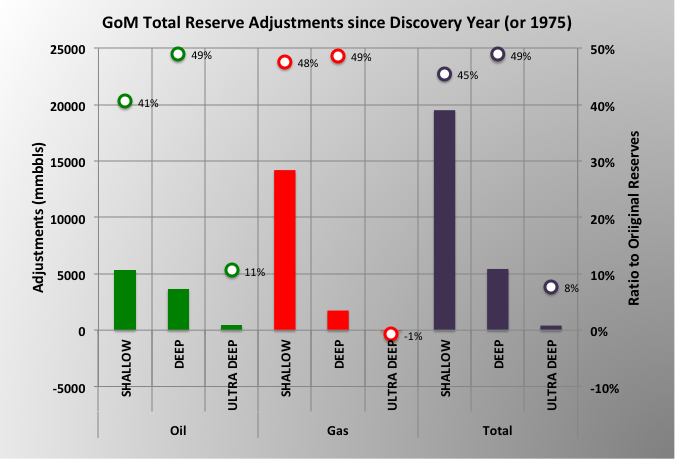
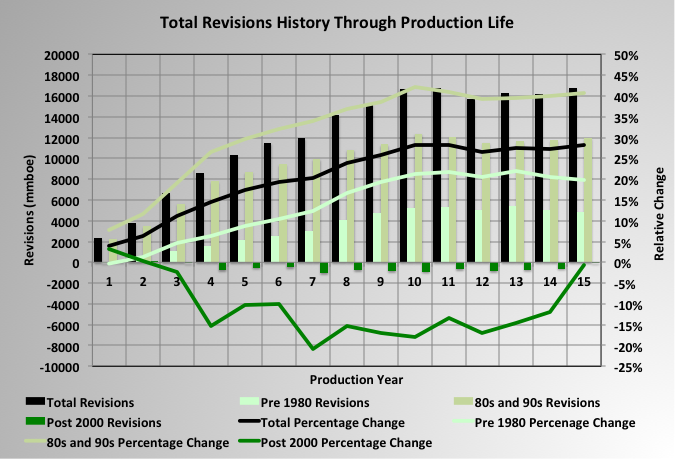
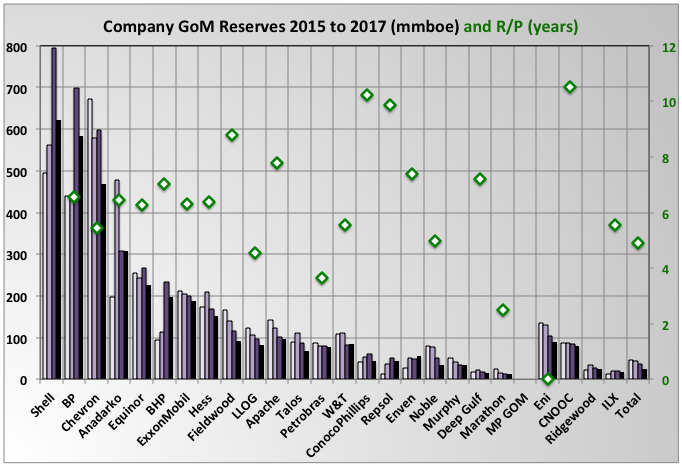
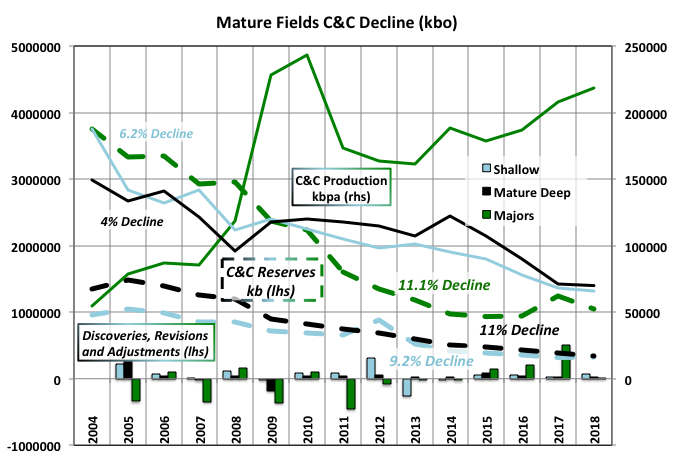
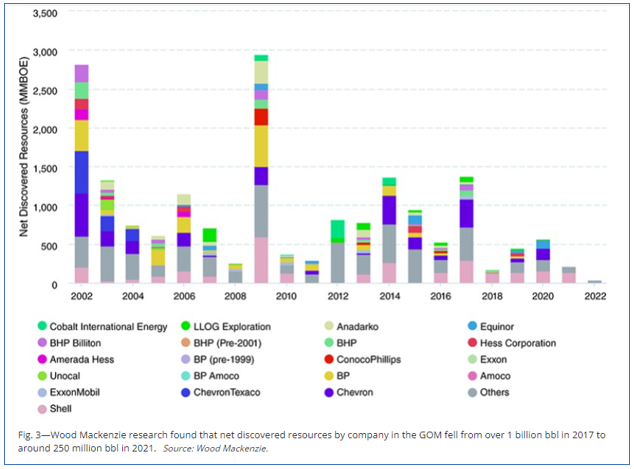
BOEM remaining C&C reserve estimates for GoM increased by 649 mmbbls for 2016 (i.e. to 31st December 2016). This was 112% reserve replacement and followed a similar growth of 618 mmbbls (111% reserve replacement) for 2015. The BOEM reserve calculation method appears to give highly conservative estimates. The increasing reserves followed several years, from 2006, of less than 100% reserve replacement, and actually negative numbers in 2006 and 2008. Current total original reserves (i.e. ultimate recovery) are a new high beating 2006 values, though deep water numbers are still below that year with the main growth appearing to be coming from: 1) older fields that were downgraded because of changes in SPE rules in 2007 (i.e. that reserves could only be booked if there were clear plans for their development within five years); and 2) newer discoveries, mostly smaller fields that are developed through tie-backs to existing hubs. These newer fields often do not get shown as new discoveries because BOEM records production and reserves against leases and each lease is recorded against a single field, even if there are deposits of different depth, age, geology and significant spacial separation within in it.
Current oil reserves are 3.569 Gb, which is 15% of the estimated original reserve (aka ultimate recovery). BOEM give the reserves as 2P (i.e. proven and probable) but they look very conservative and are actually lower than the EIA numbers, shown below, given for proven only and based on the operators own numbers, although the two are converging. The historical reserve histories look closer to how 1P (proven) numbers often appear, for example with some fields maintaining near constant R/P numbers, some showing large early drops that then come back over time, and some numbers being suspiciously low on fields obviously not near run out production rates (e.g. Mad Dog and Son of Bluto 2). I think the reserve calculations methods are fairly basic, given the amount of work required they couldn’t be much else, and use volumetric methods (i.e. reservoir area, depth, porosity, recovery factor) and previous decline data (I don’t now if the operators give them additional data such as well pressures).
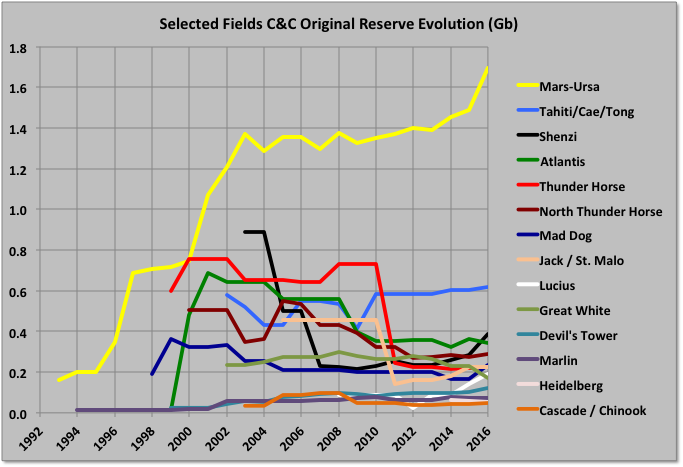
Reserve Evolution History
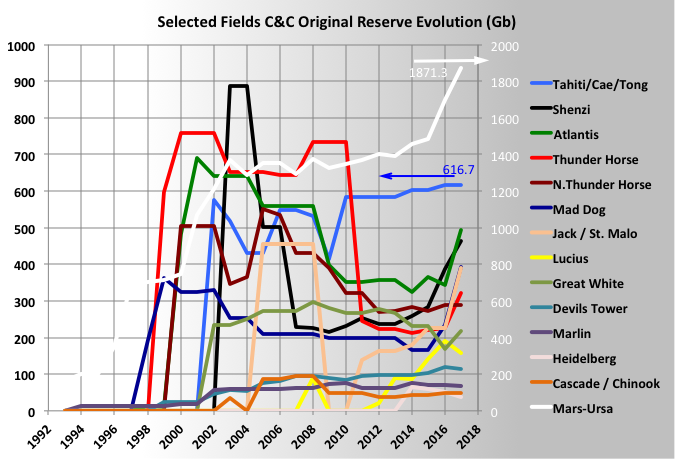
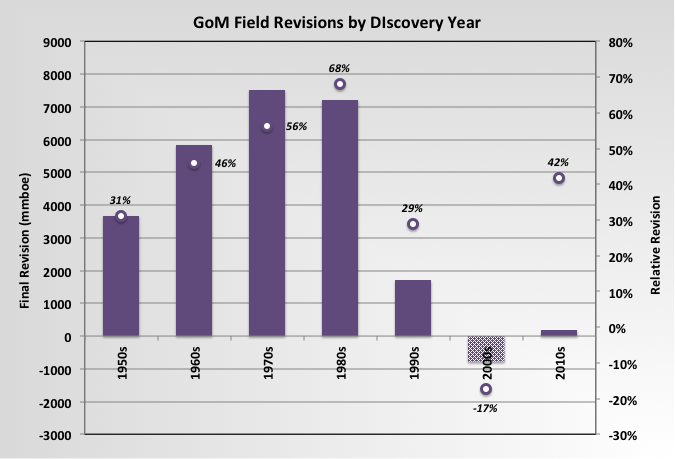
The Mars-Ursa fields have big original reserves, which have shown continuous growth. Other, large deep-water fields have mostly shown negative revisions from original reserve estimates, some quite large, though some of that is due to development timing (e.g. Mad Dog II reserves, when added, will likely recover all the earlier drop, and more). Shenzi has grown recently, and Atlantis will next year, both from new near field discoveries.
Individual Fields
The largest upward revisions in remaining reserves were for Shell’s Mars-Ursa field, which more than doubled the numbers (allowing for production). I think most of the gains came from new satellite fields at West Boreas and South Deimos, which are now on production, and possibly Kaikias, which has recently been started up. Other big gainers were Mad Dog, which had a very low number previously last year, and Shenzi, where BHP have made discoveries at Caicos and Shenzi North in the same lease blocks.
The largest downward revisions in ultimate recoveries were for Atlantis, Great White and Rigel. BP recently rescinded its lease at Rigel, which may be related, and the LLOG leases showed rapid decline rates before they went off line (presumably temporarily) because of the subsea manifold failure at Delta House. Great White has been gradually reduced in size by about 40% over the last ten years. Atlantis had a big write down in reserves after start-up, but BP announced a 200 mmbbls addition to resources in the area last year through new seismic technology, which is due to be developed in 2020 and presumably will be added in the next reserve numbers (in the mean time it looks likely the existing Atlantis wells will decline quite quickly).
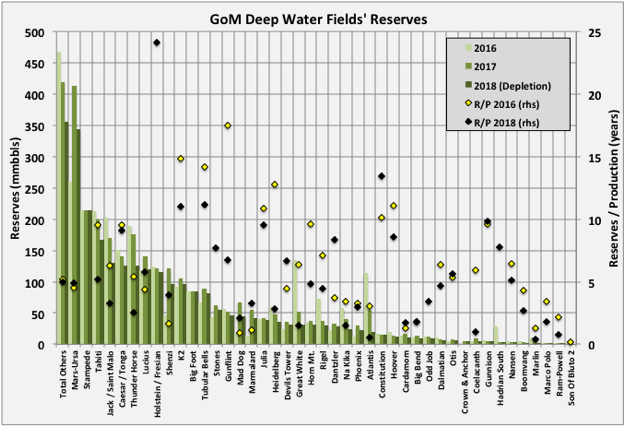
In the chart above the 2016 and 2017 reserves are the BOEM remaining oil reserves from the two latest estimates. The “2018 Depletion” data is the 2017 numbers less the 2017 production for that field, and the fields are ordered by that number. The R/P numbers are end of 2016 reserves divided by 2016 production, but for 2018 are the 2017 reserves less 2017 production divided by that production (to get the 2017 number add one to the R/P shown). Many R/Ps for the larger fields are in the range 4 to 6 years, which is equivalent to depletion rates, and therefore declines in exponential type well profiles, of around 16 to 25%, and that what has been typically seen recently. There are some very low numbers on fields with quite respectable production still, which probably indicates the reserves aren’t including some recent discoveries or revisions; for example Marlin has had recent tie-backs from Dorado and King fields, and Son of Bluto 2 (I don’t know what is happening there, it seems to be cycled now but in June cumulative production exceeded the recent BOEM original reserves estimate).
Caesar / Tonga and Tahiti are really a single field and BOEM report them as such, but it is spread over different leases and production is reported separately so I’ve prorated the numbers based on production.
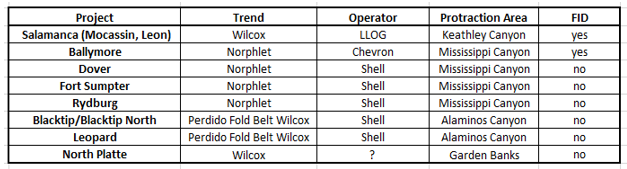
The only two newly named fields for 2016 are small: Crown & Anchor at 5 mmbbls and Calliope at 2 mmbbls. Crown & Anchor production started through two wells in June and is likely to show fairly steep decline and a short life, maybe similar to Son of Bluto 2, also operated by LLOG. Similar small field tie backs are planned by LLOG for Claibourne, Red Zinger and Blue Wing Olive, though BOEM had no reserve numbers for these yet.
Hadrian South showed big relative downward revision, but still not enough as the field died without producing what was estimated (the difference in the natural gas estimates was much more marked than for condensate shown in the chart), I think some of the oil reserve shown is actually for Hadrian North and may now be shown against Lucius. The small Lena field showed an upward revision but actually has now been shutdown after no further production. Other, older fields showing significant growth were Who Dat, where subsea pumping is planned, and Crosby, I don’t know why but it is associated with Mars-Ursa and has production of only a few thousand barrels per day (the latest reserves and average 2018 production give it an R/P of almost 100 years).
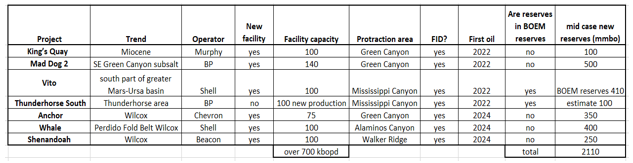
Appomatox and associated fields were approved for development by Shell in 2016 so I’m unclear why they have not been included in the reserve numbers, presumably they will be added for 2017. The Mad Dog II project was approved last year, so that too should be added as well as the new Atlantis finds, therefore the replacement ratio should again exceed 100%, probably by more than the 2016 additions. After those there is Vito, approved this year, but then things will start to get leaner
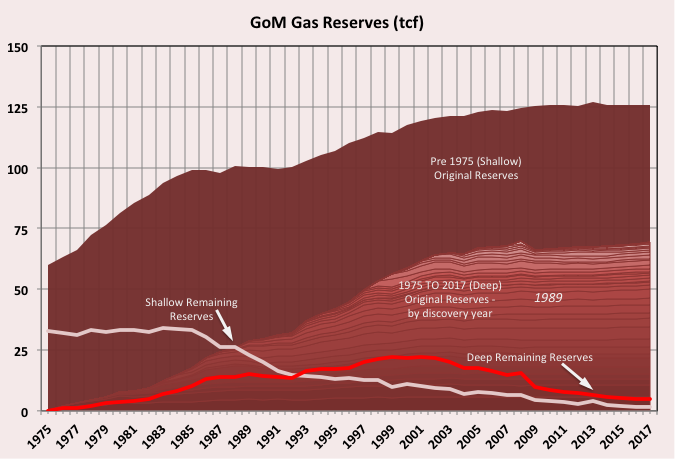
Natural Gas Reserves
Natural gas original reserves are pretty much flat and remaining reserves are declining in line with production but with some revisions to associated gas numbers in line with changes to the oil numbers. I think there might be a bit of a downward revision next year because BOEM still carries a relatively large value for Hadrian South, which died mid 2017 without producing anything like the reserves given. There are still a few deep-water gas fields – Otis, Baldpate, Na Kika – but not much drilling, either for exploration or development, though Na Kika has a new tie back, Coulomb II, this year and Otis is having some activity (but is currently off-line due to the Delta House subsea failure).
Having said that the GoM, especially the shallow water area, was a pretty big gas resource and still produces significant amounts.
BOEM and EIA reserve estimates for gas agree much more closely than for oil. The chart shows that the non-producing reserves (i.e. mostly undeveloped associated gas) are relatively small now. A large proportion of the difference between BOEM and EIA are likely in these – e.g. for Vito, and Appomatox.
A Mature Basin
As well as the reserve curves given above leasing and drilling activity and recent discovery successes all indicate the GoM is a late stage mature basin for both shallow and, increasingly, deep-water areas. Actual production is possibly behind on the decline slope from where it might be expected, partly because the basin has been developed in three cycles: shallow, deep and ultra deep with some issues for the ultra-deep production because of technical issues in developing some uHP/HT fields (for example requiring 20 ksi wellheads and blowout preventers); but more because of the delays caused by hurricane damage in 2005 and, mostly, the drilling hiatus following the Deep Water Horizon accident in 2010.
Leasing
The remaining available exploitable acreage in the GoM is being offered for lease in approximately equal sized tranches every six months until March 2022. The sales so far made have been fairly consistent with about one percent of the land being leased (this compared with about eight percent average on the more prospective areas in earlier leases – the dashed green line shows the running average) and fairly modest bid prices. Some areas previously under moratoria may attract more attention but, equally, the most attractive areas are probably being offered first so interest levels may decline further.
Discoveries
For the BOEM numbers discoveries are shown only if they are counted as reserves in the 2016 assessment. The recent drop off is not as severe as shown as: 1) there are a few likely discoveries still under appraisal before a final investment decision is made, 2) there have been a few approvals in 2017 and 2018 not included in the numbers shown which will get backdated once approved, and 3) as stated above, because reserves are booked against leases rather than fields, a number of significant recent discoveries get backdated to appear as reserve growth against the nominated field for a lease rather than later discoveries. The EIA discovery numbers, shown from 1986 for oil and 1990 for gas, give a better picture as they are by field, but they only show proven numbers and are not corrected with backdated revisions. The Mars-Ursa field highlights the difference in the approaches: the original 1989 discovery was relatively small and the big additions came from new fields in 2002 and after 2010 (as evident in the BOEM reserve history chart shown earlier). However using either EIA or BOEM the overall decline in discoveries since the 2000s is quite pronounced, and it will be interesting to see if high oil prices reverse the trend, the continued low level of exploration drilling (below) suggests not yet, if ever. The chart also shows the discoveries moving from shallow (less than 1000 feet) to deep to ultra deep (greater than 5000 feet). There might be some more shallow to come from sub-salt or newly leased areas, and there are still potential near field prospects for deep water, but ultra deep is the most likely area for expansion.
Drilling and Lease Development
Overall the number of open qualified deep-water leases available for new development is now pretty low. I think maybe only about fifteen that are not associated with producing fields, including North Platte, Shenandoah and Khaleesi / Mormont (Kings Landing) for LLOG, and the HP/HT fields at Anchor and associated with the Tigris hub for Chevron (there also are very small fields like Ourse, Mudbug and Calliope). No new leases have been added this year so far, though there have been a few reported recent discoveries, like Whale, Ballymore and Dover.
The North Sea is another mature (almost superannuated) basin. For the UK sector its late life is characterized by many small developments, usually tie backs; the GoM is more like the Norwegian sector with relatively fewer tie backs, and many of those recently being developed, but some major large projects still to come: for Norway Johan Sverdrup and Johan Castberg, and for the GoM Appomattox, Vito and Mad Dog under development, and Anchor, Tigris, Shenandoah, Kings Landing, North Platte and possibly others still to come. Most of these fields are technically and economically challenging because of high temperatures and pressures, difficult wells, and reservoir issues that can lead to low recoveries, and generally will have overall development times from discovery of more than ten years. Appomattox will be the largest development in the GoM, it has design nameplate of 175 kboed but Shell is already talking of debottlenecking to around 240.
I get the impression that the big four players – Shell, BP, Chevron and Anadarko – each have their main aim as maintaining an overall area production plateau, and that means accelerating the opportunities they have to compensate for high (and maybe accelerating) decline in their existing developments. The smaller players have mostly lost that battle now, with BHP joining them this year and expecting around 6% overall decline and Anadarko probably being the first of the big four to see clear reduction next year.
Shallow water drilling activity is very low now. Deep water is steadier, although the steady drop in discoveries means that appraisal drilling has shrunk significantly this year; typically appraisal wells are successful and are eventually tied in to new or existing hubs. Exploration wells are about the same as last year and development wells slightly higher.
The creaming curves for wells in all areas clearly shows the basin is in the late life cycle (note deep wells include ultra-deep). Overall the well numbers will be slightly down on last year, which is as predicted at the start of the year. The active rig count by Baker-Hughes still shows a slightly declining trend, but part of that may be a current lack of suitable jack-ups for some drilling locations in shallow water (see Douglas-Westwood). Shell recently idled its rig on the Crosby field with six month remaining on contract and earlier in the year Anadarko cut short the contract on one of its three.
The number of wells shown as drilling or workover is dropping significantly, I think this reflects a number of previously drilled wells that have been tied in (e.g. a lot of the new LLOG production this year), though some may also be abandoned, combined with the drop in active rigs since 2016.
The current signs all indicate a continuing slow fall in activity and production. The tail maybe quite fat though as the GoM has plenty of infrastructure allowing economic small field development plus various different geological plays whose attractiveness may depend on new technology or changing cost/price dynamics. There some new activity in shelf areas looking at sub-salt prospects, and in the frontier areas nearer to the Mexican boundary, plus it will be interesting to see what the interest will be in the areas that have previously been under moratoria
Oil Production
EIA has June production at 1658 kbpd (up 157 kbpd or 10% m-o-m and 27 kbpd or 1.7% y-o-y). The BOEM number is 35 kbpd less at 1623 (a 6% m-o-m rise but 1.2% y-o-y decline). Typically the initial BOEM initial estimates are closer to the final value but EIA numbers are continually adjusted and end up matching the final well and lease data from the operators.
Spring months are traditionally when maintenance turnarounds are conducted for the major platforms. Great White field (processed on Perdido spar) and some of Mars-Ursa production was offline in April and May; Mad Dog was offline in May and part of June, Stones was offline for all of March through May. Most of those production outages have now returned. There are still some platforms and fields with lower than 100% availability (e.g. Mad Dog, Horn Mountain, Holstein, Rigel because of the Delta House subsea failure, Llano/Baldpate because of the Enchilada pipeline failure) but there always will be, so it remains a question how much production can grow further except from new wells; the coming numbers for July should show an increase on June but February might prove to be this year’s peak month.
The Stampede project continues to ramp-up, there are no actual production figures yet but it looks from the BOEM estimates to have reached about 50% of expected phase-one production so far. Some small additions in June came from the Crown and Anchor LLOG leases producing through two wells to the Anadarko operated Marlin platform.
Stampede, Lucius and Coelacanth (aka Hummingbird) have no production reported for several months and have been estimated to match BOEM total numbers.
2018 production has so far been below 2017 for every month except June, which had a high maintenance load in 2017 (and it’s likely the final adjusted number will be lower there too if the BOEM estimates prove better). It has even averaged below my projection from earlier this year, which I expected to be a median-to-low estimate, and especially so as it did not included the Kaikias development that was accelerated by about a year; plus I had not realised some of the large developments (Jack, Tahiti, Great White) hadn’t quite finished ramp-up in 2017 and maybe I relied on the BOEM reserve numbers being less conservative than is becoming apparent. I think the projection will still be lower than actuality unless the overall average availability in the second half is particularly poor (e.g. hurricanes, late year turn arounds or unplanned maintenance).
The thick black line shows what the remaining production must average to exceed last year’s average, which looks unlikely, although it should catch up a bit. The EIA STEO forecasts updated each month must be generated by some algorithm because the future figures all change each release but I don’t know how. The start is always fixed to actual production (which may later be adjusted) and I think there is some compensation to try to match the expected yearly average – i.e. lower than predicted actual monthly production tends to lead to higher later forecasts – having said that though, the September numbers show a marked drop for both this year and next, and for the first time that I’ve seen they now have this years average production below that for last, it does of course still increase again next year.
The Mars-Ursa complex, operated by Shell including two drilling and production TLPs, Mars and Olympus (Mars B), is the largest overall single producer in the GoM. The chart above shows the production by leases and fields. There has been significant production increase over the past couple of years. The West Boreas field is showing relatively rapid water breakthrough and the older leases are declining but there’s still continuous drilling with two or three rigs. Having an available platform based drilling rig for the largest fields usually results in better recoveries and longer plateaus, but can sometimes mean more rapid declines at end of life. The Kaikias development was started in May and is being ramped up, which I think will provide 40 kbpd; it will be interesting to see if that is enough to compensate for the declines in the other leases over the next year.
Two of the fields that showed relatively large increases in reserve estimate were Lucius and Marmalard, but that is maybe belied by their recent performance. Like a few recently started deep water fields Lucius wells show dramatic decline when water breakthrough starts. It’s unclear if new drilling will allow recovery of production, but it may be that the reserve increase is because of the planned development of the Hadrian North field through the platform. Dantzler, Gunflint and Heidelberg show similar behaviour following water breakthrough, and Heidelberg has had a large write down in reserves, which may mean there will be no phase II development there.
Stones looked like there was some unexpected water production initially, which has been stopped. It has not yet reached its nameplate capacity after a couple of years, its production history has been a bit erratic and it looks like it has been taken off-station recently, but there was a large increase in reserves and probably more upside potential yet as the recovery rate is in single figures. The FPSO for the field, Turritella, was supplied by, and originally leased from SBM, with Shell exercising a purchase option last year. There have been other SBM projects with operating issues (e.g. Tyr in Norway, where the platform was condemned, and Deep Panuke offshore Canada) so it will be interesting to see how the ExxonMobil FPSOs for Guyana, also to be leased from SBM, perform.
Marmalard has no water production but all three leases are declining quickly and maybe a bit faster than the remaining reserve estimates would warrant.
Natural Gas Production
Gas production increased slightly in May because of the startup of the Coulomb II tie-back to Na Kika and again in June because of the restarts from some major turnarounds. June figure is 2604 mmscfd (down 12% y-o-y). Like oil the EIA gas production number is much higher than the BOEM estimate of 2439 mmscfd (down 17% y-o-y). There is general decline, especially in the shallow fields, but the main difference with last year has been the loss of Hadrian South production.
Off Topic Finish
There are a few coots’ nests on the rivers and quays around where I live. They are fascinating to watch. From what I can see, over a few seasons now, they build a small nest in early spring (often including a lot of human litter) and have a couple of chicks (or ducklings or whatever) and then the parents go completely bonkers for about a day making the nest much bigger with each adult seemingly trying to outdo the other; hence maybe the expression “queer as a coot” – in the mad sense of the word (they are not bald so I don’t know where that one comes from). With the bigger nest they sometimes have other chicks, I think mostly in pairs, but at some time it looks like one adult and some or all of the chicks just aren’t there any more, they may get eaten but it seems too regular for that, so I think they leave for pastures new. Sometime later the remaining chicks leave, sometimes there’s a lone adult (possibly a grown chick) swimming around looking a bit lost, then it goes too. I don’t know if the same adult pair come back to the same nest site the next year and I’ve been wondering if the nest building display has anything to do with which adults leave when.
Coots are also violently territorial, especially in mating season, and give vicious pecks on the back of the head to rivals (or they might be unwanted suitors or it’s just part of playing hard to get for all I know), which sends the victims under water for several seconds and several yards of swimming to get away. But I’ve also seen adults do the same thing to chicks – they’re swimming along, the adult feeds the chick every so often then the chick takes off, often trying to fly, the adult goes after it, a bit faster, and whack, right on the back of the head, then back to feeding as if nothing has happened. I don’t know the issue there – maybe the chick takes off first and the adult is reining in some youthful exuberance, but it looks more like the chick knows something is coming and sets off to get away. I guess they are closely related to moorhens and the chicks look particularly alike with red bills that then go pure white in an adult coot. I could Google it all, but it’s more interesting watching the nuances of the behaviour and trying to work it out myself, even if I get it wrong.
All of the above is, of course just, like, my opinion man, but for something that is a fact The Big Lebowski is twenty years old and there’s a new print out in cinemas.
Here I am again reporting on out of date US February oil production from the EIA April report after the world oil environment has been turned on its head. Fortunately the EIA also has some forward looking reports that make use of more current data to provide projections for a few months out. Also the EIA has a guesstimate for weekly oil output which certainly provides an indication of the direction of production over the next month. Also there are reports on rig counts that indicate activity in oil basins and provide clues on where oil output is going. Down, Down, Down.
All of the oil production data for the US states comes from the EIAʼs Petroleum Supply Monthly. At the end, an analysis of a three different EIA monthly reports is provided. The charts below are updated to February 2020 for the 10 largest US oil producing states (Production > or close to 100 kb/d).
The May EIA report shows US production increased in February by 87 kb/d to 12,833 kb/d from 12,746 kb/d. For the lower 48 states only, production from January to February increased by 92 kb/d. From July 2019 to November 2019, output grew from 11,823 kb/d to 12,866 kb/d, an increase of 1,043 kb/d or an astonishing average rate of 260 kb/d/mth or 3,120 kb/yr. This astonishing rate begs/raises a few questions.
Is it this stunning production rate of 260 kb/d/mth that lead Saudi Arabia to call for an OPEC + meeting for March that subsequently resulted in the split with Russia which resulted in the launching of Saudi Arabia’s Shock and Awe attack on the world’s oil markets?
Will the November 2019 output of 12,866 kb/d be recorded as the new US Peak Oil date?
Will US oil companies again challenge OPEC’s market share in the future or will they be content with taking a portion of the yearly growth, when growth returns? I have often wondered where we would be today if the US had limited their production to 2/3 of the yearly demand growth and let OPEC and Russia compete for the remaining market share. US unlimited production has only led to lower oil prices along with the demise of many US oil companies and less oil in the ground for the future.
In an attempt to provide the latest production estimates for the US, above is a comparison of the EIA’s weekly and monthly production data. The weekly data is updated to the week ending April 24 and the monthly up to February 2020. While the weekly and monthly numbers are in reasonable agreement from August 2019 to November 2019, there is major divergence after that. Clearly there is some speculative oil production information coming from the EIA’s offices responsible for prediction weekly oil production. Regardless, they got the direction right for February but are 167 kb/d too high. The STEO is predicting output of 11,900 kb/d for May which appears to be where the weekly data is heading.
An indication of where US oil production is headed can be gleaned from this chart, showing the US weekly oil rig count. Data is provided by the weekly Baker Hughes rotary rig count report. From March 13 to May 1, 358 rigs were taken out of service, a drop of 52.5%. According to the Drilling Productivity report, each rig was capable of producing 730 bbls/d in April. So as of May 1, 260 kb/d/mth of new production is being shelved which will result in a very steep monthly production drop, as indicated in the previous chart.
Ranking Production from US Oil States
Listed above are the 10 states with production previously greater than 100 kb/d. This month Utah fell below 100 kb/d but will be retained for continuity. These 10 accounted for 10,371 kb/d (81%) of production out of a total US production of 12,833 kb/d in February 2020. US year over year production again exceeded 1,000 kb/d by 164 kb/d. Not shown in the table is the GOM which produced 2,023 kb/d in February and would rank it between Texas and North Dakota.
February production in Texas dropped by 5 kb/d to 5,400 kb/d from a revised 5,393 kb/d in January. There is a definite hint of slowing output in Texas.
The rig count in Texas on May 1 was down to 201 rigs, a drop 207, or 50.7%, from 408 in the week of March 18.
North Dakota’s oil production has been dropping since October 2019 however it increased by 27 kb/d in February to 1,425 kb/d.
According to this report, North Dakota is now drilling wells outside of its core areas. BISMARCK, N.D. (AP) — North Dakota’s oil production may peak within five years as companies finish drilling the most prolific portions of the state’s oil patch, state and industry officials told lawmakers Tuesday.
“Mineral Resources Director Lynn Helms, the state’s top oil regulator, said about 20% of drilling activity is now outside of the “core” areas of the western North Dakota’s oil producing region.”
“The end of (core area-drilling) is on the horizon; we can see it from here,” Helms told the Legislature’s interim Government Finance Committee.
From January to early March the number of rigs operating each week has remained almost constant as it wandered between 51 and 53 but by the week ending May 1, the number had dropped to 26.
The number of producing wells in the Bakken started to decline in October 2019 from a high of 13,555 to a low of 13,482 in January 2020. However In February there was sharp jump to 13,616. It will be interesting to see what happens in March. We can expect a sharp drop in production and drilling in North Dakota, according to this report.
“Continental Resources Inc, the company controlled by billionaire Harold Hamm, stopped all drilling and shut in most of its wells in the state’s Bakken shale field, three people familiar with production in the state said on Thursday.”
While January was the first month that New Mexico’s output declined, February resumed the upward trend. Output increased by 37 kb/d from 1,056 kb/d to 1,093 kb/d in February. While Texas has been getting all of the attention regarding its production growth, New Mexico has also increased its output and recently has exceeded the critical 1 Mb/d. On a YoY basis, New Mexico has increased its output by 232 kb/d, same as last month.
New Mexico’s production is expected to drop in March according to this report. “New drilling in the Permian Basin in southeastern New Mexico is screeching to a halt, and many producers are starting to shut in existing wells to await better times. That, in turn, foreshadows a double whammy on the state budget, as government revenue tumbles from plummeting oil prices and forthcoming production declines.”
In New Mexico, the rig count fell from 117 to 66 from the week of March 13 to May 1, respectively. This should result in a production drop starting in March.
Oklahoma output rebounded in February after declining for four months in a row. Output increased by 27 kb/d to 557 kb/d. In early January, Oklahoma had 50 oil rigs in operation. In the week ending May 1, there were 13, a drop of 37, or 74%, from the beginning of the year.
According to this report, “The Oklahoma Corporation Commission approved an emergency order on April 22 that allows oil producers to stop or reduce production without losing their leases for non-production. One Oklahoma producer who testified that he operates about 600 wells in the state said he is currently losing $200,000 monthly by producing from economically challenged wells.”
Colorado production declined by 16 kb/d in February to 503 kb/d from 519 kb/d in January. From the peak of 563 kb/d in November, output has dropped by total 60 kb/d. New environmental regulations may be beginning to take their toll on drilling activity and the resulting oil output decline. The current low oil price can only add to the drilling industry’s difficulties. However some operators have hedged their output and will continue to operate according to this report. Regardless, Colorado’s oil producers seem to resemble a tale of two cities.
“The oil and gas industry has been hit hard, including in Colorado. Halliburton and Liberty Oilfield Services have laid off workers in Colorado. Occidental Petroleum, Colorado’s No. 1 oil and gas producer, and Noble Energy, the No. 2 producer, recently announced cuts in spending and employees’ pay and hours. Denver-based Whiting Petroleum said on April 1 that it is filing for bankruptcy.”
On the other hand, “Denver-based Highpoint Resources, which operates exclusively on the northern Front Range, has not shut any of its wells. Bill Crawford, the company’s chief financial officer, said Highpoint has hedged its position in the market, meaning it has contracts locking in the price it receives for future production. About 95% of Highpoint’s production is hedged at $58 a barrel for the rest of this year.” Smart company! ???
Alaska’s output continues its slow decline as shown by its annual peak production months of November, December and January touching the downtrend line. February was down by 5 kb/d to 477 kb/d. The line continues to show a decline rate of 1.35 kb/d/mth or 16.2 kb/d/yr.
An expected 20 kb/d increment near the end of the year will mostly be offset by the estimated yearly decline of 16.2 kb/d. However, the Corona virus is causing rigs to be shut down according the this report. “ConocoPhillips is demobilizing its rig fleet on Alaska‘s North Slope to try to minimize the risk of workers contracting COVID-19, a spokeswoman said Wednesday”
California’s slow decline has taken a pause. February production was flat at 426 kb/d and had an increase of 3 kb/d in January to 426 kb/d.
Wyoming increased its output from January 2017 to December 2019 and reached a new high of 297 kb/d in December 2019. However in January and February it had two successive drops. In February 2020 output dropped by 10 kb/d to 278 kb/d. Wyoming, like other states, is being impacted by low oil prices and the virus according to this report.
“Even with an agreement in place, the demand decline has been so sharp, and so deep,” University of Wyoming economist Rob Godby remarked. “The problem is really the coronavirus. There is so much oil on the market right now, and so much to go into storage, that really the only way to slow this down is to actually shut in wells.” Shutting in productive wells can prove costly, and there’s no guarantee activity will return to Wyoming down the road, he added.
Steve Degenfelder, land manager at Kirkwood Oil and Gas, LLC welcomed the decision by OPEC to limit production, but noted the Casper-based company will still be facing challenges in the days ahead. “We have shut in some high cost production and will consider more as time goes on,” he said.
During the week ending May 1, Wyoming had 4 oil rigs in operation, down from a high of 19 during January.
Louisiana continues its slow steady decline. After rebounding from a new low output of 109 kb/d in July 2019, the decline has begun again. February output was down by 3 kb/d from January to 115 kb/d. Louisiana’s oil rig count has had a slow decline from the beginning the year to the week ending May 1. In January, 22 rigs were operating while there were 16 in April/May.
Utah’s output was holding steady since July 2019 at slightly over 100 kb/d due to its new conventional field but is now giving indications of entering a new slow decline phase. February production fell below 100 kb/d to 97 kb/d, a drop of 3 kb/d from January 2020. The last peak occurred on September 2018 at 109 kb/d.
The GOM’s output continued to rise in February and exceeded 2,000 kb/d again. The last time it exceeded 2,000 kb/d was August 2019. February production increased by 41 kb/d to 2,013 kb/d.
UPDATING EIA’S DIFFERENT OIL GROWTH/DECLINE PERSPECTIVES
1) DRILLING PRODUCTIVITY REPORT
The Drilling Productivity Report (DPR) uses recent data on the total number of drilling rigs in operation along with estimates of drilling productivity and estimated changes in production from existing oil wells to provide estimated changes in oil production for the five key tight oil regions.
This chart shows the monthly change in new well oil production and the decline from all previous producing wells for the onshore L48 states. The difference between the two gives the projected output increase for all tight oil basins.
There has been a major change in the output projections from the March to April DPR reports. The chart shows the dramatic increase in the decline rate for March and April relative to February. For April 2020, the March report projected an increase of 17.5 kb/d. The new April report has revised the March increase to a decrease of 194 kb/d. For May, the decline rate is projected to be 183 kb/d.
Above is the DPR net growth chart updated to May 2020 and shows the difference between the monthly change in new oil well production and the decline from all previous producing wells for the onshore L48 states. The April report indicates that oil production from the LTO basins and associated conventional wells has been in decline since January 2020. Output came close to no change in March but didn’t quite make it.
Above is the total oil production from the 7 basins that the DPR tracks. Note that the DPR production includes both LTO oil and oil from conventional wells. LTO oil and conventional oil output peaked in October 2019 at 9,062 kb/d. The projected May output is 8,526 kb/d, a drop of 536 kb/d. Note the increased rate at which production starts to drop in March.
From August 2019 to March 2020 completed wells dropped from 1,251 to 942, a drop of 309. There appears to be a temporary pause in completion from January to March.
It is interesting to note that the number of DUCs is dropping very slowly. During March, only 62 DUCs were completed. Does this indicate that the majority of them are dead ducs? ????
Above are two tables from the March and April DPRs. Compare how the New-well oil production per rig has dropped for each region in going from the March to April reports. The March/April productivity was close to 850 b/d/rig while April/May dropped to 735 b/d/rig. This seems to imply that in April and May, the rigs were moving into lower productive regions. Is there some other explanation?
2) Light Tight Oil (LTO) Report
The LTO database only provides information on LTO production from seven tight oil basins and a few smaller ones.
There was a significant downward revision to the LTO data in the April 2020 report. The December 2019 output was reduced from 8,250 kb/d to 8,097 kb/d. March output is 8,096 kb/d up 7 kb/d from 8,089 kb/d in February.
This chart shows the monthly addition to LTO output. It recovered to an output increase in February and March from decreases in December and January. The production increase in March was 7 kb/d.
The Permian is the largest contributor to US tight oil growth. The average growth rate for 2019 is 40% lower than 2018. While output may be slowing, output from January to March continued to grow at 59 kb/d/mth, virtually continuing at the average trend of 58.7 kb/d/mth from January 2019. Output in March reached a new high at 4,063 kb/d. Will it slow in April as rigs are retired.
3) Short Term Energy Outlook (STEO)
The STEO provides projections for the next 13–24 months for US C + C and NGPLs production. The April 2020 report presents EIA’s oil output projections out to December 2021
The chart compares the April 2020 STEO C + C projections with those in the March 2020 report. In the April STEO report, the estimated output for December 2020 has been reduced by 1,650 kb/d from the March report. From March to October the STEO is estimating that output would fall at an average rate of 250 kb/d with largest drop occurring over the first two months at a rate of 400 kb/d. Also note that the GOM increase in late 2021 is smaller.
The increase in output from the GOM in December 2021 has been reduced by 167 kb/d. Could this be due to projected lower capex associated with the current low oil price environment?
This chart compares the April 2020 STEO projection with the March 2020 report for the Onshore L48. The revisions in April STEO report project that the onshore L48 output will be down by 1,602 kb/d in January 2021 as compared to estimates in the March report. The April report estimates that by December 2020, output is expected to be down from 10,230 kb/d in March to 8,680 kb/d in December, a drop of 1,550 kb/d.
Above is a comparison of the EIA’s March and April projected price environment over the next two years. The settled price for WTI on May 1, 2020 was $19.69 for the June contract and $22.33 for July, close to the EIA estimates. The contango has been reduced to $2.64 today from $5 a few weeks ago.
World oil Production
World oil production fell by 850 kb/d from 83,235 kb/d in December to 82,385 kb/d in January. The likely hood that the date November 2018 will be recognized as the date for World Peak Oil is increasing, in light of today’s slowing world economy and the time it will take to recover, possibly up to two or three years. In the mean time, new discoveries are few and small and old fields keep declining 24/7.
Check how fast Guyana’s production is increasing. Output in January jumped to 34 kb/d. It went from 13 kb/d in December to 34 kb/d in January, an increase of 21 kb/d or 161%. Almost puts the Texas Permian to shame. ????? .
BOEM produces an estimate of GoM reserves every year. This year’s covers estimates for then end of 2017. Nominally The figures given are 2P estimates but previous analysis has shown them to be extremely conservative, and they strictly follows SEC rules concerning reserves being bookable only if clear development plans are in place.
Backdated Reserves
These charts show reserve additions from discoveries by depth (all backdated to the original discovery year so that all adjustments due to improved extraction methods and better understanding of the reservoir etc. are included in the shoen reserve estimate), production and remaining reserves also by water depth.
The black dashes against each discovery show the original estimates of reserves. The shallow water estimates were very low and had significant upgrades, deep water not so much, and ultra-deep hardly at all. The reason for this is mainly the date of the discoveries: nominally it should be easier to apply seismic and drilling analysis from shallow water but the ultra-deep finds were made later and therefore have had better technology and seismic available when the original estimates were made; more on this later.
That said I do not know what method BOEM uses to make the estimates, it cannot be the ultra high fidelity models that the E&P companies use as they do not have the computer power, human resources or time to cover every field in the GoM.
The 2018 and 2019 remaining reserves shown have been calculated assuming no additional discoveries or adjustments so they will be low. In fact the whole curve for remaining reserves will be expanded a bit as new projects get approved, allowing their resources to be booked as reserves, so that the BOEM estimates get closer to the E&P’s own figures.
The normal caveat applies to the GoM (and some other jurisdictions) in that reserves are counted against leases (i.e. geographical locations) rather than fields (i.e. distinct geological reservoirs) so that actual new discoveries can appear to be adjustments backdated against the original discovery in a lease,
Reserve Discovery Sizes
This chart might have been better shown in the previous post on discoveries, but it shows how the size of discoveries and hence the rate of addition to reserves has fallen, though probably not as dramatically as it appears just because of the way I’ve displayed the date. This possibly demonstrates how easily a particular viewpoint can be emphasized just by picking a particular way of presentation, without needing to cherry pick data. That was not my idea – at least consciously. The lines show the average size of total reserves for all the fields found from the year shown until 2015 (the last year with many recorded). This smooths out yearly variation but overly biases towards recent years and means that the delay between discovery and registration of a find by SEC rules makes the curve look steeper than reality. If and when (and with the recent price crash it may now more be a question of if for some time) the newer, and relatively significant discoveries like Anchor Appomattox, North Platte, Kings Quay etc. are included then the decline in discovery size will be much less obvious. However the actual number of fields found will still follow a pretty good bell curve, and given the likely coming collapse in high risk / high impact exploration, one without a very fat tail (for now).
Reserve History
The two charts below show how the oil and gas reserves were thought to stand on a particular year. The numbers evolved for four main reasons: 1) Technology improvements and production results allow a better understanding of what is actually in-place (the reason why all reserves need to be backdated to make much sense); 2) New technology allows improved recovery; 3) Oil price changes affect what is economic to extract; and 4) SEC rule changes affect what reserves can be booked (principally affecting non-producing reserves and when they are planned for development).
The 2008 SEC rule changes show up as a big step down for oil – most of that has now come back as projects have been approved for development; it remains to be seen if they all remain as firmly approved as once thought given the ongoing price crash and the, likely, continuing short term demands from shareholders for dividends and share price support through buyback schemes) Deep reserves (anything in above 1000ft water depth) are shown by discovery year, with the three largest years highlighted. Shallow reserves have been flat or even slightly declining, something that may accelerate and become permanent downgrades if any of the high water cut wells need to be shut-in.
Adjustments to Large Deep Fields
Mars-Ursa is the dominant field in the GoM and is the gift-that-keeps-on-giving in that the original reserves keep getting bigger – I think this is almost all from discoveries of new fields in the leases rather than from upward revisions, although there were some improvements made by adding water flood. Note in the chart it is shown on the right hand axis and is over twice the size of the next largest C&C reserves. Lucius, too, has shown general improvement since start-up, though there was a slight downgrade in 2017 (I may have got this cocked-up in a previous post).
Other fields have done much less well and some have been severely downgraded after initial production results. Some of the downgrade has been recovered in 2016 and 2017 estimates and will likely continue when 2018 and 2019 estimates come out, although the current price crash may mean another downgrade now. This recovery was partly due to a lot of brown field redevelopment, such as Thunder Horse South and Tahiti Vertical expansion, but also a lot of in-fill wells and some new discoveries.
Overall Reserve Adjustments
BOEM provides historic reserve data for fields from 1975. This covers all of the period when deep and ultra-deep fields were being discovered and brought on line. The chart below shows how the reserves (all attributed to a main field in each lease) have been adjusted from the initial estimate through to when the field was exhausted or now, if still on-line. The normal caution applies in that a single lease can, and many do, contain separate fields but all reserves are referenced against the main field and its initial discovery date. Thus a significant proportion of what appears to be adjustments is really discovery of new reserves, so ‘growth’ may be over estimated (probably only the owners know by how much).
On the other hand the adjustments made for older shallow fields may be under estimates because there would have been growth prior to 1975, which as not been shown in the BOEM numbers. Some of this growth would have been very large because estimates were no better than wetted-finger-in-the-air guesses until a field started production and then improved markedly as more data became available. Because of the unknowns, and maybe because of regulatory, tax and royalty regimes, though I have no real knowledge of this, those initial estimates tended to be conservative.
The reason ultra-deep growth is so low is because these are all newer fields, developed since 1998 when better drilling, seismic, modeling and sampling technologies have been available, together with improved understanding of the geology in the GoM and of oil reserves generally. Part of the reason the deep fields (rather than ultra-deep) adjustments are so high is that this technology became available as the fields were being developed or in early production.
This chart demonstrates how the revisions have all occurred in the first ten years of production. I was a bit surprised that there wasn’t a bigger change in the first couple of years and then a flattening out (i.e. asymptotic rather than linear). However I might be biased by my experience having been more in the 1990s and 2000s. The newer fields haven’t shown any overall growth yet. The initial negative adjustments suggest a bit of over exuberance when these fields were first discovered (also supported by a number of highly hyped recent deep-water projects being canceled completely and some operators retreating with their tails between their legs. (Apparently dogs do that so that their foes cannot smell the fear in their chemicals in their gaseous releases – which I actually find more interesting than the history of GoM reserves, see below for more emission related information.)
The adjustments may also be affected by the small sample size with a large proportion still in early production years, by a lot of volatility in the oil price in the period where they saw changes and, as always, by the many-fields-one-lease issue.
The discovery year and technology effects are summarised in this chart: large upward revisions in the 70s and 80s, not much change for fields from the 90s and probably a net negative adjustment (given the discovery versus adjustment issue), in this century. There may be further growth as production evolves but in the short term the rapid and significant oil price drop in recent weeks could be a devastating to any expectation of growth in 2P reserve numbers (both reducing current estimates by halting brownfield work but, more so, by delaying or eliminating additions from new developments and discoveries.
There have been at least two papers, one based on UK offshore and one by the USGS, warning against applying growth figures based on any one field, let alone a basin, to anything else; so these findings may be interesting but of no particular relevance; though I think it’s pretty certain that any field that’s been operating for over five years will not see much more growth unless some major EOR scheme is applied, which isn’t going to happen in many places at present prices.
R/P Ratios
Over the years the reserve to production ratio has been kept around eight years, even as the production was increasing – i.e. reserves were increasing too, I think a lot has been from reserves added back in that were dropped when the SEC rules for booking were changed, often through in field brownfield projects.
The chart shows how R/P would drop through 2018 and 2019 given the production reported for those years if no new reserves were added to the BOEM 2017 numbers.
For 2020 and forward it is hard to see how the COVID-19 crisis won’t have some major impacts, which are, at least for me, completely unpredictable. I don’t know how quarantine would work offshore; I guess the shifts have to be kept isolated even when they move onshore. Any sort of planned, still less unplanned, maintenance seems problematic; and what happens if a hurricane or major incident requires evacuation. I think the majors would be inclined to take the safe route and just shut down. Maybe Trump will insist on keeping things running for the economy and blame the subsequent deaths and hospitalisations on the Chinese. Loss of production will put the R/P number up quite quickly.
On the other hand new projects are sure to be delayed or even cancelled. Through 2019 a break even price of around $30 for deep-water had been mentioned by companies, though Art Berman has mentioned around $60. Either seems unlikely at the moment (today, 20th March Mars US, a GoM grade, is $19); and any quarantine impact is bound to delay projects, which could mean some reserve additions have to be deferred. Given that R/P might fall compared to expectations after 2020. Who knows?
EIA Reserve Estimates
The EIA present it’s own reserve estimates based on reports from the E&Ps. These are, nominally 1P numbers but since the SEC rule changes have always exceeded the BOEM 2P estimates, although they may be getting a bit closer together. A lot of the difference may be the “non-producing” category used by EIA, which I assume is mostly fields under development, both greenfield and brownfield, of which there are some quite large ones (Anchor, Kings Quay, Vito, some adjacent fields to Appomattox, maybe North Platte depending on the level of certainty EIA require to include the resource, Oarse, Mad Dog II, Atlantis III, and who knows what other brownfield extensions). The EIA numbers are for 2018 and a lot of those developments may show up in the BOEM estimates for this year. 2019 and, certainly, 2020 will not show the same level of AFD activity, there may even be a chance some things are cancelled.
Off Topic Finish: Titian’s Effulgence
This is an early painting by Titian called “Bacchus and Ariadne”. It’s an imposing canvas and in the National Gallery it is paired opposite another big, classically themed but late period Titian with hints of impressionism (maybe because of eyesight problems, like Monet): “The Death of Actaeon”, and there are a couple of similar others in the same room if I remember correctly. Even after almost 500 years the colours are awesome, unsurprisingly especially the blues.
Nominally it is about love (really lust) at first sight, but actually it is a joke about excessive gaseous emissions, and all the greater for it. The white flower at the bottom, pointing accusingly at the nether regions of both Bacchus and the Satyr, is a caper, known for its anti-flatulence properties. The dog looks suddenly quite interested and the followers faintly disgusted, two of them may be fanning their noses; even Ariadne is looking a bit miffed (though that could equally be explained by her having a priapic Bacchus suddenly violating social isolation conventions). Some think it’s Bacchus himself who has just cut one (possibly first date nerves) but I think he’s jumping to evacuate the contamination zone, his cloak blowing in the wind as it were, and the real guilty party is the Satyr (lauded in ancient Greece for their “farting prowess”) despite his attempt at doe eyed innocence. Why would Titian have painted this? It must have been a dig at someone, probably a rich client – real art
Production is dominated by major international companies particularly, and maybe surprisingly, European ones. Principally Shell and BP, but with Equinor, Eni, Total and Repsol also active and many are (or were) seemingly wanting to expand in the area. Maybe this is an example of reciprocal technology transfer: the North Sea was initially developed with a lot of American offshore know how and there it may now be the reverse is happening as deeper water fields using floating and subsea systems are developed.
The recent growth in production has come from the larger players, and they are taking a bigger slice of the expanding pie. The medium sized independents and smaller non-operating owners held many assets in shallow water but do not have the money, risk acceptance or knowledge to participate in the deep and ultra deep projects.
Lease Operatorship
Each lease has a nominated operator, and the proportion of production for each operator is shown. This is not the same as the operator of the surface processing platform for example Julia is a subsea lease operated by ExxonMobil but the fluids are processed in the Chevron operated Jack FPU. ExxonMobil provided the subsea control system that interfaces with the subsea wells and Chevron installed and now operates it. Operatorship of the leases is concentrated, and the proportion growing, amongst the major oil companies (shown), and still more so for the operations of the surface facilities.
The big three operators dominate the drilling activity, which is now almost all deepwater, even more than they do production.
Reserve Holdings
Reserves are concentrated among the larger players they also mostly show reserve growth (from brownfield growth I think), whereas the smaller companies mostly show decline. These figures are BOEM estimates and only go to 2018, but I think the trend would continue in 2019 as the projects announced for FID, and therefore that allow booking of reserves, are owned by the super majors. Lord knows what’s going to happen for 2020 though. Note that the numbers are more fuzzy even than the BOEM estimates as I don’t know how reserves are shared when a field is split across several leases with different ownership, so the best I could do was a simple equal pro-rationing of the field across each lease. The R/P numbers are around six to ten years but they change a lot from year to year. Only 2018 numbers are shown; in 2017 there was a clear trend of larger companies having higher R/P but that disappeared.
Company Liabilities
The large E&Ps keep up pretty well with their plug and abandon commitments for wellbores. They have a low proportion of temporary abandoned wells, although their number of completed and operating wells is growing because production is growing. Medium sized E&Ps, and still less the small independents are not; even as their proportion of operating wells fall their proportion of temporarily abandoned wells, and the total numbers of wells requiring future P&A are growing significantly. I think there is a good chance that many of these smaller operators will go bankrupt leaving a number of potentially leaking wells, presumably for the tax-payer to clean up (Fieldwood is quite a large company but with large liabilities – see below – and is leading the bankruptcy charge).
These liabilities are based on BOEM estimates and I’ve only added them based on the operatorship. In reality it is likely to be a lot more complicated with lease owners having to contribute so that more cost would devolve to the smaller companies. However the huge liabilities against “Others” is apparent. I’m not exactly sure how this would be included against the company’s net worth but it wouldn’t be a surprise if many were technically bust. The shallow water wells, which make up most of the inventory for the independents may be a bit easier to abandon, but there is no guarantee as they are not necessarily shorter and may require a MODU to access, whereas many of the deep-water platforms have dedicated rigs. Similarly floating deep-water production units are easier to remove than piled jackets.
Individual Companies
In the following charts the red band at the top of a companies production shows the total equivalent gas, pale blue at the bottom) is shallow C&C production, deep C&C is yellowy-green and ultra deep is greeny-blue. The more green for deep, and blue for ultra deep, the hue means the larger the present size of the field. Only the most significant fields in a company’s portfolio are named. The average line is the twelve-month trailing average for the combined production of the companies shown, and operatorship the combined operated lease production.
Shell
Shell is the biggest producer and operator, mostly thanks to Mars-Ursa, which is the biggest basin in the GoM. To date it has concentrated in deep water rather than ultra deep, but that is now changing as Appomattox continues to ramp up and with Vito due. Shell has a 60% ownership in Whale described as one of the decade’s largest discoveries in the Gulf, and expected to be a 100 kbpd development, even if it has been mooted as a tie back to Perdido and tie-backs that size are rare (in fact I don’t think I know of one). Shell has enough reserves, developments and prospects to stay top ad increase production even given the latest slow down.
BP
BP is top dog in ultra-deep and is likely to keep expanding with Mad Dog II under development and Atlantis III in ramp-up. Mad Dog II (aka Argos) at one time had break even price of $80, the highest of the GoM prospects at the time by about $20. It was considerably simplified afterwards and costs have decreased but current economics must be marginal at best. Thunder Horse and Atlantis were something of disappointments initially but recent brownfield developments and in-fill drilling have continuously raised reserve values. Most of the super majors tend to sell off assets once the get to run down stage but BP does this more than most.
Chevron
Jack / St. Malo is the Chevron flagship, taking over from Tahiti. Both now seem to have completed the major development phases. Stampede and Big Foot are still ramping up.
At the end of 2019, when oil was still at $60, Chevron booked write downs of around $10 billion and stated that much of its deep water resource was not commercial at this price range, although I think most was not in the GoM. Chevron has significant undeveloped assets as operator at Anchor (in mid development), Ballymore (a qualified field in BOEM but with no FID until 2021 and the last news I saw was that it was planned as a tie-back to Blind Faith, which would tend to imply maximum production around 30 to 50 kbpd); and also has minority ownership in Shell’s Whale (no FID before 2021) and BP’s Mad Dog II . In December 2019 the IHS Upstream Capital Cost Index, a measure of development costs, was 180, down from 230 when oil prices were at their peak. Given a supply shortfall enough to cause a price spike it is likely this index would rise significantly, made worse by the loss of workforce through demographic changes and the two recent price crashes. Therefore prices of $100 or more could be required to make some of deep-water projects attractive again. Will this ever be seen – the camp that says the world economy can’t afford them seems to be winning at the moment, but maybe some kind of shale-like economic con or government intervention would allow it.
Occidental (ex-Anadarko)
Originally Anadarko had interests in deep-water fields with platforms operated by others. In 2016 Anadarko acquired and took over full operation of assets from Freeport-McMoran, which, in turn, had got them mostly from BP. It did completed several in-fill wells through 2018, which just about kept production increasing slightly, but that activity stopped and Anadarko mostly switched to share buy backs. Before that its two big new projects were Lucius and Heidelberg, neither of which, I think, has done quite as well as expected (originally there was a phase two planned at Heidelberg that seems to have faded away and Lucius processing system is more used for tie-backs: Buckskin, North Hadrian. Anadarko was taken over by Occidental before the current crash (though BOEM still have Anadarko as the operating entity) in what now looks like a bit of a nightmare deal. Occidental mostly wanted Anadarko’s shale holdings so their GoM assets might have been seen as a bit of a millstone even with $60 oil.
ExxonMobil
ExxonMobil would like to find a buyer for their GoM assets, but is probable going to be frustrated without dropping the price unrealistically or a sudden oil price spike. It operates a few leases, the largest producer is Julia; there has been talk of a Julia II expansion (larger than the original) but seems to have gone quiet – maybe waiting for spare capacity at the Jack floater. It had one of the original large deep-water projects at Lena but that has been abandoned over the last few years.
Fieldwood and Enven (Apache, Noble and Marathon)
Enven and Fieldwood are fairly new E&P companies with exclusive interest in the GoM. Fieldwood was formed during the irrational exuberance high price era in 2013 from Apache shallow water assets, with a lot of gas. It later took over the rest of Apache, and Sandridge and Noble assets in 2018. Production has been steadily falling and it declared bankruptcy in early August 2020 with $1.8 billion in debts and for the second time in two years). It has very high P and A liabilities for shallow water fields and a lot of end of life deep fields (all grouped in the pale yellow strips, which represent several similarly coloured lines) including Bullwinkle, which has the highest platform decommissioning costs. Its larger deep-water fields of Dantzler, Big Bend and Gunflint are all processed through the Thunder Hawk platform; combined they are over 50% depleted by BOEM reserve figures, unless there have been significant revisions since 2017, with Big Bend and Dantzler at end of life. It has operatorship of Katmai, a deep water field with 25kbpd design capacity and due this year. I don’t know how that will procede now.
Enven was also formed in 2014 and acquired assets from Shell, Eni and ExxonMobil through 2016 and took over Marathon Assets. It applied for an IPO in 2018 but withrew in February this year. Performance has not been impressive and it might be in the cue for the chopping block. It operates four old deep-water platforms, with interest in two others and doesn’t get involved in much greenfield exploration, but concentrates on near field low risk opportunities.
Murphy, LLOG and Ridgewood/ILX
Petrobras opted out of the GoM in 2019, selling up to mostly selling up to Murphy in a new venture, MP GOM, in which Murphy holds 80%; Murphy also took over operations. The Petrobras holdings in Cascade/Chinook and its Lucius were pretty disappointing and the Jack / St. Malo project, which has done well, has come to the end of its main development phases. Murphy also got a lot of assets from LLOG, including the development and operation of the 80 kbpd Kings Quay FPU. I wonder what the stake holders think of its expansion plans now. LLOG also sold their holdings in Shenandoah development (70 kbpd originally planned for 2024) to Blackstone, a fairly new private equity player in the GoM.
LLOG seems to have had a bit of a fire sale in early 2019 and it also sold a chunk of assets to Ridgewood/ILX. LLOG is privately owned so maybe the owners were cashing in but they also lost some income in 2017/2018 with a major failure in a subsea template at Delta House FPU. Ridgewood is a private equity company but also partly owns ILX with Riverstone Energy. Both entities concentrate on non-operated deep-water GoM developments, often they have independent holdings in the same leases,. LLOG concentrated on one or two well tie-backs and it looks like Ridgewood/ILX are continuing that way and have a number of prospects, though exploration may be delayed.
Other International Oil Companies (Equinor, Eni, CNOOC, Total, BHP and Repsol)
Equinor is a significant producer and expanding, proportionally, faster than any other, and that is likely to continue as it has holdings in Stampede and Big Foot (still ramping up), Vito (in development) and North Platte (in FEED). It does not operate leases or platforms.
Eni looks to be fading away, it owned a part of some small recent tiebacks but nothing planned
CNOOC, which used to be Nexen, was trying to pull out of GoM activities in 2018 because of the Trump trade wars but haven’t done so and are unlikely to find a buyer at the moment.
Total is a small but ambitious producer and will grow as it has 37% of Anchor (80 kboed, due in 2024, but may be delayed) and 60% of North Platte, for which it will be operator (80 kboed in delayed FEED and with 20 ksi completions, like Anchor).
ConocoPhilips is a small producer and would probably like to sell up if possible.
BHP is a significant but declining producer and a couple of years ago there was talk of shareholders agitation to sell up.
Repsol has an agreement with LLOG to develop Leon and Moccasin as tiebacks. They co-operated on the similar Buckskin project, which, like these two, was originally thought to be a larger field.
Other Large Independents (Talos, Hess, Deep Gulf and W&T)
Most of the assets of these independents are in decline with nothing much new on the horizon. Deep Gulf, owned by Kosmos since 2018, and Talos, which took over Stone in 2018 and Castex in August this year, have expanded slightly recently, Hess stayed about level (but I think was trying to sell some assets to fund developments offshore Guyana) and W&T is mostly in shallow water. These sorts of companies tend to go for short cycle, high margin projects, and economics and geology are militating against those at the moment (and for the near future). Combined these companies lost over $700 million in the second quarter (though only W&T is exclusive in the GoM, and Talos mostly there). I’d imagine all are suffering with debt. Hess operates Tubular Bells, tied back to the Williams FPS, Gulfstar. It was supposed to be the anchor field for the platform, to be followed by other tiebacks; there was a small discovery and single well tieback this year, which is counted against the Tubular Bells field, but I don’t know of any other prospects.
Off Topic Finish: Denial
There’s a recent theory that an ability for denial is evolutionary adaptive in a cognitive species and was necessary (even if not sufficient) for us to become the dominant homo species. The theory goes that without it we’d understand just how horrible life and death can and will be, descend into a “slough of despond” and stop struggling to reproduce. I think the jury’s out on that, and don’t know how it could be demonstrated. It feels a bit “just so”-ish but nevertheless there’s a lot of denial about and its prevalence seems to grow, or at least becomes more overt, as things get worse. It looks like a battle of short term freeze-flight-fight – mostly freeze maybe – response from the reptile brain, mainly the amygdala (mostly dominant in conservatives) and longer term problem solving, planning, logic and post-rationalisation from the mammalian side (mainly the anterior pre-frontal cortex, more influential in liberals). If you want to argue the politics then one notable result is that someone’s voting preference can be predicted with a high level of accuracy just from an MRI brain scan (over 85% from memory; it’s somewhere in Behave by Sapolsky, which I highly recommend, but it’s a long book with small print and smaller footnotes).
The most obvious form at the moment is climate change denial and it is strong evidence of denialism’s dominance that however much the accelerating tide of evidence sweeps all before it the die-hards remain completely refractory, albeit subtly changing their arguments as each is successively knocked down. However there are plenty of other trends threatening civilization and possibly the human race that have their own deniers, often, but not necessarily, overlapping with the WUWT gang. Take your pick from biodiversity loss, water shortages, new pathogens for humans or crops, resource depletion, soil erosion, financial crises, secular development cycles, AI, demagoguery, overpopulation etc. They all have potential to take big lumps out of our collective wellbeing, they are all pretty well advanced and the combined probabilities and consequences are much more than the sum of their individual risks.
There are two often-cited future scenarios that I find particularly bothersome. One is the technocopian dream that we transform to a shiny Star Trek like future and the other that we can achieve a localised, sustainable bucolic idyll (more Star Wars maybe). They both have a tacit assumption that such transformations would see the end of all our major problems. It’s a kind of humanist eschatology that I find as delusional as organized religions and more distasteful than a few (though not the monotheistic ones).
Denial, to some degree, often comes in because someone knows all the risks in their particular field but is ignorant of the issues involved in any solutions – usually because they involve many other, unrelated fields. For example a typical climate change paper on causes and environmental effects, written by a scientist, or one concerning the societal consequences, written by an economist, sociologist or similar, will have a load of details on the actual subject, and then right at the end something like “we just need to get off fossil fuels in X years, but time is getting short” (as it has for the last forty years).
I can’t believe any of these authors have ever been even peripherally involved in a multi-billion, multi-disciplined engineering project. These are difficult at the best of times and invariably overrun schedule and cost estimates. What turns them into complete disasters is everything that we face in trying to switch to “renewable” energy: a tight schedule because it “has” to be; engineering with technology that has not been properly tested and proved at large scale (e.g. CCS); an environment in which the equipment supply base has to expand rapidly and virtually in step with the demand; rapidly increasing requirements for trained personnel; project management teams with management experience in unrelated industries or only technical experience in the relevant industry; a huge demand for trades people during the construction phases so they can up sticks whenever a new, and longer lasting, contract becomes available; the need to work in undeveloped countries with poor infrastructure, untrained staff and corruption; constant planning issues; social disruption and unrest; inevitable extensive state and political interference (not limited to regulatory oversight which states do best); financing issues; etc. There is a saying in large projects: quality, schedule or cost – pick any two. But when there are a few detrimental influences as above you are lucky to get any of them. Usually after lots of rework and delay something near to minimum quality will be met and with luck there will never be an incident that tests the design at its weakest limits.
Especially, it is almost impossible to do any of these large projects in widespread and prolonged volatile geopolitical environments; and you only have to look at USA/Hong Kong/Lebanon/Belarus/ Middle East (pretty much anywhere)/Libya/Brazil/Bolivia/Chile/Venezuela/Kashmir etc. to see that is only going to get worse. Climate disasters (see Asian flooding to come or South East USA if the hurricane season is as bad as predicted) and food shortages (see Lebanon in a couple of weeks) make thinking more short term and unrest more damaging. In almost every revolution the “newly liberated” peoples end up initially, and for some time, worse off than before.
There is a hydroelectric development project in Labrador which offers a salient lesson – it was forced through partly as a political statement when there were better alternatives, the management team were locals (also a political decision) mostly from the oil industry with no hydroelectric experience; add a few harsh environmental issues that hadn’t been sufficiently allowed for during planning, many contractual issues especially as insufficient contingency had been included, and most recently Covid19. At last count the price had doubled (to over $12 billion) has virtually run out of contingency (again) but still has considerable downside risk. It is two or three years late and counting, and the electricity produced is going to be very costly. There was a large enquiry completed last year that had fingers pointed in all directions. That was a one off multi-billion, multi-year project, done when there were few limits on workforce availability. Switching fuel sources (especially when it is forced rather than a natural progression to “better” ones) is a continuous, global, multi-trillion, multi-decade effort and would consequently have far more ways to go completely off the rails.
It’s often said that we need an Apollo or Manhattan project, but what is needed is nothing like those which involved small teams of dedicated and appropriate personnel, with unlimited resources producing compact one off devises. I’m not sure it’s much like the WWII mobilization either, that just had one relatively short term problem to solve, and there wasn’t much thought given to what was going to be done after victory.
The second idealised future is the sustainable, localised rural retreat type, often coming from ecologists or liberal leaning sociologists and journalists. It seems to me that would involve some kind of giant social engineering project, it might work with a hive species with common DNA, but even then I doubt it on a global basis. The proponents seem to think that once shown the error of their ways everyone is going to behave just like themselves, or at least like they are told to. They seem not to get that people’s behaviour is not logic driven but by ancient hormonal reward pathways, status signaling, dynamic tit-for-tat etc.
I’m a bit out of my comfort zone with philosophy but I think there is a concept of ethos (which I’d associate with our reptile brain) that is a culture’s spiritual base, and eidos (the mammal part) that is its logical and intellectual character. The proponents are relying on changing the global eidos, but ethos is always going to win and will always prioritise the short-term self-interests and reproductive rights of the elites. One theory of how this sea-change is supposed to happen is through cultural evolution, which can occur much faster than the ecological type. But the nature of evolution is stochastic; every event is random and localized (I think they would be called Markov chains, but my memory is going for a lot of mathematical things). Evolution has no sense of objective “improvement” and can’t be directed, so I don’t see how this can be expected to lead to any sort of sustainable arcadia.
I don’t see much chance of retaining any sort of even medium scale civilizations, though the decline might take a long time and, for most, an increasingly unpleasant one (another common denial is the “by 2100” one, which kind of implies that any bad trends stop at that magical date, maybe that’s when the humanist rapture is expected). The trouble is the longer and larger the overshoot is allowed to become the bigger and deeper the collapse. Catton, in the book Overshoot, admittedly on a fairly limited sample size, indicates that, following collapse, the undershoot is of the same order as the overshoot, and if deep enough the species goes extinct. If, after the main population drop, all that is left is a collection of isolated and genetically bottlenecked tribes then it’s easy to see how each could be wiped out from separate and random events (pathogens, drought, crop disease, strife, genetic disorders etc.) especially in a wrecked environment that would still be changing at a rate that is orders of magnitude faster than any evolution processes could keep up with.
Common advice is to do something positive even if you feel things are hopeless, which is fair enough but I think still smacks of a large amount of denial. “Armageddon, it been in effect, step … c’mon, let’s crank this shit up and get busy,” (Professor Griff). Words to live by.
End of rant
The opinions expressed in this post are those of the author. They do not purport to reflect the opinions or views of PeakOilBarrel owners or other contributors, or those on any of the other sites that may choose to download and repeat this post, whether with or, as always, without permission (please feel free, but only if you take all of it).
This analysis concerns C&C only. Natural gas production is low and steadily declining with few deep gas-condensate discoveries and the shallow dry gas fields at end of life. I don’t know if lack of gas may affect oil production – e.g. insufficient: flow to allow stable pipeline operation; income to be economic to warrant continuing maintenance; or fuel gas or lift gas supply to surface facilities. Any such issues could influence shutdown timing and hence the possible stranding of assets.
Top Down Production Projections
The chart above shows a Verhulst fit to GoM C&C production using seven curves, three describing shallow production and two each for deep and ultra-deep. A symmetric logistic curve is convenient for manual curve fitting as it allows a linear extrapolation to give the ultimate recovery, but most production curves are not symmetrical – usually the decline is less concave with a thicker tail, especially as the production volume and number of independent producing entities are reduced. With Excel, using least-squares optimisation fitting to any curve(s) is simple and has the benefit of allowing additional constraints to be imposed for sensitivity checks (e.g. total area, equivalent to the ultimate recovery, and position or height of peak), so more general Verhulst curves allow closer fitting.
Against this is that fitting fairly arbitrary curves maybe negates some of the births-and-deaths theoretical basis for a logistic model and, as mentioned below, can distort the extrapolated tails unless some additional constraints are applied.
The drilling hiatus after 2010 complicates the fit by creating a false trough and deferring the peak; without it only one curve would be needed for each of the deep and ultra-deep production. The fit to the shallow production is pretty good and gives an ultimate recovery of 14Gb. in its 2018 report BOEM estimates ultimate recovery at 13.4Gb, with 67mmbls added that year (and generally the additions are declining each year) so that too fits well.
The curve above has a total recovery of 32Gb C&C, with 12Gb in deep water and 6Gb in ultra-deep; BOEM in 2018 gave these as 7.8 and 3.7 respectively, with annual changes of -36 and 174mmbbls, make of that what you will. There are a couple of billion under development or close to FID but not included by BOEM: projects in the Appomattox area, Vito, Mad Dog, Anchor, Kings Quay and Shenandoah, though much of it is 20ksi technology that has yet to be proven in full operation and is costly and with long lead times.
The second chart shows fits with constrained recoverable reserves of 28, 32 and 40Gb (shown as line curves) and an unconstrained case that gave reserves of 58Gb (shown as the stacked area chart). All cases use the same curve for the shallow production and optimsed the fit with the parameters of the four other Verhulst curve. Current BOEM 2018 estimates of total 2P reserves of C&C are 24.9Gb (13.4 / 7.8 / 3.7).
By these estimates 2019 looks likely to be a peak, if not an all-time then at least for some years. This year will be well down compared with last and it will take a few years of steady development to catch up if the peak is to be exceeded, assuming sufficient and rapid discoveries become available, which seem unlikely (see later sections). As mentioned before, a delayed and higher peak would be an expected result of the 2010 hiatus (as happened to a bigger effect in the UK with the Piper Alpha shutdowns).
With only half the curve to fit to the parameters are sensitive to small changes, although I’d venture that the actual answer is bounded by the cases shown. The displayed curves indicate that new reserves need to come more from deep rather than ultra-deep but I don’t think too much should be read into that; in further studies just small parametric changes didn’t change the accuracy of the overall fit much but had big effects on the split between each curve.
Reserve Projections
Below is an attempt at a similar fit to reserve discoveries, although only using a single curve for each depth. This is rather more difficult than for flow: (i) the process of discovery is more stochastic than for production; (ii) recent discoveries, which have a large effect on the tail shape, are not known well and depend on whether they have yet been through FID; (iii) with BOEM any new field discoveries in a producing lease are backdated against the original field, which loads the curves to the front end and thins out the tails; BOEM estimates for recoverable reserves tend towards the conservative; and (v) the estimates for new discoveries not in development in 2018 are based on company reports, either directly or through industry magazines, which tend towards optimism (often citing an “up to” figure, which would correspond to a P3 estimate).
The tails on these curves give only 700mmbbls more, split slightly in favour of deep rather than ultra-deep, to give a total ultimate recovery of 29Gb. I think it will be higher with a couple of major finds but mostly near field tie-ins either to the set of hubs currently under development or appraisal or extended reach tie-backs (BSEE/BOEM is currently looking at technology that could promote development of these so that presently stranded assets can be matched with existing under utilised surface processing, which I’d assume includes things like heated flow lines, subsea compression, and subsea separation). The dearth of recent lease sales would tend to militate against a lot more – maybe 32Gb will prove to be about right.
EIA Reserve Estimates
The previous estimates are all based on BOEM reserve figures. The EIA also issues estimates based on reports from the E&Ps. For 2018 these are 5191mmbbls (C&C), but are a 1P number (proven). This compares with 3434 from BOEM, a nominal 2P number. In the UK 2018 probable reserves were 40% of proven, in offshore Mexico 80% (but the Cantarell field contains almost half the probable reserves which is a bit surprising for a mature field), and in Brazil about 60% (an educated guess as the ANP board only issues 1P an 3P numbers). Given the maturity of the GoM basin and the technology available I’d expect the GoM would be closer to the UK number. In addition the companies numbers likely include some reserves for fields in development but not yet in the BOEM numbers; so a conservative guess around 7Gb for 2P EIA equivalent seems reasonable, but is likely to be more dependent on oil price than the BOEM number. I think some of the biggest contributors to the extra EIA reserves are higher recovery factor estimates, especially for the large ultra-deep fields operated by the Shell, BP and Chevron. For example the BP fields Atlantis and Thunder Horse have present recoveries, from BP investor presentations, of just above 10%, and Mad Dog’s is given as below 5%. These are large fields with over a billion barrels of original oil in place. Just small changes in the recovery factor results in a significant change in reserves. BP is forecasting an increase to 400kboed production (from 300 in 2019) and then, without new discoveries, a slow decline. The higher EIA numbers are not incompatible with an estimated C&C recovery of 32Gb, but may suggest a higher upper end, depending as usual on future discoveries.
Well Decline Rates
Well decline rates were estimated by fitting an exponential to the decline phase (after the maximum monthly average is reached) for data from 2014 onwards. New wells tend to decline rapidly in the initial months after ramp-up and any plateau. A power-decay curve (e.g. a hyperbolic) would be closer than an exponential in the early months, but that is not particularly relevant to the later life behaviour, which is what matters most for estimating ultimate recoveries.
The chart above shows the example of some of wells for Anadarko. In each field the wells are stacked from oldest to newest and all start at their maximum month, so the upper measured curves are shorter and some may not even be in the real decline phase.
The rates are mostly collected around 15%, but some have are above 50%, e.g. Lucius and Heidelberg have some initially large wells that decline fast with water break through. Older low flowing wells decline much slower, and because the time considered was only from 2014 these numbers are not really representative over the life cycle of the well. A few wells (not shown) have negative decline but are all low producers and, often, intermittent. Those with very high decline rates are either newly started or have ceased flowing, in either case the fit was against only a few and scattered data points. Overall the decline rates are probably better than average for high-pressure wells mostly without external pressure support, but do indicate that to maintain or increase overall production a steady supply of wells from new projects or in-fill drilling is required, and those are starting to run thin.
Well Start-up Activity
The following shows the number of new deep or ultra-deep water wells started up in recent years, plus the total extra flow added once they have achieved their maximum monthly average flow, which may be several months to years later because of ramp up issues or plateau periods. Also shown is the number reaching their maximum and the sum of these maximums each year. These are a bit dodgier as indicators of growth because wells may be on a bumpy plateau and have just a small increase in a given year rather than indicating end of a ramp up or plateau. New maxima do not all come from recently drilled wells but could be from recompletions, work-overs, sidetracks, added gas lift, other causes of reduced wellhead pressure (e.g. as throughput from neighbouring wells is reduced), improved availability etc. These wells would not necessarily correspond to wells shown as new start-ups.
There was a spike in completions in 2009, probably from deep rather than ultra-deep water projects, a dip from 2010 to 2013 and then a steady rise to 2018 with new starts dropping in 2019 and so far collapsing in 2020. Wells reaching a maximum follow a similar pattern but a year or so behind and 2019 had a peak in number and flow of wells reaching their maximum. Likely the 2019 values will decline and 2020’s will increase as some wells exceed their previous maximums. The number of added wells for 2020 is only through June but is unlikely to double in the second half given the CAPEX reduction for all the E&Ps plus other effects of the COVID pandemic and an active Hurricane season. Some of the wells to be added might be quite large producers though, especially for Appomatox and Atlantis Phase III, additionally Stampede and Big Foot are still ramping up and Katmai may come on line, depending on Fieldwood’s bankruptcy.
The pattern of peaks somewhat follows oil price: five years before 2018/2019 was just before the oil price collapse and would have seen major project FIDs, and late 2016 was when the price started to recover so that brownfield developments and small tie-ins were approved, all of which would have started beginning in 2018. However the sample size is a bit small to be conclusive and the net effect of many small individual issues may be the significant factor.
The chart below shows well additions by number and maximum volume according to the field size at the time that the associated well was started. The additions from each group follow pretty much the same pattern (i.e. the same years tend to attract higher or lower number of starts from all groups), and the larger fields tend to result in slightly larger producers.
Overall it looks like the next two or three years are going to see declining production compared with 2019, mitigated by the ramp-up of Appomatox and Thunder Horse South Phase II, before some large new developments begin start-up from late 2021 onwards (Kings Quay, Vito, Mad Dog II – aka Argos, Anchor). It seems most of the attractive near field opportunities for existing hubs have been used up and new ones will have to wait until the coming ultra-deep water hubs get through their plateau and have enough spare processing capacity to allow new tie-ins or in-fill wells, or new technologies that allow extended reach tie-ins (and, of course, depending on discoveries).
Field Decline Rates
Many large deep water fields peaked around the second half of 2018 and have been declining, slowly, since. The pace at which fields have peaked is slightly higher in the months since then than before . Another set of smaller fields peaked in early 2020 some of those may yet ramp up further as production recovers or new wells are added but several of these are one or two well tie-backs and have been declining as expected since a peak in their first couple of months on stream. Only Dalmatian, Coalecanth and Buckskin peaked in July (and for these it could be a final peak) but Appomatox and Big Foot will certainly exceed current maximums as drilling progresses.
In order to look at mature field declines (i.e. those started before about 2010 or without significant new associated field discoveries since then) they were split into three groups: shallow water, those operated by the majors (which include the still high producing fields like Thunder Horse, Atlantis, Shenzi, Mad Dog, Caesar/Tonga/Tahiti) and other mature deep water that are all well into the decline phase (albeit with occasional brown field impacts).
Each group shows a significantly higher decline rate for the remaining reserves than for their production rates, in fact the ‘majors’ group shows steadily increasing flow. This means their respective R/P numbers have been declining and either the reserves are under-estimated (by a lot) or something is going to give and production declines increase considerably. From 2005 to 2018 the R/P values for shallow/mature deep/majors fell from 7.4/11.1/41.5 to 4.9/5.4/4.8 years. Even the group of remaining non-mature fields (i.e. recent start-ups) has an average R/P value that has been steadily falling to reach 4.8 years in 2018. Values around five imply decline rates of 20%. There are signs that the small deep mature group has entered a steeper decline starting in mid 2019 after a plateau period, partly the result of production deferment after the Enchilada platform fire and Garden Banks pipeline shutdown but with extensive brownfield development. Shallow fields might be similar but the Covid related shut-ins make any new trend difficult to see at the moment. There have been small net increases in the overall reserves, probably mostly from small near field discoveries and/or IOR initiatives, for the shallow and mature deep groups but these have been trending down towards zero (probably in the next few of years). For the larger, major operated fields downward revisions from original estimates have exceeded new discoveries so far, due mainly to large decreases in Atlantis and Thunder Horse soon after their start-ups.
The peak month for the majors group was December 2018 (with the maximum for the trailing twelve month average in January 2019). Even the group of recent start-ups (i.e. everything else and not shown in the chart) had a local peak in February 2020 (average annual peak in March/April ) and has declined by 30% since – see below for further discussion on Covid-19 and Tropical Storm deferment effects.
Leasing Activity
In 2016, under the Obama administration, BOEM stated that it would present for sale all remaining available leases in Western and Central GoM in a series of tranches up to 2022. The Eastern area is mostly under a drilling moratorium until at least 2022 but is generally considered not to be highly prospective and the few discoveries there have been natural gas. There are five auctions planned, although that for August was cancelled, and others might follow suit if oil prices and E&P activity remain low. Each sale is for about 14,500 tracts meaning about 70,000 are available, but recent uptake has only been a bit above 6% and falling so maybe only 3000 to 5000 would be sold to add to the 1200 existing open leases. This is considering non-shallow wells only; there are still some shallow leases available but recent discoveries have been insignificant.
GoM leases are held open initially for 5, 8 or 10 years. If they are not then retained by production or exploration activity they expire; they may also be relinquished early or extended if an operators request is accepted by BOEM/BSEE. Most by far are ceded without seeing any production. All water depths have seen a declining proportion of operated leases even as the numbers purchased have been declining at each sale. The lines in the chart below show a five-year average of the proportion reaching production out of all the non-open leases (i.e. closed or held b activity); the indicated recent drop in ultra-deep water is an artifact of low sample numbers (i.e. there are some small producing fields from direct tie-ins to exploration wells and a few more that have been relinquished, but most are still open) and will disappear as the sample size increase. For all water depths 98 to 99% were ceded in the 2010s and the trend is slowly upwards. Therefore of the yet to be sold leases only 30 to 100 would go on to produce anything, with (a complete guess) an additional 50 to 100 from those presently open (a higher proportion because these have already been winnowed to some extent).
Of the open deep-water leases only fourteen (seven in each of deep and ultra-deep water) have had wells drilled in them, and six of those are under development already.
This is not the full picture because there may be new exploration wells and new field discoveries in leases that have already been developed (or for some shallow lease have been relinquished after depletion of the original discoveries) but these would tend to be smaller producers that were either missed the first time round with older technology or had unattractive economics (e.g. not worth designing facilities for but alright for a tie-in once capacity is available).
A ten-year running average of recent discoveries, including estimates for fields under development and putative discoveries, is shown below. Current average for deep and ultra-deep is 60mmbbls and falling, but this includes gas and NGLs; for C&C only it would be 45 to 50. Allowing for continued decline, which seems unlikely to be reversed in the medium term given recent history of successes, 30 to 40 might be a better range. It is unsurprising that the uptake and success rate of leasing has been falling as there is close contact between the industry and the regulators and the best land tends to be offered first plus many of the tracts have been offered before and been left unsold or subsequently ceded.
Multiplying the range for the expected number of producing leases by the range for discovery size gives expected future reserve discoveries of 2.4 to 8Gb, but with a likely median closer to the low end. Again a value around 32Gb looks reasonable.
As part of the 2016 initiative for the final leasing program BOEM released estimates for recoverable reserves in the tracts to be offered (half of which have already been auctioned). For C&C these were 2.1Gb for $40 oil, 3.5 for $100 and 5.6 for $160. I think trying for accuracy like this is a bit ridiculous when there are so many future unknowns – e.g. in the present environment operators are asking for and getting up to 40% CAPEX cuts and deep-water rig day rates have collapsed – but it is what the models churn out and it does indicate the complexity and/or reliance on existing infrastructure of the putative developments.
Project Schedules
The chart above shows the cumulative number of lease sales, first discovery in each lease and first production against the year for the main field against which the lease is listed by BOEM, for deep-water start-ups. The curves are categorized according to depth of water and field size (small fields are less than 20mmboe, medium fields are 20 to 100mmboe and large those above 100mmboe). The numbers are normalized so they are directly comparable. The time to discoveries has been narrowing, probably as technology has improved, down to about eight years. The time from discovery to first production, which for the main field would require development of a platform hub, has been pretty steady at nine years. Deep and ultra-deep fields take about the same time; small fields are done in five to six years, medium fields in nine to ten, and larger fields in just over ten. Appraisal and development time is dependent on human factors: engineering and construction man-hours, planning and regulatory processes, procurement cycles, installation windows etc., and are unlikely to shorten but could slow as supply chains shrink and skilled labour is lost.
COVID19 and Tropical Cyclone Shut-ins
The effects of oil and gas prices, and possibly manpower shortage, after the Covid19 lockdowns had a dramatic effect on the number of inactive wells (i.e. shut-ins) and production in May. Mostly it affected shallow wells with 293 extra wells inactive compared to 53 in deep water. In June the additional inactive count had reduced to 239 for shallow and 7 for deep. It’s possible that some shut-ins allowed planned maintenance work to be bought forward and so avoid net deferment.
Hurricanes show only minor ripples on the inactive numbers but bigger impacts on production, probably because they only last a few days but tend to affect larger normally-attended deep-water platforms. According to BSEE figures Cristobal knocked off a monthly average of 141kbpd of oil and 34kboed gas in June, Laura/Marco 415kbpd (78 for gas) in August, Laura/Sally 152kbpd (33 gas) in September and in October Delta/Zeta deferred 593kbpd (103 gas) . There were significant pauses in drilling too, for both platform rigs and MODUs, with a total of 303 drilling days lost.
At the time of writing in early November Zeta has just exited (contributing 56kbpd C&C and 8 gas off-line for the month) and TS Eta is threatening some further disruption. This year has been particularly active because of continuing high and rising ocean and Gulf water temperatures, a mild La Nina to reduce Atlantic wind shear and possible effects from lower aerosol levels. Hurricane season peaks in the firs weeks of September and continues through November, but is tending to start earlier and remain active longer as climate change accelerates.
Bottom Up Projection Estimates
Even without the pandemic and weather interruptions it is unlikely that 2020 production would have exceeded or even matched 2018 or 2019, Production had a local peak in August 2019 and has been trending down since. Several of the large, recent start-ups reached plateau in or before 2019 and the brownfield work switched from increasing producing production to maintaining it (e.g. Atlantis Phase II, Thunder Horse South Phase II, St. Malo Water Injection). Additions of producing completions have declined while older wells continue to be exhausted, so the overall number of producing completions has been declining since late 2019, with a large Covid related drop in May.
Many of the medium to large fields are showing increasing water breakthrough to the extent that it is probably limiting processing capacities as well as well flow rates (Atlantis, Shenzi, Mars-Ursa fairly steady at 3 to 4% increase per year; Gunflint, Marmalard, Dantzler, Cardamon faster at 15 to 25%; Lucius and Heidelberg with continuous issues; several small tie-backs showing immediate and rapid breakthrough; Jack/St. Malo just beginning; other large fields starting to rise as production increases plateau).
Two fields are continuing ramp up: Big Foot has two of eight producers on-line and bring another one on every seven to eight months at about 13kboed, but it also needs three water injectors; and Appomattox has 6 of 15, and with two rigs operating adds one every 4 to 5 months at 10 to 33kboed so far. All the new wells appear to start declining soon after start-up at around 15% per year but there is limited data so far. Some tie backs are planned and likely to proceed eventually, the largest are: PowerNap to Olympus (35kboed), Leon to Lucius and (with questionable timing as it is for the bankrupt Fieldwood) Katmai to Tarantula.
From 2021 onwards some larger fields will begin to ramp-up: Argos (Mad Dog II) with 140kboed capacity, Vito at 80kboed, Kings Quay at 80kboed (but only 50 utilised without more tie-ins) and Anchor at 80 to 100kboed. The GoM doesn’t utilize much pre drilling even for sub sea completions, and the current oil price and slow down militates further against so these will take at least a year to ramp up. There are many fewer near field tie-ins and in-fill drilling developments than 2017 through mid 2019 so it is hard to see production not taking a considerable dip, at least through 2022, given the decline rates of the fields.
For the latter half of the 2020s there are some large developments in the (now delayed) queue for FID: Whale, probably at 80kboed; Ballymore at 100; and North Platte at 75kboed; plus a number of significant discoveries in appraisal: Dover, Shenandoah, fields associated with the proposed Tiber hub, Blacktip; and some possible extensions: Atlantis Phase III, Julia II, Mad Dog III, various fields around Appomattox. However, given that average project development time is around five years and the FIDs will probably need to wait for a price recovery, then any additional production is some way off.
Recently Hess presented at an energy conference and stated that it would not pursue near field prospects – these days often referred to as infrastructure led exploration or ILX – until WTI price reaches $50. Also presented was a list of breakeven prices developed by RH Energy Consultancy. These were developed in January 2018 and so probably are a bit high for current conditions given about a 5% fall in the IHS upstream capital cost index, a collapse in rig rates and, likely, a bit for process “right sizing”. Some prices given were, for projects in operation: Heidelberg – $53, Appomatox – $60, Stampede – $62, Big Foot – $71; those in development: Vito – $44, Anchor – $62; and those in appraisal: North Platte – $ 59 and Shenandoah – $65. These are just breakeven floor prices without allowing for company profits, contingency etc. and would probably need to be exceeded for around six months before FIDs were to be reconsidered. Therefore, overall, there seems to be a low probability for much short or long cycle development in the near future even given a miracle vaccine and rapid economic recovery.
In the longer term the trends for wildcat exploration and discoveries show: a diminishing inventory of prospects; a slow decline in the number of wells drilled over the past few years before the sudden dive this year; a fall in number and (probably) the size of discoveries; and a move to ultra-deep water, frequently high-pressure-high-temperature fields and often requiring innovative 20ksi completions, and hence relatively more expensive and complex. For future wildcat discoveries first oil is at least five and up to fifteen years after discovery (i.e. maybe seven to twenty five years from now). A more likely source for undiscovered oil is near field exploration around the hubs currently under development or appraisal, but these can only be tied in once the originally developed fields start to decline and processing capacity becomes available – hence still about seven years ahead at minimum. Additional issues will come from labour resource availability. The industry was suffering from a greying workforce and being an unattractive environment for new graduates. Now most E&Ps are laying off large numbers, many of whom will be voluntary retirements of senior personnel. The service industries are cutting back, the EPIC contractors are pulling out of competitive bidding and the deep-sea drillers are all facing bankruptcy.
Low Case
The low case is based on current BOEM reserve estimates for producing fields except for a few that are obviously underestimated given the present decline rates (e.g. Big Bend should be exhausted by now based on the production since 2018 but is still going strong). All are assumed to start declining immediately except for a few from BP and Murphy, which have parts of future production profiles available from recent company presentations and where the estimated declines would be significantly lower than the observed well declines, in which cases I increased plateau periods and/or design throughputs. The fields in development and planned have reserves based on available data, e.g. company press releases, Rystad etc., or approximated from announced production rates or tie-in details (number of wells, flow line sizes, spare surface capacity) but at the low end of possible ranges especially for those still at concept appraisal. Future discoveries are guessed as a reasonable looking Verhulst curve that fitted the top down curve estimated from reserves (above) allowing for expected discovery and development schedules.
The lines indicated by isolated annual markers show the forecast from BOEM in 2016. I don’t know exactly what BOEM meant by ‘contingent’ – presumably on price in some way – but the stacked reserve plus contingent numbers closely represent all fields currently on production or in development. It matches well the middle case but is above the other cases. I don’t think there is any chance of new discoveries, including those awaiting an FID to be so declared, keeping production as high as indicated.
Mid Case
The middle/median case is similar to the low case except reserve growth is allowed on mature shallow and deep fields, and some of the large newer fields better to match recent decline rates, and the planned fields use median range estimates.
High Case
The high case uses higher reserves on several fields through lower decline rates on those that have apparently excessive declines based on the BOEM reserves, and using extended plateaus and lower declines for both the larger recent start-ups and those in development or planned. I haven’t changed te start-up timing between the cases but if conditions encouraged high production it is likely some of the putative planned projects would be advanced. The opposite will also happen – if the development environment remains negative then projects will be delayed and some assets may become stranded as aging nearby infrastructure, on which development depends, becomes uneconomic to maintain.
Even with this case it is difficult to see how a significant drop in production over the next five or so years can be avoided, unless the E&Ps have knowledge of some large projects still ramping up or a number of highly prospective near field opportunities that they have not shared. On the other hand there is any number of possible geopolitical events that could further reduce production even on the lower cases (e.g. leasing/drilling bans, continuing economic recession, skilled labour shortages, infrastructure ageing, new pandemic issues, disruption to material and equipment supplies, worsening climate disruptions).
Off Topic Finish: Arctic Ice Retreat
2020 will show the second lowest minimum volume and area of Arctic Sea ice after 2012. It continues a general trend in decline with first place 2012 a bit of an outlier but likely to lose its record in the next few years even without the sort of exceptional weather as seen in 2012 and 2007 (another unusually low year).
The trend can be more dramatically shown by looking at the amount of time the volume in the Arctic Sea’s various regions drops below some threshold. Since 2000 some regions have started going ice free in summer, and now have rising numbers of ice-free days each year. Others are just approaching ice free conditions but the trend of increasing days below a certain level is still clear.
Ice free conditions represent a positive feedback and possible tipping point as, once present, all the sun’s heat goes into raising water temperature (sensible heat) rather than melting ice at constant temperature (latent heat). Volume is closely related to area and as it reduces so too does the albedo allowing more radiation to be absorbed, maybe especially relevant in the peripheral seas that get more direct sunlight radiation flux for longer than the central basin.
The y-axis shows days per year at or below a threshold volume (by PIOMAS). The Bering Sea and Hudson Bay thresh holds are set as ice free; the other peripheral seas have thresh holds at 10-20% of the average volume from 2000 to 2019. The Central Arctic Basin is set at 50% and the Canadian Archipelago at 25%. The trend gradients for all are close, though this may just be a result of the thresholds I’ve chosen. The Greenland Sea is slower but I think there are two opposing effects: increased melting, which is now dominant, and transport from the thinner and looser CAB ice, which is now diminishing as the overall summer volume falls.
This year is likely to extend or accelerate the trends for all except the Beaufort and Greenland Seas. If they continue at the same rates it seems likely that some of the peripheral seas will be ice free all year round before the CAB goes ice free in September.
Through 2021 the federal waters of the northern Gulf of Mexico (OCS) have cumulative production of 23.4 Bbo and 193 Tcf. The deepwater (water depths > 1000’ as defined by BOEM) has produced 10.2 Bbo and 23.5 Tcf while the shelf has produced 13.2 Bbo and 169.5 Tcf. From a BOE standpoint, the GOM has primarily been a gas province, and the bulk of that production has come from shelf fields. While the shelf has produced more cumulative oil than deepwater, over 90% of current oil production comes from deepwater fields.
First production from the OCS occurred in 1947. First deepwater production was in 1979 from Shell’s Cognac field in 1022’ of water. GOM oil production in December 2021 was 1.69 mmbopd as per BSEE. As Ovi says in his monthly updates, if GOM were a state, it would be the 2nd leading oil producing state in the US, only behind Texas.
Brief history of GOM gas production
GOM gas production peaked in 1997 at 14.4 bcf/day and has been declining ever since. Current gas production is about 2 bcf/day.
Figure 1 – GOM gas production, with shelf and deepwater broken out. Data from BOEM.
Figure 2 – US gas production (EIA data) with breakout of GOM (BSEE data) and Texas (EIA data).
One of the more significant seismic advances occurred in the late 70s-early 80s. This is when geophysicists recognized that a gas accumulation can often generate an anomalously high-amplitude seismic response, or a “bright spot”. Intentionally looking for bright spots, and high grading prospects based on bright spot quality was a big contributor to the abundance of gas produced in the 80s, 90s and 00s.
Also, 3D seismic became more and more common from the late 80s onward to where now almost the entire GOM is blanketed with 3D surveys. Any current drilling activity is supported by 3D.
Table 1 – 30 largest gas fields in the GOM through 2019. Data from BOEM.
The table above shows the 30 largest gas fields in the GOM through 2019. 29 have cumulative gas production over 1 tcf. 27 are on the Louisiana shelf, 1 is on the Texas shelf and 2 are in deepwater. 24 are classified as gas fields and 6 as oil fields. The field with the largest remaining gas reserves as per BOEM is actually a deepwater oil field, Shell’s massive Mars-Ursa complex.
Figure 3 – Map showing the distribution of the 30 largest gas fields in the GOM. Numbers refer to fields in Table 1. Many of the protraction areas are labeled. The shelf protraction areas all have “south additions” which are not labeled (e.g. Ship Shoal area, south addition is south of the labeled Ship Shoal protraction area.)
The map above shows the 30 largest GOM gas fields. Many of them are located on the Louisiana shelf. The thickest sediment accumulations in the GOM occur in this area. I suspect the burial depth of the source rocks has contributed to the gas abundance in this area – meaning the source rocks are buried deeper than the oil window, into the gas window. In addition, there also are numerous shallow biogenic gas accumulations that have been produced.
In conclusion regarding gas: Will current high natural gas prices cause a resurgence of gas drilling in the GOM? Maybe a bit, but nothing too substantial. I just don’t think the geology supports it. One interesting thing to consider though, is that there is a deep shelf gas exploration play that never really took off before prices crashed. Perhaps this will be revisited.
Update on GOM oil production
Figure 4 shows GOM oil production, with shelf and deepwater broken out. Deepwater production surpassed shelf production in 2000, and it has been dominant ever since. Based on these trends, I predict in 2027 or so deepwater cumulative oil production will exceed shelf cumulative oil production.
Figure 4 – GOM oil production with shelf and deepwater broken out. Data from BOEM.
Table 2 shows the 30 largest cum oil fields in the GOM, with production through 2021. 12 of the fields are in the deepwater and 18 are on the shelf. Shell’s Mars-Ursa complex is by far the largest field, but it includes multiple fields. In BOEM’s accounting, they have combined a number of additional deepwater fields including Tahiti and Caesar-Tonga, and King and Horn Mountain.
Table 2 – 30 largest GOM oil fields. Data from BOEM. Estimated reserves are mine – determined by subtracting 2020 and 2021 production from BOEM’s yearend 2019 reserves.
Figure 5 shows the distribution of the 30 biggest GOM oil fields. Note how a great number of the shelf fields are concentrated just offshore southeast Louisiana over to the Mississippi River delta. These fields are associated with, and adjacent to, the Terrebonne trough. This prolific oil trend continues into the onshore and state waters portions of southeast Louisiana and is one of the sweetest of sweet spots in the greater GOM basin. 12 of the 30 biggest GOM fields are in this trend with cumulative production of over 3.6 BBO, and this doesn’t include the onshore or state waters fields, or the numerous smaller fields. (Technically, the east edge of the Terrebonne trough is roughly the west edge of the Mississippi River delta. For this discussion I’m extending further east to include the Main Pass fields.)
Figure 5 – Map showing the distribution of the 30 largest oil fields in the GOM. Numbers refer to fields in table 2.
Gulf of Mexico oil producing sweet spots
As one can see from the 2 maps above, there are some patterns to the distribution of both the biggest gas fields, and the biggest oil fields. They are not uniformly distributed around the offshore GOM basin. I define a Tier 1 oil sweet spot in the offshore Gulf of Mexico as an area that can be described geologically as having numerous petroleum system element similarities (such as similar structural styles, similar age reservoirs and probably a common source rock) and where the cumulative oil production, or anticipated cumulative oil production, has exceeded, or can be reasonably expected to exceed, 2 billion barrels. A Tier 2 sweet spot can be expected to have cumulative production between 1 and 2 billion barrels of oil
The previously discussed Terrebonne trough is a Tier 1 sweet spot. Cumulative production from just the biggest fields is over 3 billion barrels. It is very mature and future production will be, in my opinion, negligible. 12 of the 30 biggest fields are in this trend, and they have estimated remaining reserves of 44 MMBO. Many of these fields are salt dome related, reservoirs range in age from shallow Pleistocene to deep Miocene, and most of the pay is normally pressured. Production from this trend began in the 1940s.
The remaining Tier 1 sweet spots are in deepwater. One is the subsalt Miocene trend of southeast Green Canyon. Cumulative production from this trend is 1.9 Bbo. Production from this trend started in 2005 when Mad Dog and K2 came on line. BOEM’s remaining reserves for these fields is 692 MMBO. Four of the biggest GOM fields – Tahiti-Caesar/Tonga, Atlantis, Shenzi and Mad Dog – are in this trend. The most significant remaining project to come on line will be Mad Dog 2 where first oil is expected in late 2022. (I place Murphy’s recent King’s Quay project just to the north of this sweet spot.) These fields are all either completely, or at least mostly, subsalt. The reservoirs are all Middle to Lower Miocene deepwater channels or fans and the structures are either large faulted 4-way closures or 3-way closures against salt. I expect the ultimate cumulative oil production from this trend to be close to 3 billion barrels.
Another Tier 1 sweet spot is the greater Mars-Ursa Basin. BOEM lumps Mars, Ursa and a few nearby fields into one entity, which has cumulative production of 1.6 BBO and is clearly the biggest field in the GOM. If you include the nearby fields – Crosby, Europa, and Kaikias – cumulative production to date from the greater Mars-Ursa basin is 1.8 BBO. Production from this trend started when Mars came online in 1996. Remaining reserves for this trend are 843 mmbo, with most of those reserves split between Mars-Ursa and Vito. The most significant remaining project to come online in this trend is Shell’s Vito where first oil is expected in late 2022.
The remaining Tier 1 sweet spot is the Wilcox in Keathley Canyon, Walker Ridge and Green Canyon. Even though this sweet spot covers a pretty large area, the prospects share petroleum system elements such as similar reservoirs and source rocks. This trend includes the Wilcox producing fields outside of the greater Perdido Fold Belt area, and a number of developments set to come on line within the next few years. While cumulative production to date for this sweet spot is only 468 mmbo, I expect the midcase EUR to be 2-3 Bbo.
For those interested, below is a link to a recent Wilcox update I did.
Figure 6 – My interpretation of Tier 1 and Tier 2 oil sweet spots. Tier 1 – ultimate cum oil > 2 Bbo. Tier 2 – ultimate cum oil 1-2 Bbo
The Greater Perdido fold belt area in Alaminos will become, I believe, a Tier 2 sweet spot. Cumulative production to date is 260 mmbo, from Shell’s Perdido’s host facility, but there are 3-4 future projects with most likely recovery in the 800 mmbo to 1.2 bbo range. Those include Whale, Blacktip, Leopard and Blacktip North.
I’m currently not convinced that the Norphlet trend will ultimately become a Tier 2 sweet spot, although this is subject to change. This trend would be just south of field 11 on Figure 6 above. As per an assessment done by Talos Energy, as of 2019 23 Norphlet exploration wells had been drilled and 9 were classified as discoveries. Since then, only Shell’s Appomattox and Vicksburg discoveries have come on line via production to a new facility, (with cumulative production through 2021 of 71 mmbo) and Chevron’s Ballymore will get developed via a tieback to nearby Blind Faith. No development plans have been announced for any of the other discoveries, which were all made by Shell. If some of these do end up getting sanctioned, then I think the cumulative production from the Norphlet can exceed a billion barrels.
The greater Thunderhorse area, fields 9 and 19 in figure 6, is another area that I’m not convinced yet is going to have cumulative production over a billion barrels. BP’s Thunderhorse and Thunderhorse North have cumulative production to date of 583 mmbo, and BOEM’s remaining reserves are 211 mmbo. Current production from the Thunderhorse fields is about 100 kbopd, and BP anticipates production increasing to about 200 kbopd over the next few years as the Thunderhorse South project comes on line, but I believe the reserves for that project are already included in BOEM’s assessment.
One could argue that numerous shelf protraction areas outside of the Terrebonne trough fields could be classified as Tier 2 sweet spots. For example, the Eugene Island fields have the largest oil cum of any shelf protraction area of 1.7 Bbo. I have decided to not include that area, for example, because the fields don’t share enough petroleum systems elements to warrant being classified as a sweet spot. Also, since my focus here is more on future GOM production and ultimate EURs, the shelf protractions are long past their peak in oil production and won’t, in my opinion, be contributing much in the years to come.
How much of a difference will offshore lease sales make?
Some have argued that the lack of offshore lease sales will have a big impact on future GOM production. For example, the National Offshore Industries Association has said GOM production could be reduced by 50% by 2040 if the offshore lease sale ban continues. I’m not quite as pessimistic. Oil production could be reduced 50% by 2040, but, if that happens, it will be due to geology as much as due to a lack of lease sales. It’s a question to me of how many substantial prospects are there out there that industry has missed. The Gulf of Mexico has had annual area-wide lease sales for most of the years going back to 1983. (Before 1983, leases had to be nominated by industry prior to a sale to be considered in a lease sale. Far fewer leases were available for industry to bid on in these pre-1983 lease sales.) That’s almost 40 years of area-wide annual lease sales.How many bites at the apple does industry need? Many of the leases that have been getting picked up by industry in recent sales have already been leased at least one time, and then they have been dropped because either a dry hole, or non-commercial discovery was drilled, the prospect on the lease didn’t stack up against the inventory of prospects the operator had at the time, or it was picked up as protection acreage. These clearly aren’t, and never were, the most prospective leases in the Gulf. The exceptions to this are that new play concepts and advances in seismic imaging technologies can make non-prospective leases prospective. I believe this has resulted in, for example, the recent discoveries Shell has made in the subsalt portions of the Perdido fold belt. I haven’t seen evidence of any more examples of this. And these prospects are all going to be deep, difficult to appraise, and expensive to develop.
Now one could argue that the industry hasn’t had the technology to drill and produce from the deepest high temperature and high pressure plays for the last 40 years. Fair enough – those technologies have been developed over the last 10-15 years or so, and, in fact, the first HT-HP field is yet to come on line, notably Chevron’s Anchor. But again, if there are prospects like that still out there, they will be deep, difficult to appraise, and expensive to develop. Another HP-HT field that was thought to get sanctioned, TotalEnergie’s North Platte, was recently deferred because it didn’t stack up against their queue of other global projects.
Also, most oil companies have enough undrilled leases in their current inventories that they can continue drilling exploration wells for at least 2-3 years. After that, industry will probably start running out of exploration prospects, but the question is: Are there still attractive undrilled prospects out there, after 40 years of lease sales, that industry has just over-looked?
(In my review of recent GOM discoveries, I found that the most recent lease sale where a block was acquired, and a recent significant discovery was made was the August-2017 sale. Shell acquired Alaminos Canyon 336 in that sale, and in early 2021 made the Blacktip North discovery on that lease. Since then, there have been 6 sales – 2 in 2018, 2 in 2019 and 2 in 2020. I’m not aware of any discoveries that have been made on any of the leases picked up in these sales. The one in November 2021 was the on-again/off-again sale. My point here is that industry has had ample opportunities to pick up leases.)
Of late, industry has been focused on near-field exploration because of quick turn-around. A discovery made near existing infrastructure can be tied back and brought on-line much more quickly than a frontierish type of discovery that needs a new facility. Almost always these near field discoveries are small. If those same volumes were discovered in an area lacking infrastructure, it would be called a non-commercial discovery. There still are, probably, a queue of these types of discoveries remaining to be made, but, this queue is also getting smaller and smaller.
In my projections of future GOM oil production, I don’t make any specific considerations about whether future lease sales happen or not, although in my high side estimates, future lease sales are baked in (and the related new discoveries of mostly small but some decent sized reserve ranges), while in my low side estimates, there are no future lease sales, or, at least, no significant discoveries if lease sales continue.
Now if the entire eastern GOM were made available for leasing, this story changes. But there are no signs of that happening.
Estimate of future production and EUR ranges from the GOM
The queue of high impact projects set to come on line in the GOM over the few years is quite attractive and includes King’s Quay (just came on line), Mad Dog 2 (2022 first oil), Vito (2022), Anchor (2024) and Whale(2024). All 5 projects have dedicated new facilities with capacities ranging from 75 to 140 kbopd. Table 3 shows those these 5, plus 2 other projects, that should come on line before 2025 with most likely reserves of at least 100 mmbo. 6 of these developments include new facilities. The last, Thunderhorse South, will be tied into BP’s Thunderhorse facility. Note that the total new facility capacity is over 700 kbopd.
Table 3 – 7 projects with at least 100 mmbo of most likely reserve potential that will be developed in the deepwater GOM with first oil before 2025,
The new production coming from the projects above will result in a new annual peak in GOM oil production between now and 2030 or so, and it is possible this peak will exceed 2019 peak of 1.9 mmbopd.
After these projects, the remaining significant identified projects are in Table 4.
Table 4 – Remaining significant identified projects in deepwater GOM. FIDed projects will get developed. Development decisions have not been made on the others. Note that TotalEnergies recently withdrew from North Platte.
I believe the era of significant deepwater megaprojects is nearly over in the GOM. After the projects referenced above come on line, I don’t see much more megaproject activity in the GOM. The link below is to a recent SPE article by Blake Wright on this topic.
As mentioned in the article above, part of the reason for this is because of the lack of significant discoveries. My Figure 7 below, from Wood Mackenzie, and also referenced as Figure 3 in Wright’s article, shows how discovered volumes in the GOM have been dropping over the last 4-5 years. Some would argue this is because of low oil prices, and that discovered volumes are low because of fewer exploration wells. I disagree – I think it’s primarily because of geology. But, with the current high oil prices, let’s see if operators start making more significant discoveries. If industry starts seeing year after year of 1 Bbo+ in discovered reserves (or even 500 mmbo per year), then I will have been proven wrong. (But what about the lack of lease sales discussed above? If the lack of discoveries is due to the lack of drilling because of low prices, as some think, then companies should have a good queue of undrilled exploration prospects to drill now with high oil prices.)
Figure 7 – from Wright SPE article referenced above.
Figure 8 shows my low-mid-high range of predictions of future production from the GOM. I have also included a recently released EIA estimate of GOM production out to 2050, from their March 2022 Annual Long Term Energy Outlook. The EIA estimate stopped at 2050, so I started decreasing their production at the annual rate of 100 kbopd until I got down to 0 production.
Figure 8 – GOM oil production from 1980 to 2021 and my projections out to 2080 in mmbopd. Included is my edited EIA estimate, which takes their projection to 2050, and then reduces it by 100 kbopd per year til 2064.
In all cases, I see production increasing to a new peak. This new peak ranges from 1.7 to 2.18 mmbopd (EIA estimate), and in both my high side case and the EIA case, the previous peak from 2019 is exceeded.
EURs ranges are 31, 36 and 42 Bbo in my low-mid-high cases, and the edited EIA EUR is 46 Bbo. Among other things, the low side outcome assumes either lack of future lease sales, or lack of material discoveries from future lease sales. The upside case assumes numerous significant discoveries from either industry’s current lease inventories, or from leases picked up in future sales.
BOEM’s UTRR (Undiscovered Technically Recoverable Resources) from their 2021 update for the entire GOM is 29.6 Bbo (from Jan. 1, 2019 data). This is down from about 48 Bbo in the 2016 assessment. Significant discoveries since then include Blacktip, Leopard, Monument and Blacktip North. Any other announced developments are from discoveries made prior to Jan 1 2019. If you include just the Central and Western GOM, their UTRR drops to 24.7 Bbo. 24.7 Bbo plus the 21.4 Bbo cum at the end of 2018 give a total EUR for the GOM of 46.1 Bbo. That is, in my opinion, pretty high, even for a high side estimate, but it is in line with my edited EIA EUR.
For those interested, comparison to my 2016 GOM production post.
This post is an update to one that I did as SouthLaGeo back in 2016. Below is a link to that post. I initially promised Dennis I would do this update in 2018, but,,, oh well. If I keep this pace up, my next update would be in 2028. Given the divergence in the production profiles in 2028, that would be a very interesting update. Even a 2025 update would be interesting.
I include this primarily to show how my EURs and production profiles compare, but for those interested, there is more geology in the 2016 post. Below is a chart showing my low case, mid case and high case projections from 2016 included with the data from the chart above. I know the chart is busy. Hopefully you can see through everything.
My 2016 EUR ranges were: low case 30 Bbo, mid case 37 Bbo, high case 47 Bbo. Interestingly, my mid and low EUR ranges have not changed too much, but my high side has come down a fair bit. The profiles in all cases certainly have changed. I clearly under-predicted future production, and my current profiles show production dropping off more quickly.
Figure 9 – Production profiles from my 2016 posting as SouthLaGeo compared to 2022 profiles.