These first charts are taken from the EIA’s Monthly Crude Oil and Natural Gas Production. The data are through June 2018 and is in thousand barrels per day.

US C+C production was up 231,000 barrels per day in June to 10,674,000 bpd, an all-time high.
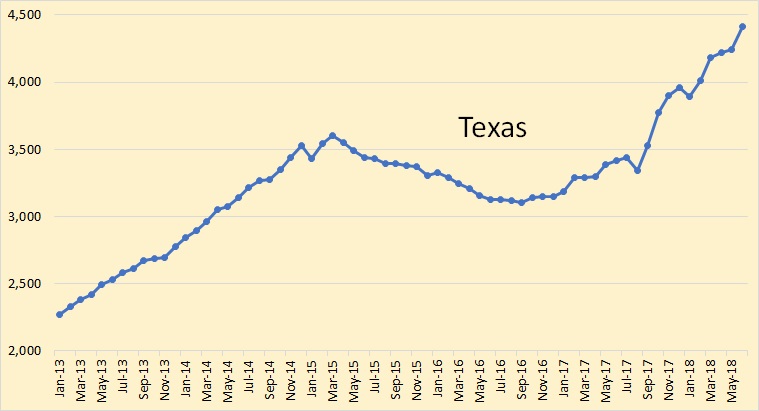
Texas was up 165,000 barrels per day in June to 4,410,000 bpd.
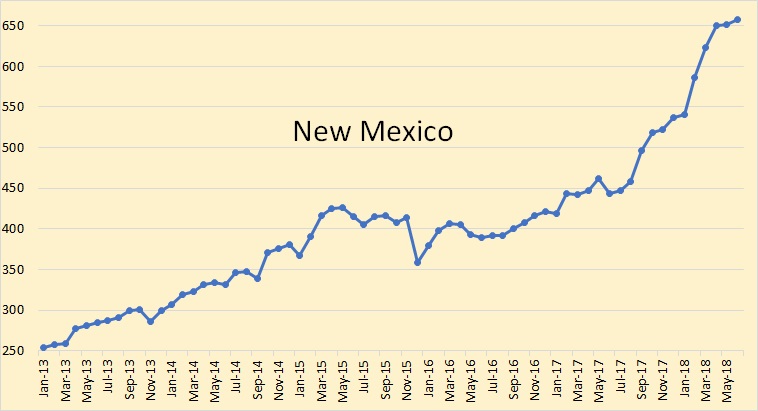
New Mexico was up 5,000 barrels per day in June to 657,000 bpd. The Permian extends into New Mexico.
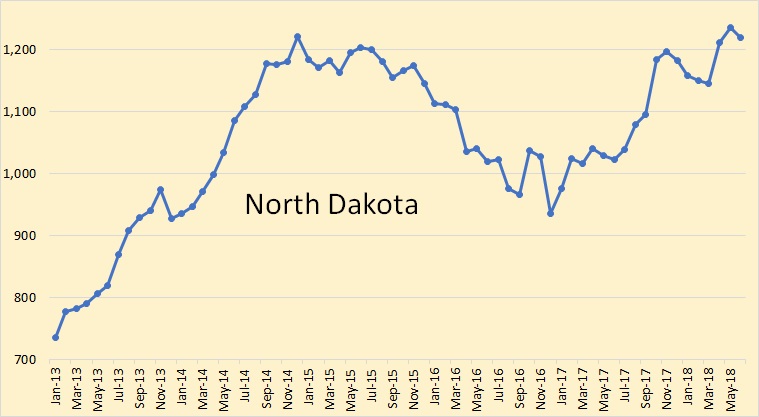
North Dakota was down 16,000 barrels per day in June to 1,220,000 bpd.
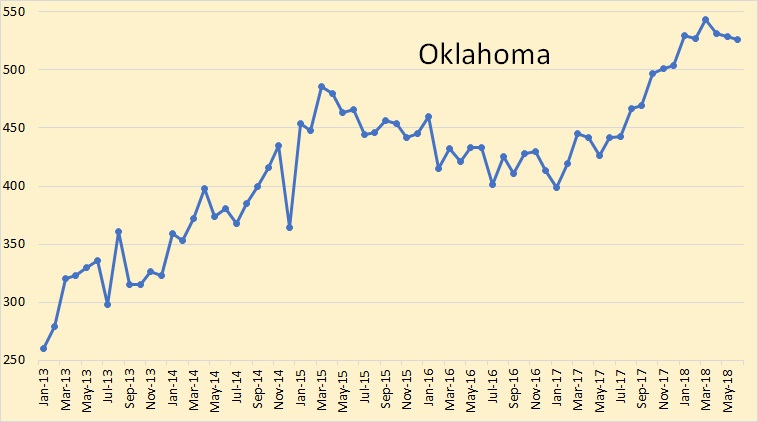
Oklahoma was down 3,000 barrels per day in June to 526,000 bpd.
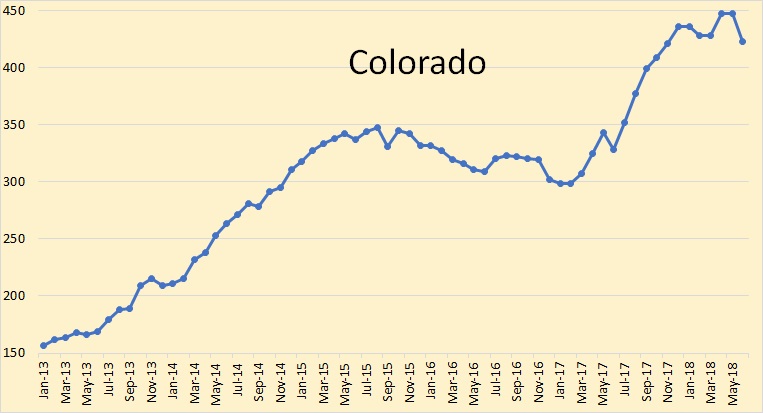
Colorado was down 24,000 barrels per day in June to 423,000 bpd.
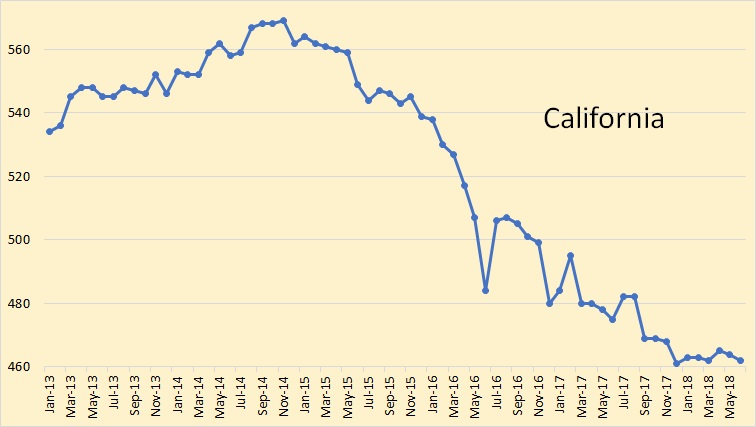
California was down 2,000 barrels per day in June to 462,000 bpd. California peaked in February of 1987 at 1,109,000 bpd.
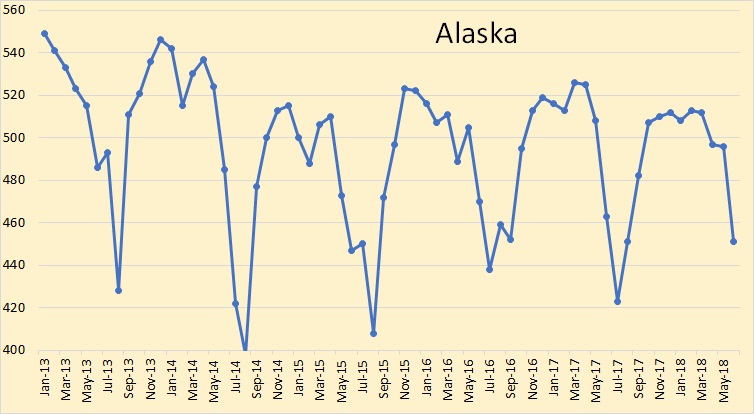
Alaska was down 45,000 barrels per day in June to 451,000 bpd. June, July, August, and part of September are the prime maintenance months for Alaska. The maintenance includes pigging the pipeline and overhauling the pumps along the pipeline.
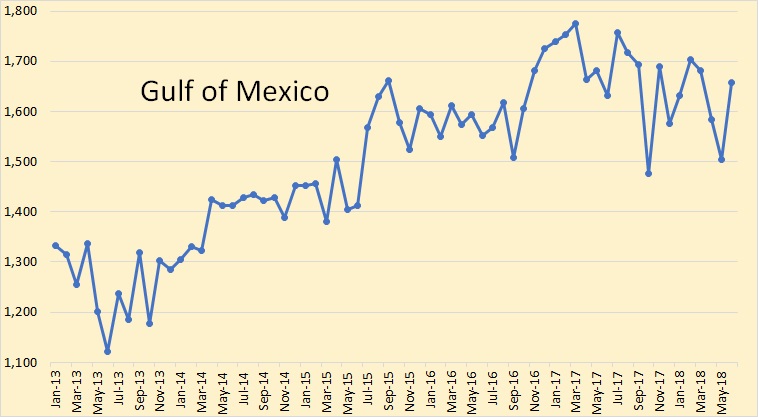
The Gulf of Mexico was up 154,000 barrels per day in June to 1,658,000 bpd. Just a couple of years ago the EIA was predicting the GOM to be at almost 2 million barrels per day by now. I really don’t think that is going to happen anytime soon.
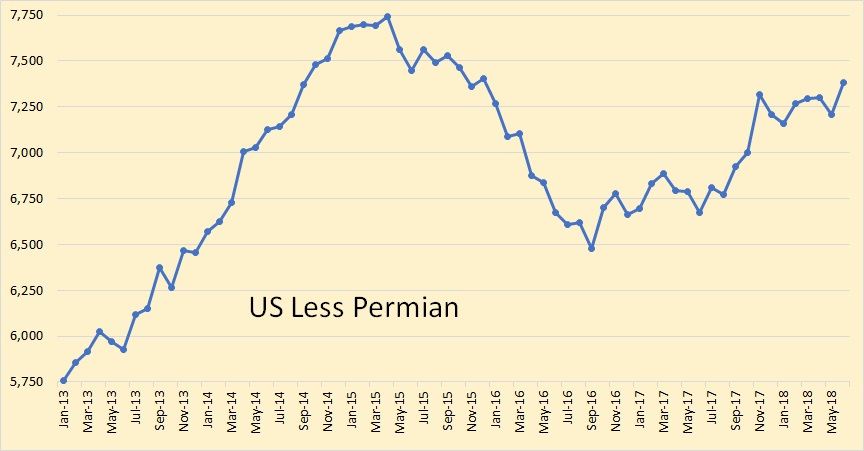
Using the EIA’s Drilling Productivity report for Permian production, through June, the US less the Permian, is still 357,000 barrels per day below the peak reached in April 2015. It is obvious that the Permian is the driving force behind the major increase in US production.
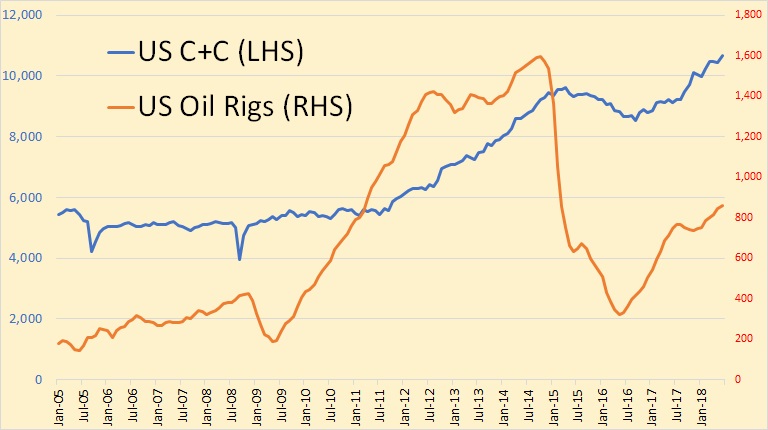
The above data is through June 2018. This is oil rigs only, no gas rigs.
The following data are from Table 11.1b World Crude Oil Production: Persian Gulf Nations, Non-OPEC, and World. It is through May 2018 and is in thousand barrels per day.
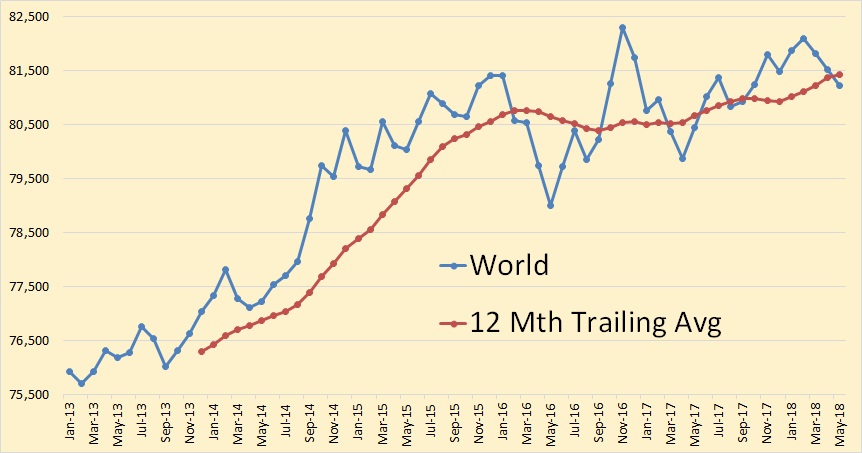
The numbers here are only through May 2018. We are obviously on that proverbial bumpy plateau. A prediction! I see world C+C production peaking around July or August, remaining level to slightly down for about two years, then begin a steady decline.
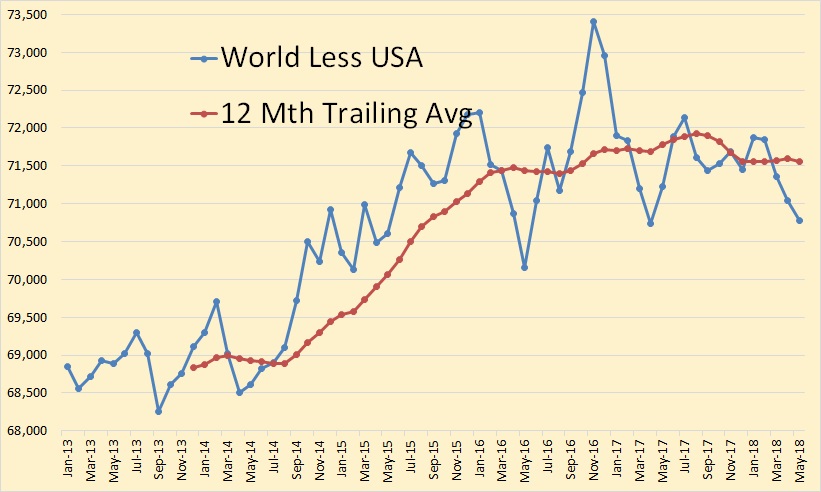
It all depends on the USA. The US, and to a lesser extent Canada, are the only nations that are still really growing by any significant amount. The US has increased production by 1.6 million barrels per day in the last 12 months, June 17 to June 18. Total world has increased less than half that amount.
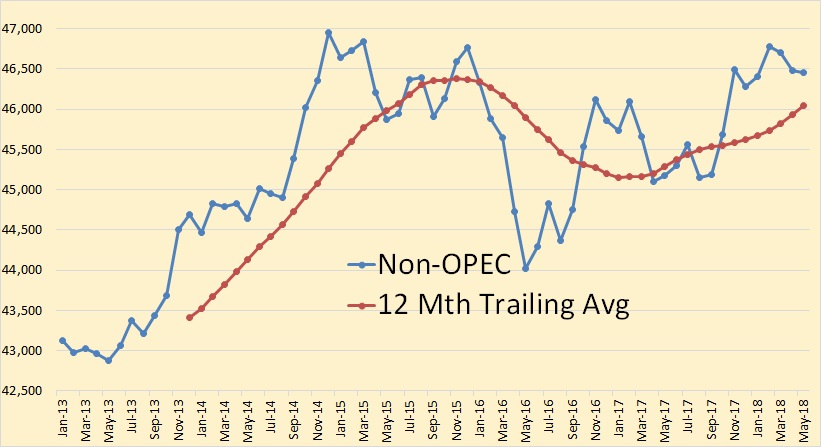
Non-OPEC is half a million barrels below its previous peak of December 2014. It may breach that peak later this year, but not by much.
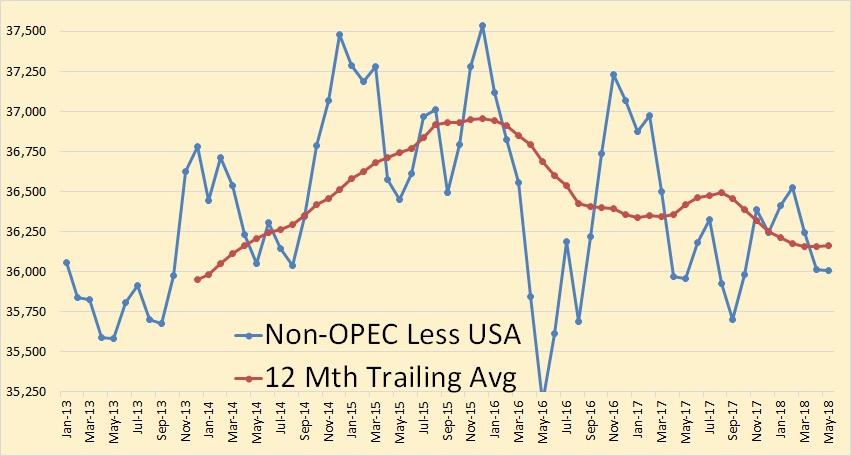
Non-OPEC less USA is 1.5 million barrels below its previous peak of December 2015.
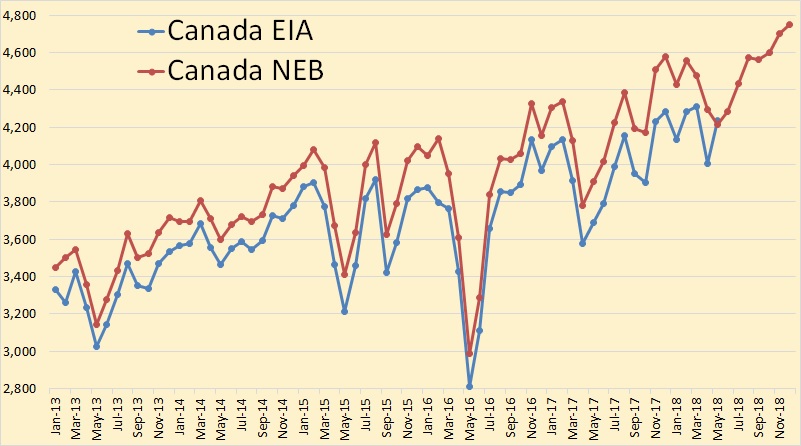
Canada EIA through May with Canada’s National Energy Board’s projection through December 2018.
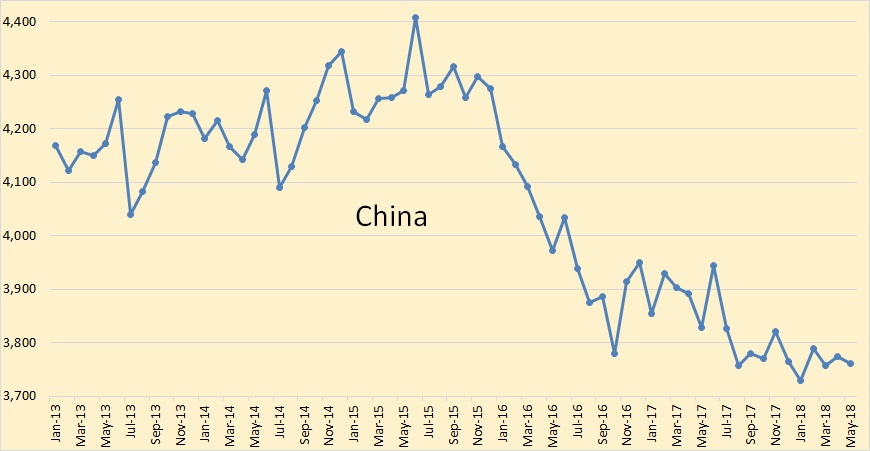
China has slowed its decline somewhat.
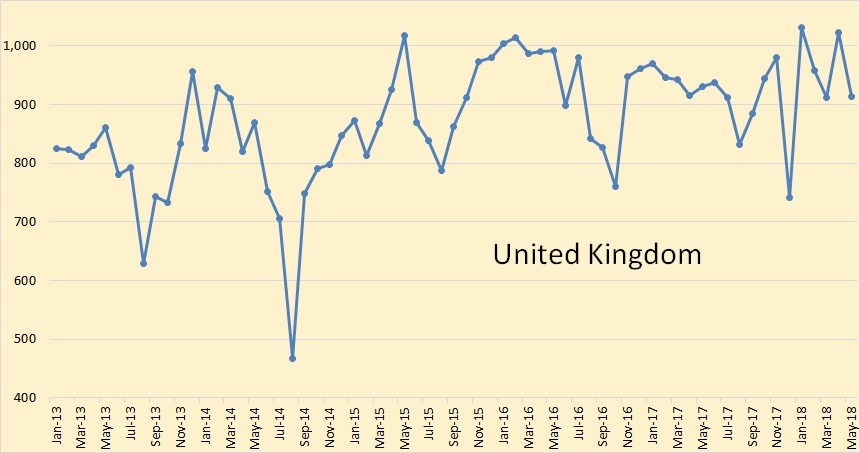
The United Kingdom has, for now anyway, completely halted its decline.
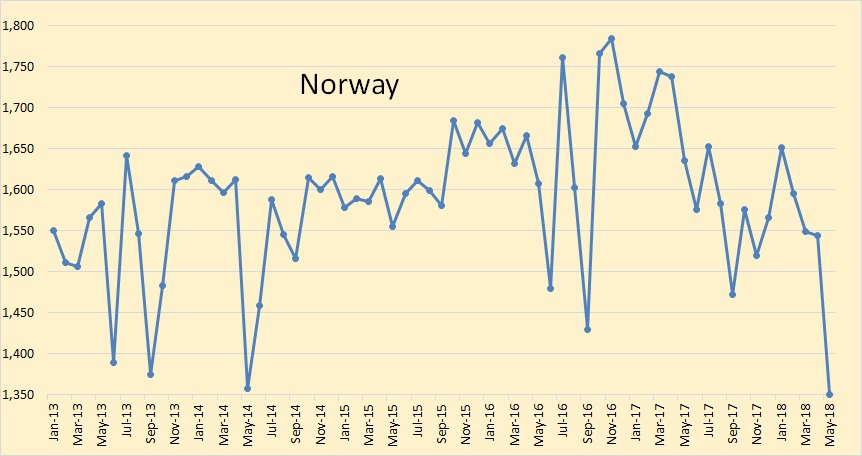
Norway… well that’s Norway.
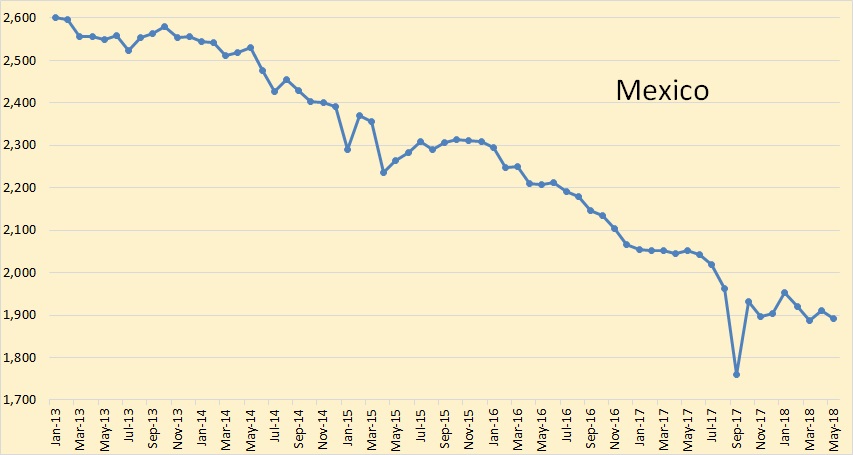
Mexico, for the time being, has slowed its decline.
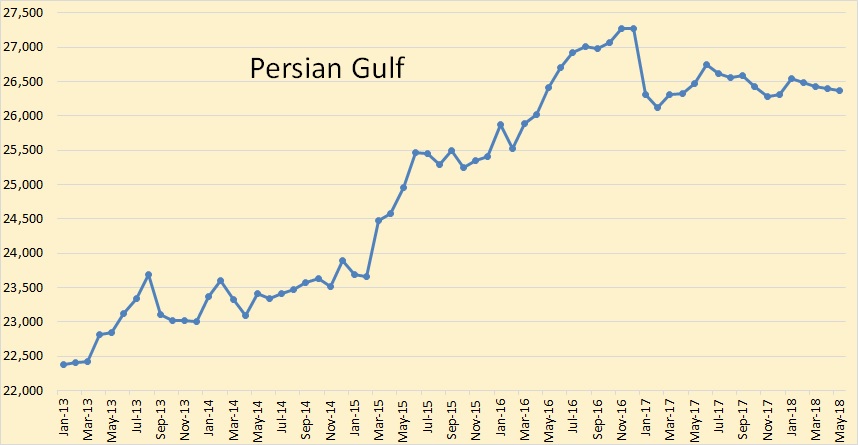
This is the EIA’s estimate of all Persian Gulf production. That includes Saudi Arabia, the UAE, Kuwait, Iran, Iraq, Qatar, Bahrain, and Oman. This is through May. There will be a slight uptick in June, July, and August but will not likely breach the previous high in November and December of 2016.
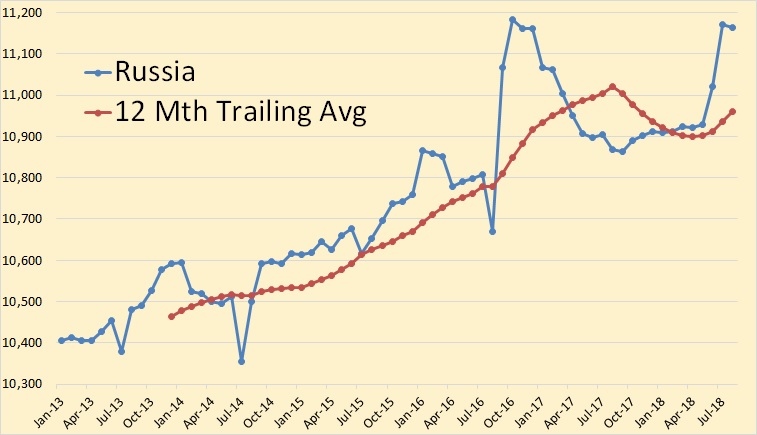
This is Russia through August 2018 from the Russian Minister of Energy. They are now back to the level they reached in the last quarter of 2016.