A Guest Post by George Kaplan
Crude and Condensate Reserves
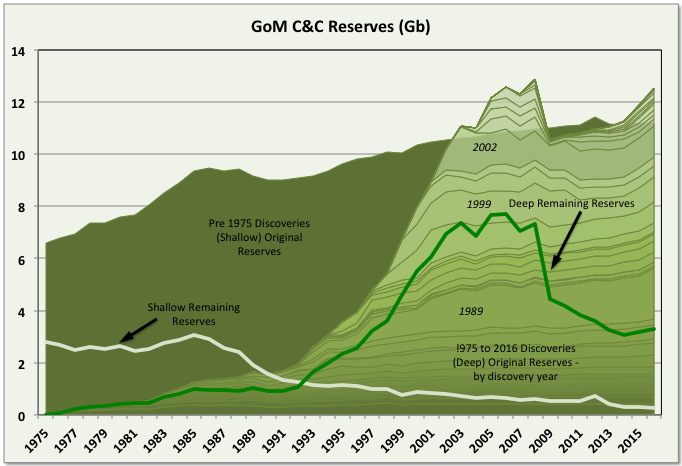
BOEM remaining C&C reserve estimates for GoM increased by 649 mmbbls for 2016 (i.e. to 31st December 2016). This was 112% reserve replacement and followed a similar growth of 618 mmbbls (111% reserve replacement) for 2015. The BOEM reserve calculation method appears to give highly conservative estimates. The increasing reserves followed several years, from 2006, of less than 100% reserve replacement, and actually negative numbers in 2006 and 2008. Current total original reserves (i.e. ultimate recovery) are a new high beating 2006 values, though deep water numbers are still below that year with the main growth appearing to be coming from: 1) older fields that were downgraded because of changes in SPE rules in 2007 (i.e. that reserves could only be booked if there were clear plans for their development within five years); and 2) newer discoveries, mostly smaller fields that are developed through tie-backs to existing hubs. These newer fields often do not get shown as new discoveries because BOEM records production and reserves against leases and each lease is recorded against a single field, even if there are deposits of different depth, age, geology and significant spacial separation within in it.
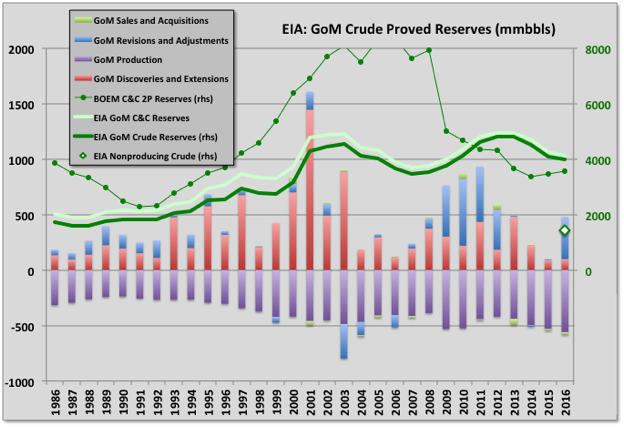
Current oil reserves are 3.569 Gb, which is 15% of the estimated original reserve (aka ultimate recovery). BOEM give the reserves as 2P (i.e. proven and probable) but they look very conservative and are actually lower than the EIA numbers, shown below, given for proven only and based on the operators own numbers, although the two are converging. The historical reserve histories look closer to how 1P (proven) numbers often appear, for example with some fields maintaining near constant R/P numbers, some showing large early drops that then come back over time, and some numbers being suspiciously low on fields obviously not near run out production rates (e.g. Mad Dog and Son of Bluto 2). I think the reserve calculations methods are fairly basic, given the amount of work required they couldn’t be much else, and use volumetric methods (i.e. reservoir area, depth, porosity, recovery factor) and previous decline data (I don’t now if the operators give them additional data such as well pressures).
Reserve Evolution History
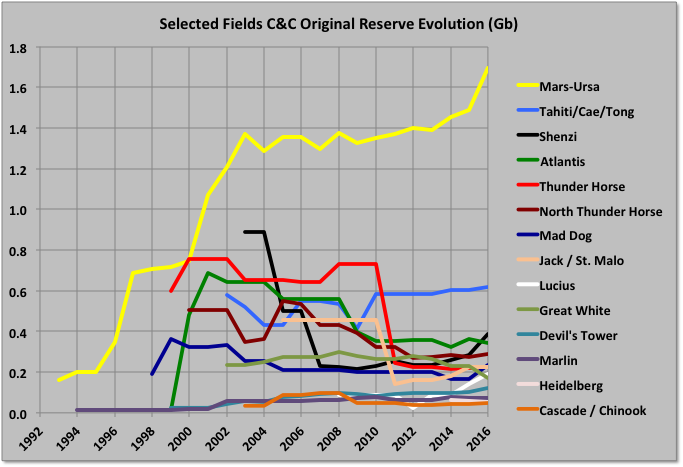
The Mars-Ursa fields have big original reserves, which have shown continuous growth. Other, large deep-water fields have mostly shown negative revisions from original reserve estimates, some quite large, though some of that is due to development timing (e.g. Mad Dog II reserves, when added, will likely recover all the earlier drop, and more). Shenzi has grown recently, and Atlantis will next year, both from new near field discoveries.
Individual Fields
The largest upward revisions in remaining reserves were for Shell’s Mars-Ursa field, which more than doubled the numbers (allowing for production). I think most of the gains came from new satellite fields at West Boreas and South Deimos, which are now on production, and possibly Kaikias, which has recently been started up. Other big gainers were Mad Dog, which had a very low number previously last year, and Shenzi, where BHP have made discoveries at Caicos and Shenzi North in the same lease blocks.
The largest downward revisions in ultimate recoveries were for Atlantis, Great White and Rigel. BP recently rescinded its lease at Rigel, which may be related, and the LLOG leases showed rapid decline rates before they went off line (presumably temporarily) because of the subsea manifold failure at Delta House. Great White has been gradually reduced in size by about 40% over the last ten years. Atlantis had a big write down in reserves after start-up, but BP announced a 200 mmbbls addition to resources in the area last year through new seismic technology, which is due to be developed in 2020 and presumably will be added in the next reserve numbers (in the mean time it looks likely the existing Atlantis wells will decline quite quickly).
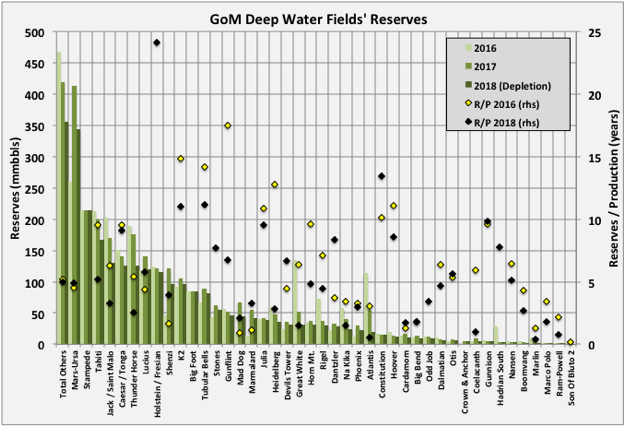
In the chart above the 2016 and 2017 reserves are the BOEM remaining oil reserves from the two latest estimates. The “2018 Depletion” data is the 2017 numbers less the 2017 production for that field, and the fields are ordered by that number. The R/P numbers are end of 2016 reserves divided by 2016 production, but for 2018 are the 2017 reserves less 2017 production divided by that production (to get the 2017 number add one to the R/P shown). Many R/Ps for the larger fields are in the range 4 to 6 years, which is equivalent to depletion rates, and therefore declines in exponential type well profiles, of around 16 to 25%, and that what has been typically seen recently. There are some very low numbers on fields with quite respectable production still, which probably indicates the reserves aren’t including some recent discoveries or revisions; for example Marlin has had recent tie-backs from Dorado and King fields, and Son of Bluto 2 (I don’t know what is happening there, it seems to be cycled now but in June cumulative production exceeded the recent BOEM original reserves estimate).
Caesar / Tonga and Tahiti are really a single field and BOEM report them as such, but it is spread over different leases and production is reported separately so I’ve prorated the numbers based on production.
The only two newly named fields for 2016 are small: Crown & Anchor at 5 mmbbls and Calliope at 2 mmbbls. Crown & Anchor production started through two wells in June and is likely to show fairly steep decline and a short life, maybe similar to Son of Bluto 2, also operated by LLOG. Similar small field tie backs are planned by LLOG for Claibourne, Red Zinger and Blue Wing Olive, though BOEM had no reserve numbers for these yet.
Hadrian South showed big relative downward revision, but still not enough as the field died without producing what was estimated (the difference in the natural gas estimates was much more marked than for condensate shown in the chart), I think some of the oil reserve shown is actually for Hadrian North and may now be shown against Lucius. The small Lena field showed an upward revision but actually has now been shutdown after no further production. Other, older fields showing significant growth were Who Dat, where subsea pumping is planned, and Crosby, I don’t know why but it is associated with Mars-Ursa and has production of only a few thousand barrels per day (the latest reserves and average 2018 production give it an R/P of almost 100 years).
Appomatox and associated fields were approved for development by Shell in 2016 so I’m unclear why they have not been included in the reserve numbers, presumably they will be added for 2017. The Mad Dog II project was approved last year, so that too should be added as well as the new Atlantis finds, therefore the replacement ratio should again exceed 100%, probably by more than the 2016 additions. After those there is Vito, approved this year, but then things will start to get leaner
Natural Gas Reserves
Natural gas original reserves are pretty much flat and remaining reserves are declining in line with production but with some revisions to associated gas numbers in line with changes to the oil numbers. I think there might be a bit of a downward revision next year because BOEM still carries a relatively large value for Hadrian South, which died mid 2017 without producing anything like the reserves given. There are still a few deep-water gas fields – Otis, Baldpate, Na Kika – but not much drilling, either for exploration or development, though Na Kika has a new tie back, Coulomb II, this year and Otis is having some activity (but is currently off-line due to the Delta House subsea failure).
Having said that the GoM, especially the shallow water area, was a pretty big gas resource and still produces significant amounts.
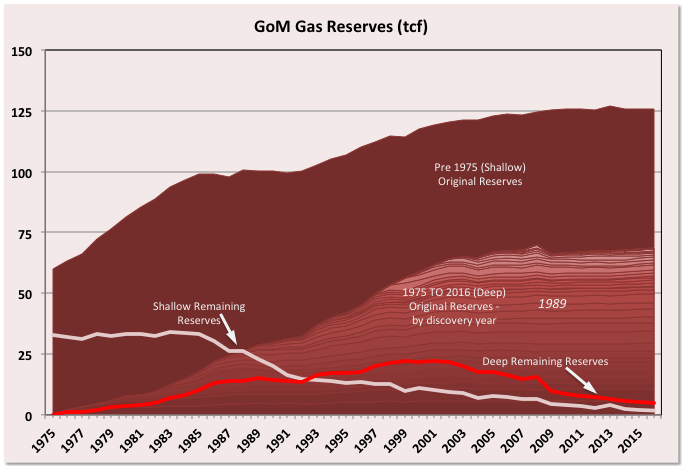
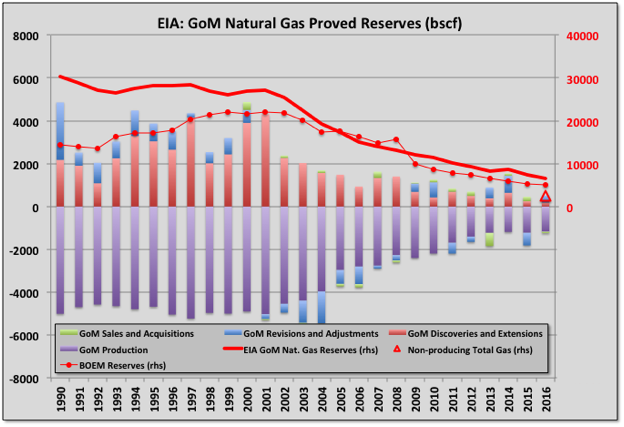
BOEM and EIA reserve estimates for gas agree much more closely than for oil. The chart shows that the non-producing reserves (i.e. mostly undeveloped associated gas) are relatively small now. A large proportion of the difference between BOEM and EIA are likely in these – e.g. for Vito, and Appomatox.
A Mature Basin
As well as the reserve curves given above leasing and drilling activity and recent discovery successes all indicate the GoM is a late stage mature basin for both shallow and, increasingly, deep-water areas. Actual production is possibly behind on the decline slope from where it might be expected, partly because the basin has been developed in three cycles: shallow, deep and ultra deep with some issues for the ultra-deep production because of technical issues in developing some uHP/HT fields (for example requiring 20 ksi wellheads and blowout preventers); but more because of the delays caused by hurricane damage in 2005 and, mostly, the drilling hiatus following the Deep Water Horizon accident in 2010.
Leasing
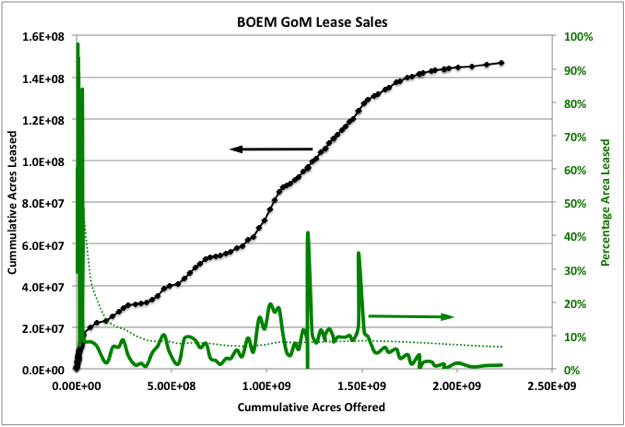
The remaining available exploitable acreage in the GoM is being offered for lease in approximately equal sized tranches every six months until March 2022. The sales so far made have been fairly consistent with about one percent of the land being leased (this compared with about eight percent average on the more prospective areas in earlier leases – the dashed green line shows the running average) and fairly modest bid prices. Some areas previously under moratoria may attract more attention but, equally, the most attractive areas are probably being offered first so interest levels may decline further.
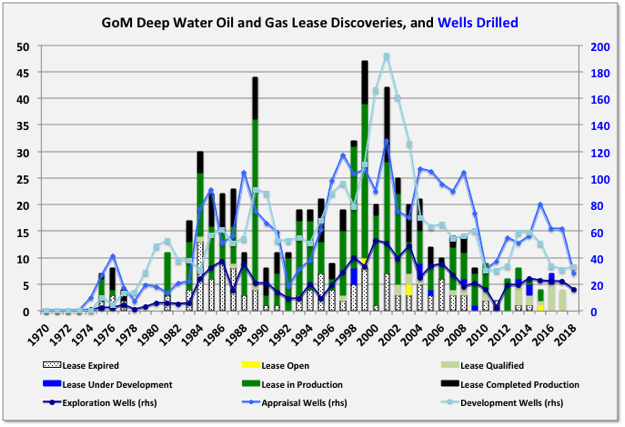
Discoveries
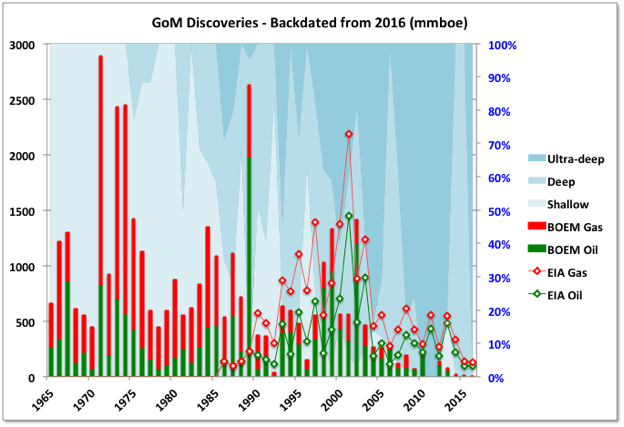
For the BOEM numbers discoveries are shown only if they are counted as reserves in the 2016 assessment. The recent drop off is not as severe as shown as: 1) there are a few likely discoveries still under appraisal before a final investment decision is made, 2) there have been a few approvals in 2017 and 2018 not included in the numbers shown which will get backdated once approved, and 3) as stated above, because reserves are booked against leases rather than fields, a number of significant recent discoveries get backdated to appear as reserve growth against the nominated field for a lease rather than later discoveries. The EIA discovery numbers, shown from 1986 for oil and 1990 for gas, give a better picture as they are by field, but they only show proven numbers and are not corrected with backdated revisions. The Mars-Ursa field highlights the difference in the approaches: the original 1989 discovery was relatively small and the big additions came from new fields in 2002 and after 2010 (as evident in the BOEM reserve history chart shown earlier). However using either EIA or BOEM the overall decline in discoveries since the 2000s is quite pronounced, and it will be interesting to see if high oil prices reverse the trend, the continued low level of exploration drilling (below) suggests not yet, if ever. The chart also shows the discoveries moving from shallow (less than 1000 feet) to deep to ultra deep (greater than 5000 feet). There might be some more shallow to come from sub-salt or newly leased areas, and there are still potential near field prospects for deep water, but ultra deep is the most likely area for expansion.
Drilling and Lease Development
Overall the number of open qualified deep-water leases available for new development is now pretty low. I think maybe only about fifteen that are not associated with producing fields, including North Platte, Shenandoah and Khaleesi / Mormont (Kings Landing) for LLOG, and the HP/HT fields at Anchor and associated with the Tigris hub for Chevron (there also are very small fields like Ourse, Mudbug and Calliope). No new leases have been added this year so far, though there have been a few reported recent discoveries, like Whale, Ballymore and Dover.
The North Sea is another mature (almost superannuated) basin. For the UK sector its late life is characterized by many small developments, usually tie backs; the GoM is more like the Norwegian sector with relatively fewer tie backs, and many of those recently being developed, but some major large projects still to come: for Norway Johan Sverdrup and Johan Castberg, and for the GoM Appomattox, Vito and Mad Dog under development, and Anchor, Tigris, Shenandoah, Kings Landing, North Platte and possibly others still to come. Most of these fields are technically and economically challenging because of high temperatures and pressures, difficult wells, and reservoir issues that can lead to low recoveries, and generally will have overall development times from discovery of more than ten years. Appomattox will be the largest development in the GoM, it has design nameplate of 175 kboed but Shell is already talking of debottlenecking to around 240.
I get the impression that the big four players – Shell, BP, Chevron and Anadarko – each have their main aim as maintaining an overall area production plateau, and that means accelerating the opportunities they have to compensate for high (and maybe accelerating) decline in their existing developments. The smaller players have mostly lost that battle now, with BHP joining them this year and expecting around 6% overall decline and Anadarko probably being the first of the big four to see clear reduction next year.
Shallow water drilling activity is very low now. Deep water is steadier, although the steady drop in discoveries means that appraisal drilling has shrunk significantly this year; typically appraisal wells are successful and are eventually tied in to new or existing hubs. Exploration wells are about the same as last year and development wells slightly higher.
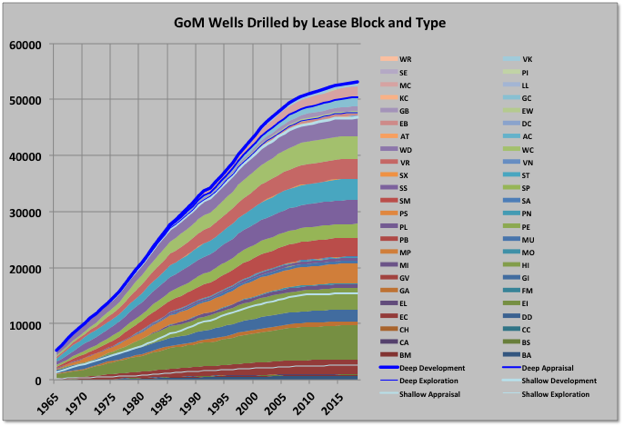
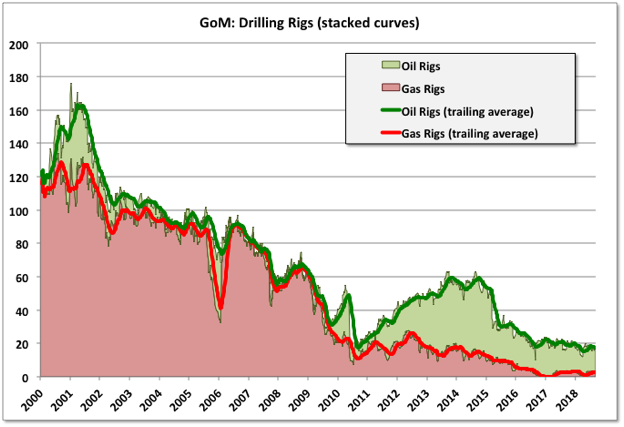
The creaming curves for wells in all areas clearly shows the basin is in the late life cycle (note deep wells include ultra-deep). Overall the well numbers will be slightly down on last year, which is as predicted at the start of the year. The active rig count by Baker-Hughes still shows a slightly declining trend, but part of that may be a current lack of suitable jack-ups for some drilling locations in shallow water (see Douglas-Westwood). Shell recently idled its rig on the Crosby field with six month remaining on contract and earlier in the year Anadarko cut short the contract on one of its three.
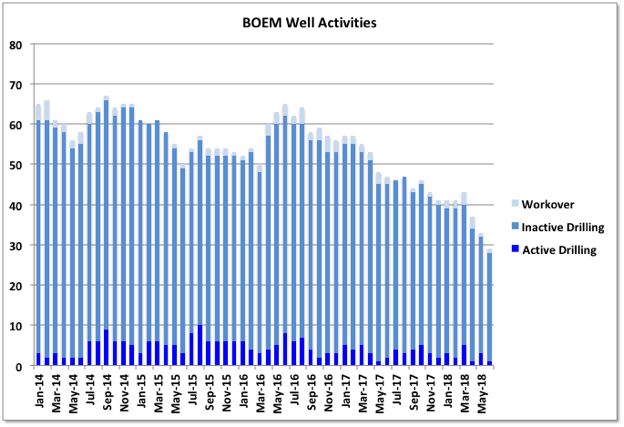
The number of wells shown as drilling or workover is dropping significantly, I think this reflects a number of previously drilled wells that have been tied in (e.g. a lot of the new LLOG production this year), though some may also be abandoned, combined with the drop in active rigs since 2016.
The current signs all indicate a continuing slow fall in activity and production. The tail maybe quite fat though as the GoM has plenty of infrastructure allowing economic small field development plus various different geological plays whose attractiveness may depend on new technology or changing cost/price dynamics. There some new activity in shelf areas looking at sub-salt prospects, and in the frontier areas nearer to the Mexican boundary, plus it will be interesting to see what the interest will be in the areas that have previously been under moratoria
Oil Production
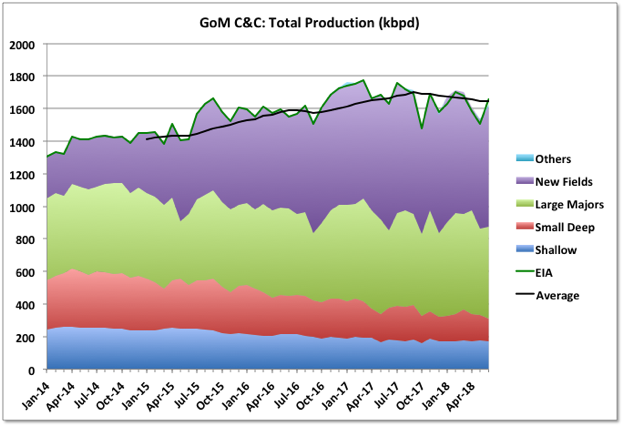
EIA has June production at 1658 kbpd (up 157 kbpd or 10% m-o-m and 27 kbpd or 1.7% y-o-y). The BOEM number is 35 kbpd less at 1623 (a 6% m-o-m rise but 1.2% y-o-y decline). Typically the initial BOEM initial estimates are closer to the final value but EIA numbers are continually adjusted and end up matching the final well and lease data from the operators.
Spring months are traditionally when maintenance turnarounds are conducted for the major platforms. Great White field (processed on Perdido spar) and some of Mars-Ursa production was offline in April and May; Mad Dog was offline in May and part of June, Stones was offline for all of March through May. Most of those production outages have now returned. There are still some platforms and fields with lower than 100% availability (e.g. Mad Dog, Horn Mountain, Holstein, Rigel because of the Delta House subsea failure, Llano/Baldpate because of the Enchilada pipeline failure) but there always will be, so it remains a question how much production can grow further except from new wells; the coming numbers for July should show an increase on June but February might prove to be this year’s peak month.
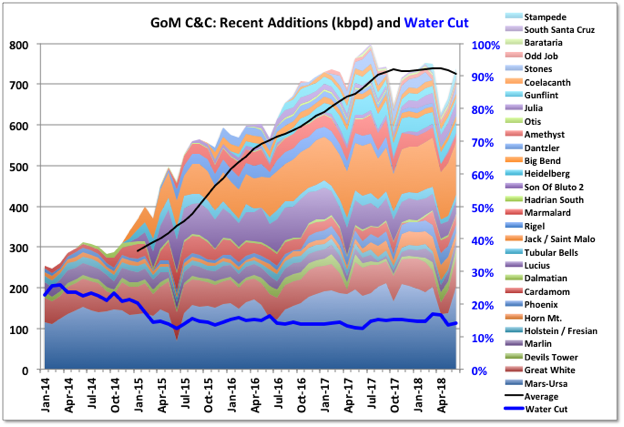
The Stampede project continues to ramp-up, there are no actual production figures yet but it looks from the BOEM estimates to have reached about 50% of expected phase-one production so far. Some small additions in June came from the Crown and Anchor LLOG leases producing through two wells to the Anadarko operated Marlin platform.
Stampede, Lucius and Coelacanth (aka Hummingbird) have no production reported for several months and have been estimated to match BOEM total numbers.
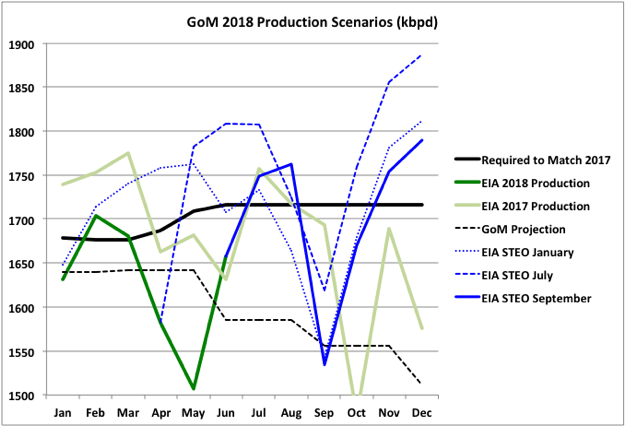
2018 production has so far been below 2017 for every month except June, which had a high maintenance load in 2017 (and it’s likely the final adjusted number will be lower there too if the BOEM estimates prove better). It has even averaged below my projection from earlier this year, which I expected to be a median-to-low estimate, and especially so as it did not included the Kaikias development that was accelerated by about a year; plus I had not realised some of the large developments (Jack, Tahiti, Great White) hadn’t quite finished ramp-up in 2017 and maybe I relied on the BOEM reserve numbers being less conservative than is becoming apparent. I think the projection will still be lower than actuality unless the overall average availability in the second half is particularly poor (e.g. hurricanes, late year turn arounds or unplanned maintenance).
The thick black line shows what the remaining production must average to exceed last year’s average, which looks unlikely, although it should catch up a bit. The EIA STEO forecasts updated each month must be generated by some algorithm because the future figures all change each release but I don’t know how. The start is always fixed to actual production (which may later be adjusted) and I think there is some compensation to try to match the expected yearly average – i.e. lower than predicted actual monthly production tends to lead to higher later forecasts – having said that though, the September numbers show a marked drop for both this year and next, and for the first time that I’ve seen they now have this years average production below that for last, it does of course still increase again next year.
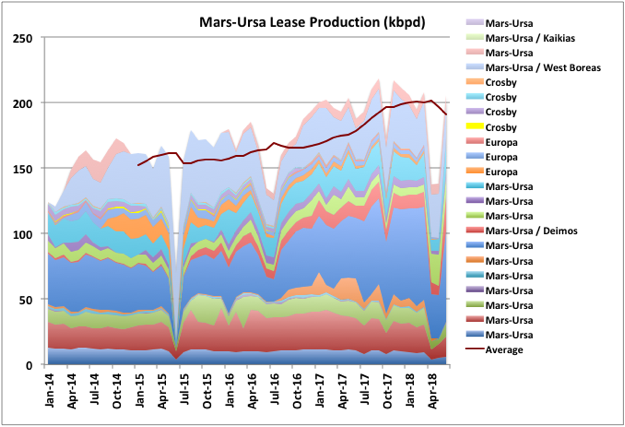
The Mars-Ursa complex, operated by Shell including two drilling and production TLPs, Mars and Olympus (Mars B), is the largest overall single producer in the GoM. The chart above shows the production by leases and fields. There has been significant production increase over the past couple of years. The West Boreas field is showing relatively rapid water breakthrough and the older leases are declining but there’s still continuous drilling with two or three rigs. Having an available platform based drilling rig for the largest fields usually results in better recoveries and longer plateaus, but can sometimes mean more rapid declines at end of life. The Kaikias development was started in May and is being ramped up, which I think will provide 40 kbpd; it will be interesting to see if that is enough to compensate for the declines in the other leases over the next year.
Two of the fields that showed relatively large increases in reserve estimate were Lucius and Marmalard, but that is maybe belied by their recent performance. Like a few recently started deep water fields Lucius wells show dramatic decline when water breakthrough starts. It’s unclear if new drilling will allow recovery of production, but it may be that the reserve increase is because of the planned development of the Hadrian North field through the platform. Dantzler, Gunflint and Heidelberg show similar behaviour following water breakthrough, and Heidelberg has had a large write down in reserves, which may mean there will be no phase II development there.
Stones looked like there was some unexpected water production initially, which has been stopped. It has not yet reached its nameplate capacity after a couple of years, its production history has been a bit erratic and it looks like it has been taken off-station recently, but there was a large increase in reserves and probably more upside potential yet as the recovery rate is in single figures. The FPSO for the field, Turritella, was supplied by, and originally leased from SBM, with Shell exercising a purchase option last year. There have been other SBM projects with operating issues (e.g. Tyr in Norway, where the platform was condemned, and Deep Panuke offshore Canada) so it will be interesting to see how the ExxonMobil FPSOs for Guyana, also to be leased from SBM, perform.
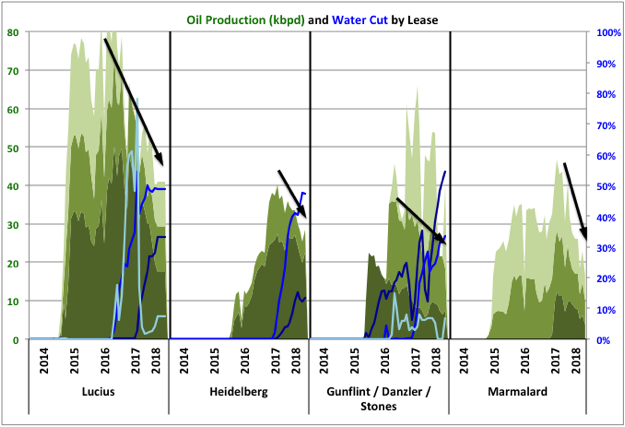
Marmalard has no water production but all three leases are declining quickly and maybe a bit faster than the remaining reserve estimates would warrant.
Natural Gas Production
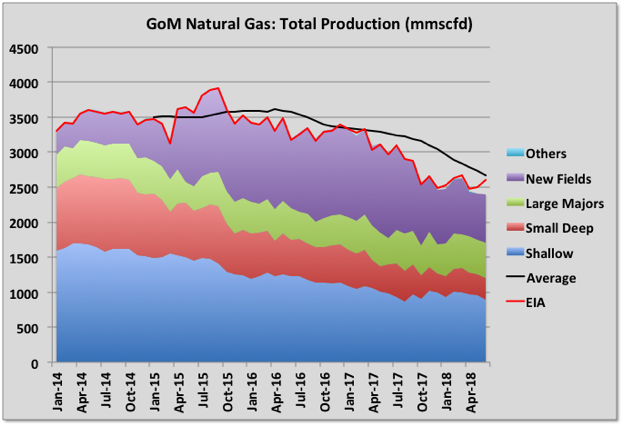
Gas production increased slightly in May because of the startup of the Coulomb II tie-back to Na Kika and again in June because of the restarts from some major turnarounds. June figure is 2604 mmscfd (down 12% y-o-y). Like oil the EIA gas production number is much higher than the BOEM estimate of 2439 mmscfd (down 17% y-o-y). There is general decline, especially in the shallow fields, but the main difference with last year has been the loss of Hadrian South production.
Off Topic Finish
There are a few coots’ nests on the rivers and quays around where I live. They are fascinating to watch. From what I can see, over a few seasons now, they build a small nest in early spring (often including a lot of human litter) and have a couple of chicks (or ducklings or whatever) and then the parents go completely bonkers for about a day making the nest much bigger with each adult seemingly trying to outdo the other; hence maybe the expression “queer as a coot” – in the mad sense of the word (they are not bald so I don’t know where that one comes from). With the bigger nest they sometimes have other chicks, I think mostly in pairs, but at some time it looks like one adult and some or all of the chicks just aren’t there any more, they may get eaten but it seems too regular for that, so I think they leave for pastures new. Sometime later the remaining chicks leave, sometimes there’s a lone adult (possibly a grown chick) swimming around looking a bit lost, then it goes too. I don’t know if the same adult pair come back to the same nest site the next year and I’ve been wondering if the nest building display has anything to do with which adults leave when.
Coots are also violently territorial, especially in mating season, and give vicious pecks on the back of the head to rivals (or they might be unwanted suitors or it’s just part of playing hard to get for all I know), which sends the victims under water for several seconds and several yards of swimming to get away. But I’ve also seen adults do the same thing to chicks – they’re swimming along, the adult feeds the chick every so often then the chick takes off, often trying to fly, the adult goes after it, a bit faster, and whack, right on the back of the head, then back to feeding as if nothing has happened. I don’t know the issue there – maybe the chick takes off first and the adult is reining in some youthful exuberance, but it looks more like the chick knows something is coming and sets off to get away. I guess they are closely related to moorhens and the chicks look particularly alike with red bills that then go pure white in an adult coot. I could Google it all, but it’s more interesting watching the nuances of the behaviour and trying to work it out myself, even if I get it wrong.

All of the above is, of course just, like, my opinion man, but for something that is a fact The Big Lebowski is twenty years old and there’s a new print out in cinemas.