A Guest Post by George Kaplan
Introduction
BOEM produces an estimate of GoM reserves every year. This year’s covers estimates for then end of 2017. Nominally The figures given are 2P estimates but previous analysis has shown them to be extremely conservative, and they strictly follows SEC rules concerning reserves being bookable only if clear development plans are in place.
Backdated Reserves
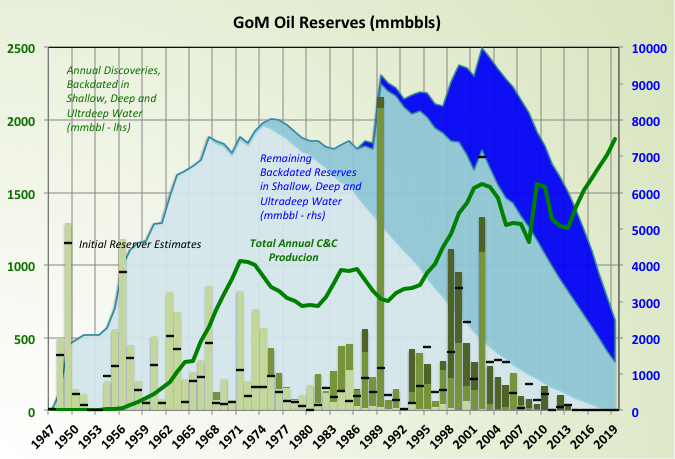
These charts show reserve additions from discoveries by depth (all backdated to the original discovery year so that all adjustments due to improved extraction methods and better understanding of the reservoir etc. are included in the shoen reserve estimate), production and remaining reserves also by water depth.
The black dashes against each discovery show the original estimates of reserves. The shallow water estimates were very low and had significant upgrades, deep water not so much, and ultra-deep hardly at all. The reason for this is mainly the date of the discoveries: nominally it should be easier to apply seismic and drilling analysis from shallow water but the ultra-deep finds were made later and therefore have had better technology and seismic available when the original estimates were made; more on this later.
That said I do not know what method BOEM uses to make the estimates, it cannot be the ultra high fidelity models that the E&P companies use as they do not have the computer power, human resources or time to cover every field in the GoM.
Clik here to view.
Clik here to view.
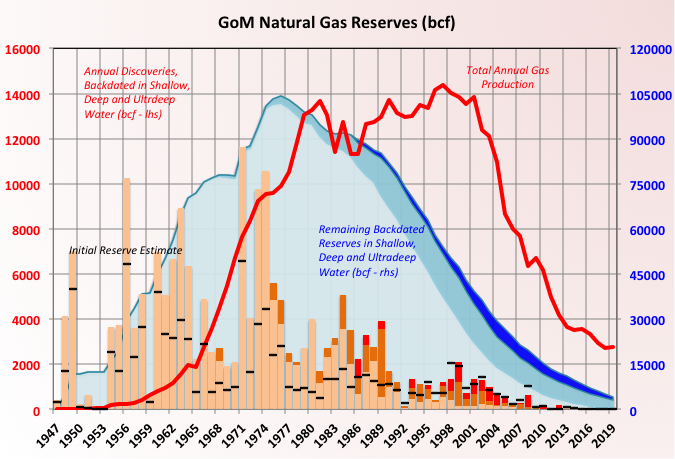
The 2018 and 2019 remaining reserves shown have been calculated assuming no additional discoveries or adjustments so they will be low. In fact the whole curve for remaining reserves will be expanded a bit as new projects get approved, allowing their resources to be booked as reserves, so that the BOEM estimates get closer to the E&P’s own figures.
The normal caveat applies to the GoM (and some other jurisdictions) in that reserves are counted against leases (i.e. geographical locations) rather than fields (i.e. distinct geological reservoirs) so that actual new discoveries can appear to be adjustments backdated against the original discovery in a lease,
Reserve Discovery Sizes
Clik here to view.
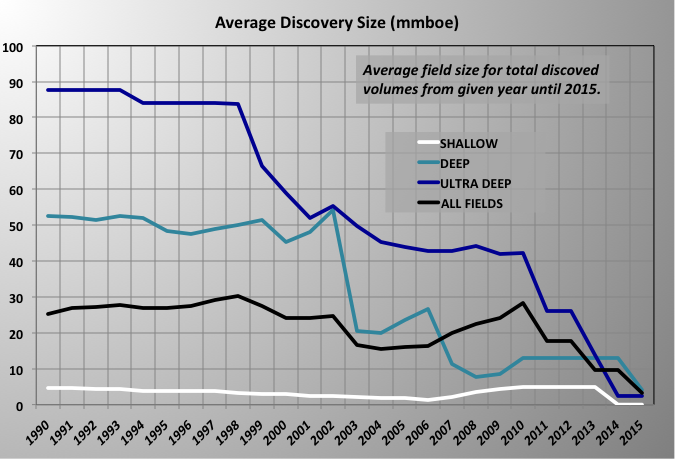
This chart might have been better shown in the previous post on discoveries, but it shows how the size of discoveries and hence the rate of addition to reserves has fallen, though probably not as dramatically as it appears just because of the way I’ve displayed the date. This possibly demonstrates how easily a particular viewpoint can be emphasized just by picking a particular way of presentation, without needing to cherry pick data. That was not my idea – at least consciously. The lines show the average size of total reserves for all the fields found from the year shown until 2015 (the last year with many recorded). This smooths out yearly variation but overly biases towards recent years and means that the delay between discovery and registration of a find by SEC rules makes the curve look steeper than reality. If and when (and with the recent price crash it may now more be a question of if for some time) the newer, and relatively significant discoveries like Anchor Appomattox, North Platte, Kings Quay etc. are included then the decline in discovery size will be much less obvious. However the actual number of fields found will still follow a pretty good bell curve, and given the likely coming collapse in high risk / high impact exploration, one without a very fat tail (for now).
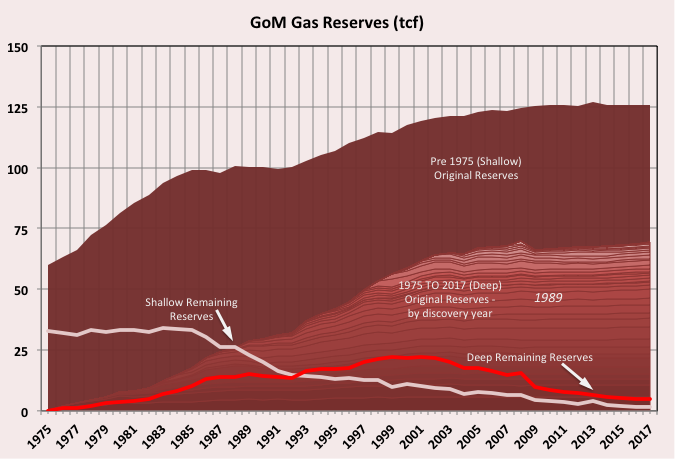
Reserve History
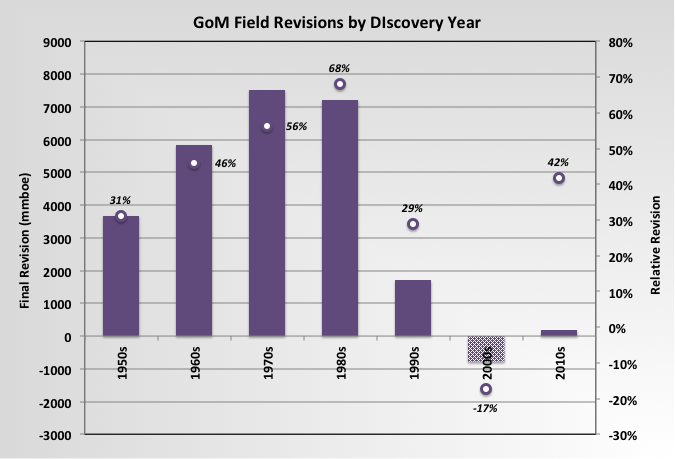
The two charts below show how the oil and gas reserves were thought to stand on a particular year. The numbers evolved for four main reasons: 1) Technology improvements and production results allow a better understanding of what is actually in-place (the reason why all reserves need to be backdated to make much sense); 2) New technology allows improved recovery; 3) Oil price changes affect what is economic to extract; and 4) SEC rule changes affect what reserves can be booked (principally affecting non-producing reserves and when they are planned for development).
The 2008 SEC rule changes show up as a big step down for oil – most of that has now come back as projects have been approved for development; it remains to be seen if they all remain as firmly approved as once thought given the ongoing price crash and the, likely, continuing short term demands from shareholders for dividends and share price support through buyback schemes) Deep reserves (anything in above 1000ft water depth) are shown by discovery year, with the three largest years highlighted. Shallow reserves have been flat or even slightly declining, something that may accelerate and become permanent downgrades if any of the high water cut wells need to be shut-in.
Clik here to view.
Clik here to view.
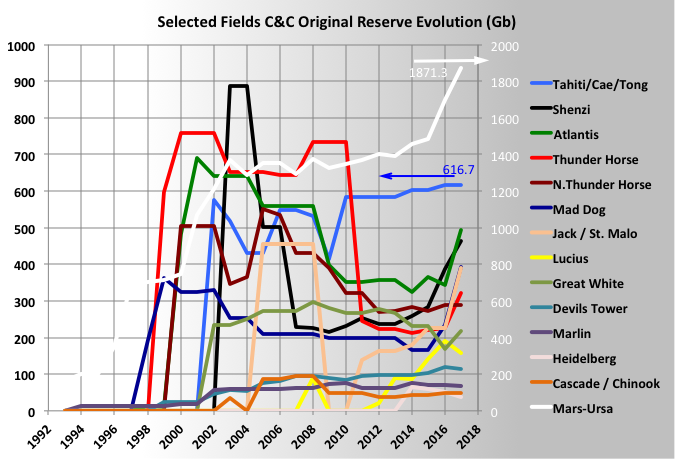
Adjustments to Large Deep Fields
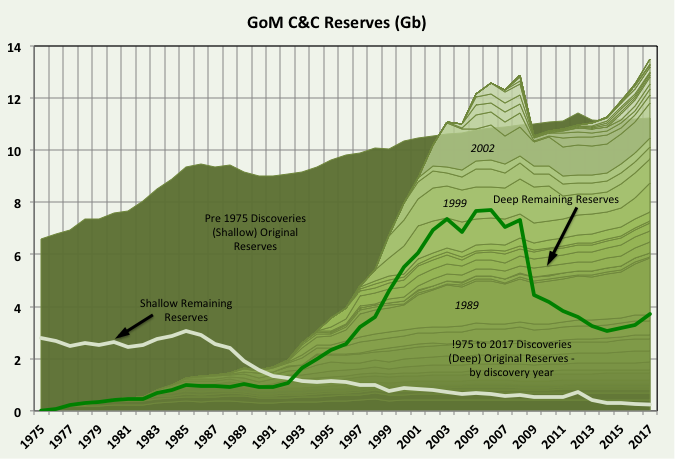
Mars-Ursa is the dominant field in the GoM and is the gift-that-keeps-on-giving in that the original reserves keep getting bigger – I think this is almost all from discoveries of new fields in the leases rather than from upward revisions, although there were some improvements made by adding water flood. Note in the chart it is shown on the right hand axis and is over twice the size of the next largest C&C reserves. Lucius, too, has shown general improvement since start-up, though there was a slight downgrade in 2017 (I may have got this cocked-up in a previous post).
Other fields have done much less well and some have been severely downgraded after initial production results. Some of the downgrade has been recovered in 2016 and 2017 estimates and will likely continue when 2018 and 2019 estimates come out, although the current price crash may mean another downgrade now. This recovery was partly due to a lot of brown field redevelopment, such as Thunder Horse South and Tahiti Vertical expansion, but also a lot of in-fill wells and some new discoveries.
Clik here to view.
Overall Reserve Adjustments
BOEM provides historic reserve data for fields from 1975. This covers all of the period when deep and ultra-deep fields were being discovered and brought on line. The chart below shows how the reserves (all attributed to a main field in each lease) have been adjusted from the initial estimate through to when the field was exhausted or now, if still on-line. The normal caution applies in that a single lease can, and many do, contain separate fields but all reserves are referenced against the main field and its initial discovery date. Thus a significant proportion of what appears to be adjustments is really discovery of new reserves, so ‘growth’ may be over estimated (probably only the owners know by how much).
On the other hand the adjustments made for older shallow fields may be under estimates because there would have been growth prior to 1975, which as not been shown in the BOEM numbers. Some of this growth would have been very large because estimates were no better than wetted-finger-in-the-air guesses until a field started production and then improved markedly as more data became available. Because of the unknowns, and maybe because of regulatory, tax and royalty regimes, though I have no real knowledge of this, those initial estimates tended to be conservative.
Clik here to view.
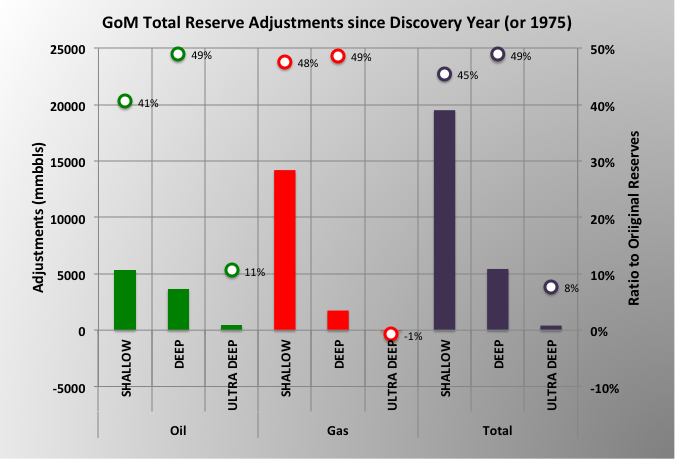
The reason ultra-deep growth is so low is because these are all newer fields, developed since 1998 when better drilling, seismic, modeling and sampling technologies have been available, together with improved understanding of the geology in the GoM and of oil reserves generally. Part of the reason the deep fields (rather than ultra-deep) adjustments are so high is that this technology became available as the fields were being developed or in early production.
Clik here to view.
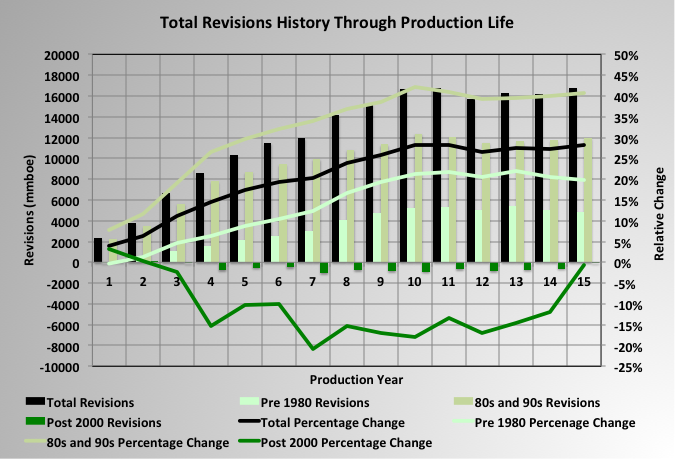
This chart demonstrates how the revisions have all occurred in the first ten years of production. I was a bit surprised that there wasn’t a bigger change in the first couple of years and then a flattening out (i.e. asymptotic rather than linear). However I might be biased by my experience having been more in the 1990s and 2000s. The newer fields haven’t shown any overall growth yet. The initial negative adjustments suggest a bit of over exuberance when these fields were first discovered (also supported by a number of highly hyped recent deep-water projects being canceled completely and some operators retreating with their tails between their legs. (Apparently dogs do that so that their foes cannot smell the fear in their chemicals in their gaseous releases – which I actually find more interesting than the history of GoM reserves, see below for more emission related information.)
The adjustments may also be affected by the small sample size with a large proportion still in early production years, by a lot of volatility in the oil price in the period where they saw changes and, as always, by the many-fields-one-lease issue.
Clik here to view.
The discovery year and technology effects are summarised in this chart: large upward revisions in the 70s and 80s, not much change for fields from the 90s and probably a net negative adjustment (given the discovery versus adjustment issue), in this century. There may be further growth as production evolves but in the short term the rapid and significant oil price drop in recent weeks could be a devastating to any expectation of growth in 2P reserve numbers (both reducing current estimates by halting brownfield work but, more so, by delaying or eliminating additions from new developments and discoveries.
There have been at least two papers, one based on UK offshore and one by the USGS, warning against applying growth figures based on any one field, let alone a basin, to anything else; so these findings may be interesting but of no particular relevance; though I think it’s pretty certain that any field that’s been operating for over five years will not see much more growth unless some major EOR scheme is applied, which isn’t going to happen in many places at present prices.
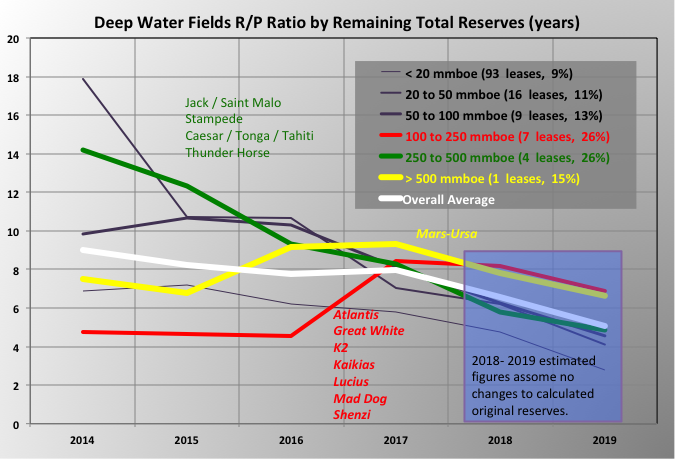
R/P Ratios
Over the years the reserve to production ratio has been kept around eight years, even as the production was increasing – i.e. reserves were increasing too, I think a lot has been from reserves added back in that were dropped when the SEC rules for booking were changed, often through in field brownfield projects.
The chart shows how R/P would drop through 2018 and 2019 given the production reported for those years if no new reserves were added to the BOEM 2017 numbers.
For 2020 and forward it is hard to see how the COVID-19 crisis won’t have some major impacts, which are, at least for me, completely unpredictable. I don’t know how quarantine would work offshore; I guess the shifts have to be kept isolated even when they move onshore. Any sort of planned, still less unplanned, maintenance seems problematic; and what happens if a hurricane or major incident requires evacuation. I think the majors would be inclined to take the safe route and just shut down. Maybe Trump will insist on keeping things running for the economy and blame the subsequent deaths and hospitalisations on the Chinese. Loss of production will put the R/P number up quite quickly.
On the other hand new projects are sure to be delayed or even cancelled. Through 2019 a break even price of around $30 for deep-water had been mentioned by companies, though Art Berman has mentioned around $60. Either seems unlikely at the moment (today, 20th March Mars US, a GoM grade, is $19); and any quarantine impact is bound to delay projects, which could mean some reserve additions have to be deferred. Given that R/P might fall compared to expectations after 2020. Who knows?
Clik here to view.
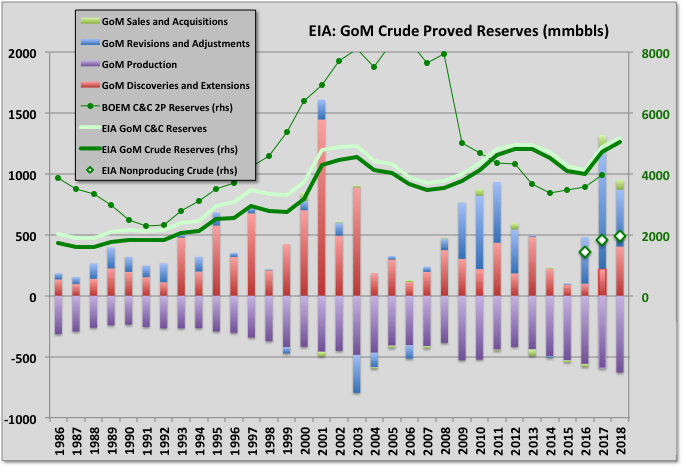
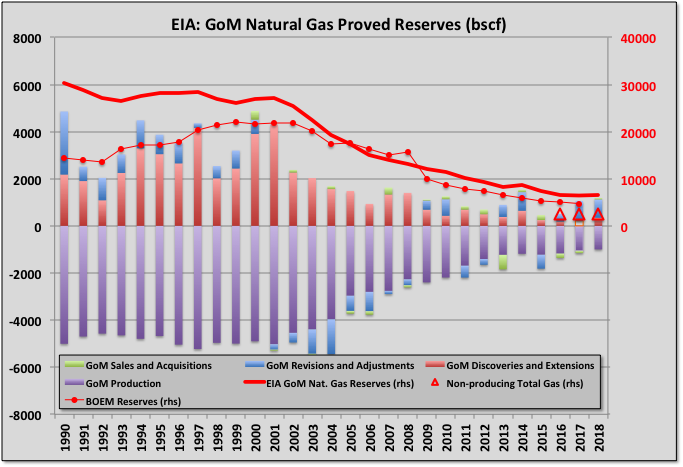
EIA Reserve Estimates
The EIA present it’s own reserve estimates based on reports from the E&Ps. These are, nominally 1P numbers but since the SEC rule changes have always exceeded the BOEM 2P estimates, although they may be getting a bit closer together. A lot of the difference may be the “non-producing” category used by EIA, which I assume is mostly fields under development, both greenfield and brownfield, of which there are some quite large ones (Anchor, Kings Quay, Vito, some adjacent fields to Appomattox, maybe North Platte depending on the level of certainty EIA require to include the resource, Oarse, Mad Dog II, Atlantis III, and who knows what other brownfield extensions). The EIA numbers are for 2018 and a lot of those developments may show up in the BOEM estimates for this year. 2019 and, certainly, 2020 will not show the same level of AFD activity, there may even be a chance some things are cancelled.
Clik here to view.
Clik here to view.
Off Topic Finish: Titian’s Effulgence
This is an early painting by Titian called “Bacchus and Ariadne”. It’s an imposing canvas and in the National Gallery it is paired opposite another big, classically themed but late period Titian with hints of impressionism (maybe because of eyesight problems, like Monet): “The Death of Actaeon”, and there are a couple of similar others in the same room if I remember correctly. Even after almost 500 years the colours are awesome, unsurprisingly especially the blues.
Clik here to view.

Nominally it is about love (really lust) at first sight, but actually it is a joke about excessive gaseous emissions, and all the greater for it. The white flower at the bottom, pointing accusingly at the nether regions of both Bacchus and the Satyr, is a caper, known for its anti-flatulence properties. The dog looks suddenly quite interested and the followers faintly disgusted, two of them may be fanning their noses; even Ariadne is looking a bit miffed (though that could equally be explained by her having a priapic Bacchus suddenly violating social isolation conventions). Some think it’s Bacchus himself who has just cut one (possibly first date nerves) but I think he’s jumping to evacuate the contamination zone, his cloak blowing in the wind as it were, and the real guilty party is the Satyr (lauded in ancient Greece for their “farting prowess”) despite his attempt at doe eyed innocence. Why would Titian have painted this? It must have been a dig at someone, probably a rich client – real art