A Guest Post by George Kaplan
This analysis concerns C&C only. Natural gas production is low and steadily declining with few deep gas-condensate discoveries and the shallow dry gas fields at end of life. I don’t know if lack of gas may affect oil production – e.g. insufficient: flow to allow stable pipeline operation; income to be economic to warrant continuing maintenance; or fuel gas or lift gas supply to surface facilities. Any such issues could influence shutdown timing and hence the possible stranding of assets.
Top Down Production Projections
Clik here to view.
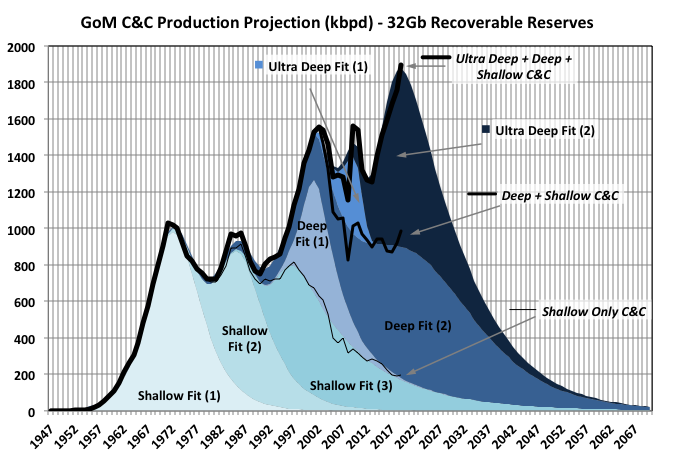
The chart above shows a Verhulst fit to GoM C&C production using seven curves, three describing shallow production and two each for deep and ultra-deep. A symmetric logistic curve is convenient for manual curve fitting as it allows a linear extrapolation to give the ultimate recovery, but most production curves are not symmetrical – usually the decline is less concave with a thicker tail, especially as the production volume and number of independent producing entities are reduced. With Excel, using least-squares optimisation fitting to any curve(s) is simple and has the benefit of allowing additional constraints to be imposed for sensitivity checks (e.g. total area, equivalent to the ultimate recovery, and position or height of peak), so more general Verhulst curves allow closer fitting.
Against this is that fitting fairly arbitrary curves maybe negates some of the births-and-deaths theoretical basis for a logistic model and, as mentioned below, can distort the extrapolated tails unless some additional constraints are applied.
The drilling hiatus after 2010 complicates the fit by creating a false trough and deferring the peak; without it only one curve would be needed for each of the deep and ultra-deep production. The fit to the shallow production is pretty good and gives an ultimate recovery of 14Gb. in its 2018 report BOEM estimates ultimate recovery at 13.4Gb, with 67mmbls added that year (and generally the additions are declining each year) so that too fits well.
The curve above has a total recovery of 32Gb C&C, with 12Gb in deep water and 6Gb in ultra-deep; BOEM in 2018 gave these as 7.8 and 3.7 respectively, with annual changes of -36 and 174mmbbls, make of that what you will. There are a couple of billion under development or close to FID but not included by BOEM: projects in the Appomattox area, Vito, Mad Dog, Anchor, Kings Quay and Shenandoah, though much of it is 20ksi technology that has yet to be proven in full operation and is costly and with long lead times.
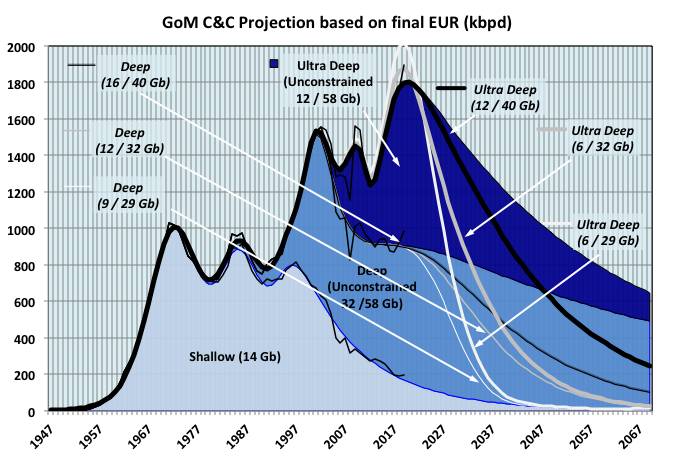
The second chart shows fits with constrained recoverable reserves of 28, 32 and 40Gb (shown as line curves) and an unconstrained case that gave reserves of 58Gb (shown as the stacked area chart). All cases use the same curve for the shallow production and optimsed the fit with the parameters of the four other Verhulst curve. Current BOEM 2018 estimates of total 2P reserves of C&C are 24.9Gb (13.4 / 7.8 / 3.7).
By these estimates 2019 looks likely to be a peak, if not an all-time then at least for some years. This year will be well down compared with last and it will take a few years of steady development to catch up if the peak is to be exceeded, assuming sufficient and rapid discoveries become available, which seem unlikely (see later sections). As mentioned before, a delayed and higher peak would be an expected result of the 2010 hiatus (as happened to a bigger effect in the UK with the Piper Alpha shutdowns).
With only half the curve to fit to the parameters are sensitive to small changes, although I’d venture that the actual answer is bounded by the cases shown. The displayed curves indicate that new reserves need to come more from deep rather than ultra-deep but I don’t think too much should be read into that; in further studies just small parametric changes didn’t change the accuracy of the overall fit much but had big effects on the split between each curve.
Clik here to view.
Reserve Projections
Below is an attempt at a similar fit to reserve discoveries, although only using a single curve for each depth. This is rather more difficult than for flow: (i) the process of discovery is more stochastic than for production; (ii) recent discoveries, which have a large effect on the tail shape, are not known well and depend on whether they have yet been through FID; (iii) with BOEM any new field discoveries in a producing lease are backdated against the original field, which loads the curves to the front end and thins out the tails; BOEM estimates for recoverable reserves tend towards the conservative; and (v) the estimates for new discoveries not in development in 2018 are based on company reports, either directly or through industry magazines, which tend towards optimism (often citing an “up to” figure, which would correspond to a P3 estimate).
Clik here to view.
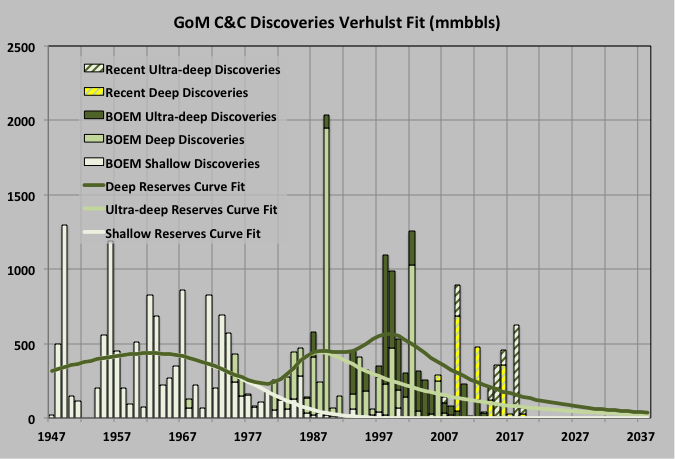
The tails on these curves give only 700mmbbls more, split slightly in favour of deep rather than ultra-deep, to give a total ultimate recovery of 29Gb. I think it will be higher with a couple of major finds but mostly near field tie-ins either to the set of hubs currently under development or appraisal or extended reach tie-backs (BSEE/BOEM is currently looking at technology that could promote development of these so that presently stranded assets can be matched with existing under utilised surface processing, which I’d assume includes things like heated flow lines, subsea compression, and subsea separation). The dearth of recent lease sales would tend to militate against a lot more – maybe 32Gb will prove to be about right.
EIA Reserve Estimates
The previous estimates are all based on BOEM reserve figures. The EIA also issues estimates based on reports from the E&Ps. For 2018 these are 5191mmbbls (C&C), but are a 1P number (proven). This compares with 3434 from BOEM, a nominal 2P number. In the UK 2018 probable reserves were 40% of proven, in offshore Mexico 80% (but the Cantarell field contains almost half the probable reserves which is a bit surprising for a mature field), and in Brazil about 60% (an educated guess as the ANP board only issues 1P an 3P numbers). Given the maturity of the GoM basin and the technology available I’d expect the GoM would be closer to the UK number. In addition the companies numbers likely include some reserves for fields in development but not yet in the BOEM numbers; so a conservative guess around 7Gb for 2P EIA equivalent seems reasonable, but is likely to be more dependent on oil price than the BOEM number. I think some of the biggest contributors to the extra EIA reserves are higher recovery factor estimates, especially for the large ultra-deep fields operated by the Shell, BP and Chevron. For example the BP fields Atlantis and Thunder Horse have present recoveries, from BP investor presentations, of just above 10%, and Mad Dog’s is given as below 5%. These are large fields with over a billion barrels of original oil in place. Just small changes in the recovery factor results in a significant change in reserves. BP is forecasting an increase to 400kboed production (from 300 in 2019) and then, without new discoveries, a slow decline. The higher EIA numbers are not incompatible with an estimated C&C recovery of 32Gb, but may suggest a higher upper end, depending as usual on future discoveries.
Well Decline Rates
Well decline rates were estimated by fitting an exponential to the decline phase (after the maximum monthly average is reached) for data from 2014 onwards. New wells tend to decline rapidly in the initial months after ramp-up and any plateau. A power-decay curve (e.g. a hyperbolic) would be closer than an exponential in the early months, but that is not particularly relevant to the later life behaviour, which is what matters most for estimating ultimate recoveries.
Clik here to view.
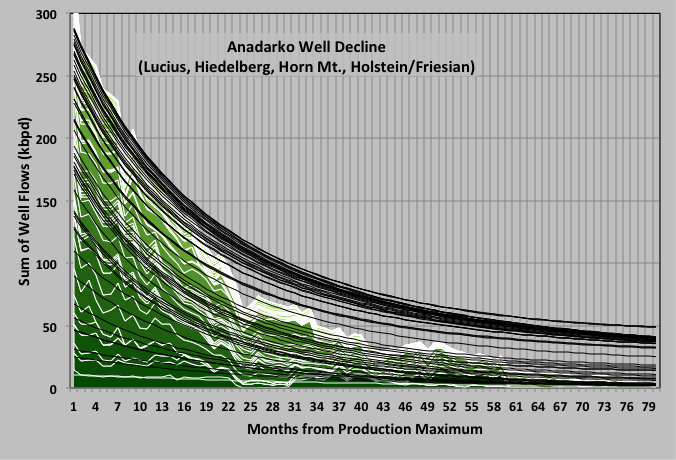
The chart above shows the example of some of wells for Anadarko. In each field the wells are stacked from oldest to newest and all start at their maximum month, so the upper measured curves are shorter and some may not even be in the real decline phase.
Clik here to view.
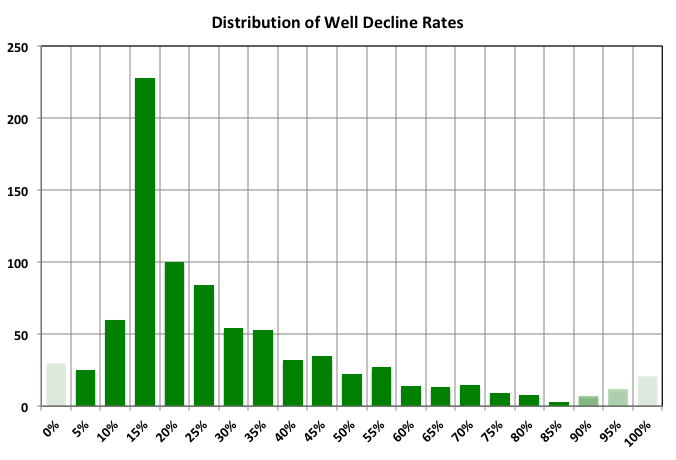
The rates are mostly collected around 15%, but some have are above 50%, e.g. Lucius and Heidelberg have some initially large wells that decline fast with water break through. Older low flowing wells decline much slower, and because the time considered was only from 2014 these numbers are not really representative over the life cycle of the well. A few wells (not shown) have negative decline but are all low producers and, often, intermittent. Those with very high decline rates are either newly started or have ceased flowing, in either case the fit was against only a few and scattered data points. Overall the decline rates are probably better than average for high-pressure wells mostly without external pressure support, but do indicate that to maintain or increase overall production a steady supply of wells from new projects or in-fill drilling is required, and those are starting to run thin.
Well Start-up Activity
The following shows the number of new deep or ultra-deep water wells started up in recent years, plus the total extra flow added once they have achieved their maximum monthly average flow, which may be several months to years later because of ramp up issues or plateau periods. Also shown is the number reaching their maximum and the sum of these maximums each year. These are a bit dodgier as indicators of growth because wells may be on a bumpy plateau and have just a small increase in a given year rather than indicating end of a ramp up or plateau. New maxima do not all come from recently drilled wells but could be from recompletions, work-overs, sidetracks, added gas lift, other causes of reduced wellhead pressure (e.g. as throughput from neighbouring wells is reduced), improved availability etc. These wells would not necessarily correspond to wells shown as new start-ups.
Clik here to view.
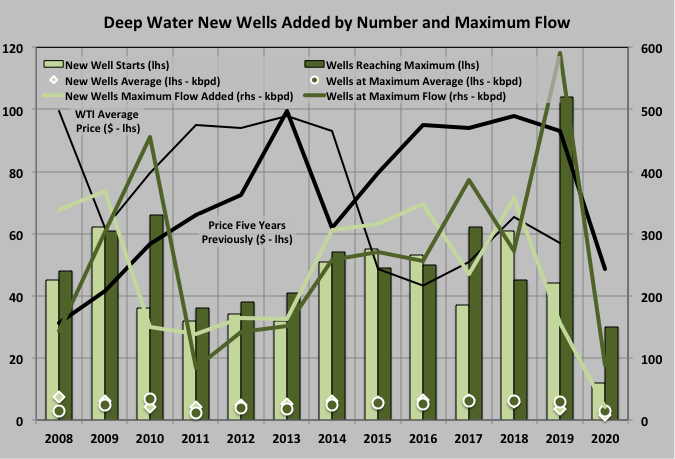
There was a spike in completions in 2009, probably from deep rather than ultra-deep water projects, a dip from 2010 to 2013 and then a steady rise to 2018 with new starts dropping in 2019 and so far collapsing in 2020. Wells reaching a maximum follow a similar pattern but a year or so behind and 2019 had a peak in number and flow of wells reaching their maximum. Likely the 2019 values will decline and 2020’s will increase as some wells exceed their previous maximums. The number of added wells for 2020 is only through June but is unlikely to double in the second half given the CAPEX reduction for all the E&Ps plus other effects of the COVID pandemic and an active Hurricane season. Some of the wells to be added might be quite large producers though, especially for Appomatox and Atlantis Phase III, additionally Stampede and Big Foot are still ramping up and Katmai may come on line, depending on Fieldwood’s bankruptcy.
The pattern of peaks somewhat follows oil price: five years before 2018/2019 was just before the oil price collapse and would have seen major project FIDs, and late 2016 was when the price started to recover so that brownfield developments and small tie-ins were approved, all of which would have started beginning in 2018. However the sample size is a bit small to be conclusive and the net effect of many small individual issues may be the significant factor.
The chart below shows well additions by number and maximum volume according to the field size at the time that the associated well was started. The additions from each group follow pretty much the same pattern (i.e. the same years tend to attract higher or lower number of starts from all groups), and the larger fields tend to result in slightly larger producers.
Clik here to view.
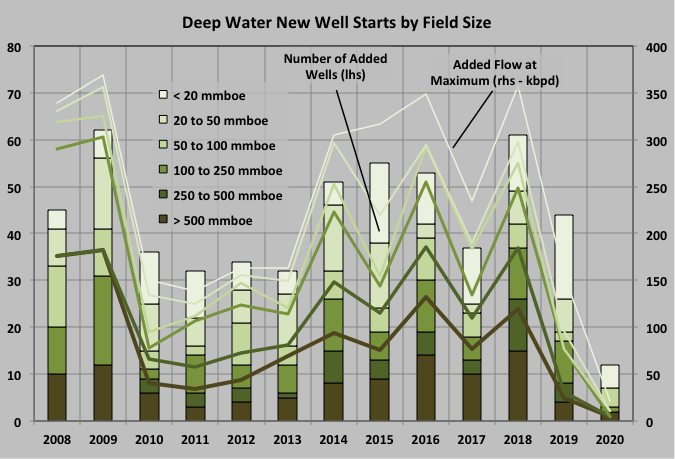
Overall it looks like the next two or three years are going to see declining production compared with 2019, mitigated by the ramp-up of Appomatox and Thunder Horse South Phase II, before some large new developments begin start-up from late 2021 onwards (Kings Quay, Vito, Mad Dog II – aka Argos, Anchor). It seems most of the attractive near field opportunities for existing hubs have been used up and new ones will have to wait until the coming ultra-deep water hubs get through their plateau and have enough spare processing capacity to allow new tie-ins or in-fill wells, or new technologies that allow extended reach tie-ins (and, of course, depending on discoveries).
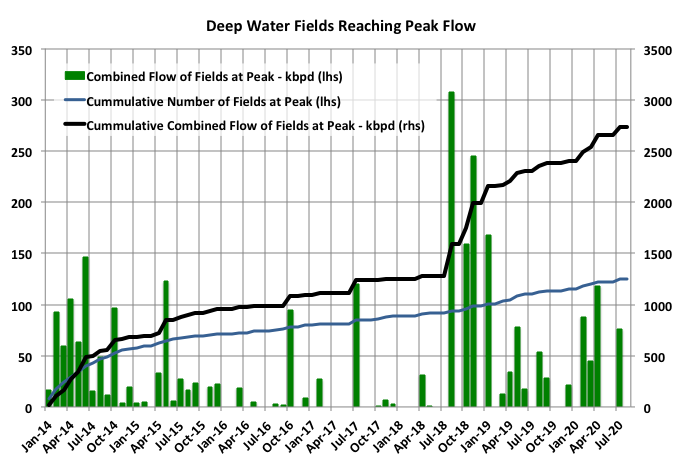
Field Decline Rates
Many large deep water fields peaked around the second half of 2018 and have been declining, slowly, since. The pace at which fields have peaked is slightly higher in the months since then than before . Another set of smaller fields peaked in early 2020 some of those may yet ramp up further as production recovers or new wells are added but several of these are one or two well tie-backs and have been declining as expected since a peak in their first couple of months on stream. Only Dalmatian, Coalecanth and Buckskin peaked in July (and for these it could be a final peak) but Appomatox and Big Foot will certainly exceed current maximums as drilling progresses.
Clik here to view.
In order to look at mature field declines (i.e. those started before about 2010 or without significant new associated field discoveries since then) they were split into three groups: shallow water, those operated by the majors (which include the still high producing fields like Thunder Horse, Atlantis, Shenzi, Mad Dog, Caesar/Tonga/Tahiti) and other mature deep water that are all well into the decline phase (albeit with occasional brown field impacts).
Clik here to view.
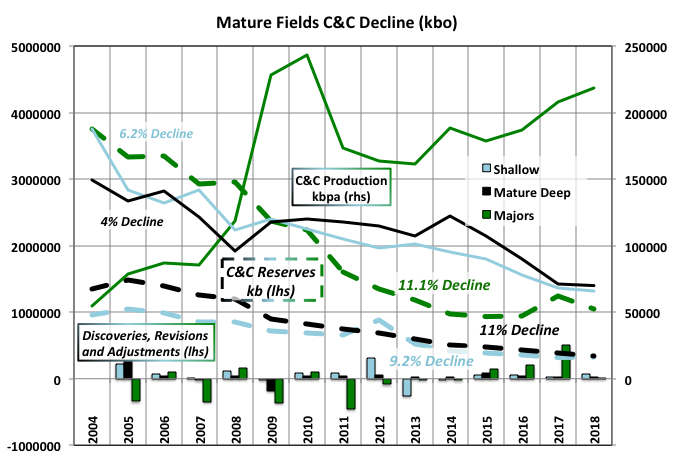
Each group shows a significantly higher decline rate for the remaining reserves than for their production rates, in fact the ‘majors’ group shows steadily increasing flow. This means their respective R/P numbers have been declining and either the reserves are under-estimated (by a lot) or something is going to give and production declines increase considerably. From 2005 to 2018 the R/P values for shallow/mature deep/majors fell from 7.4/11.1/41.5 to 4.9/5.4/4.8 years. Even the group of remaining non-mature fields (i.e. recent start-ups) has an average R/P value that has been steadily falling to reach 4.8 years in 2018. Values around five imply decline rates of 20%. There are signs that the small deep mature group has entered a steeper decline starting in mid 2019 after a plateau period, partly the result of production deferment after the Enchilada platform fire and Garden Banks pipeline shutdown but with extensive brownfield development. Shallow fields might be similar but the Covid related shut-ins make any new trend difficult to see at the moment. There have been small net increases in the overall reserves, probably mostly from small near field discoveries and/or IOR initiatives, for the shallow and mature deep groups but these have been trending down towards zero (probably in the next few of years). For the larger, major operated fields downward revisions from original estimates have exceeded new discoveries so far, due mainly to large decreases in Atlantis and Thunder Horse soon after their start-ups.
The peak month for the majors group was December 2018 (with the maximum for the trailing twelve month average in January 2019). Even the group of recent start-ups (i.e. everything else and not shown in the chart) had a local peak in February 2020 (average annual peak in March/April ) and has declined by 30% since – see below for further discussion on Covid-19 and Tropical Storm deferment effects.
Leasing Activity
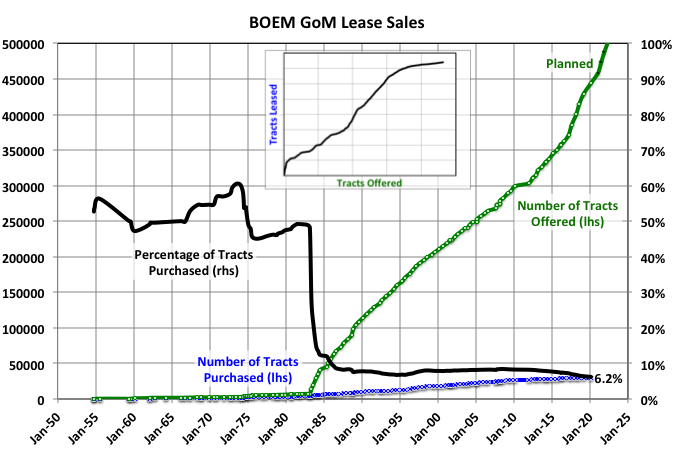
In 2016, under the Obama administration, BOEM stated that it would present for sale all remaining available leases in Western and Central GoM in a series of tranches up to 2022. The Eastern area is mostly under a drilling moratorium until at least 2022 but is generally considered not to be highly prospective and the few discoveries there have been natural gas. There are five auctions planned, although that for August was cancelled, and others might follow suit if oil prices and E&P activity remain low. Each sale is for about 14,500 tracts meaning about 70,000 are available, but recent uptake has only been a bit above 6% and falling so maybe only 3000 to 5000 would be sold to add to the 1200 existing open leases. This is considering non-shallow wells only; there are still some shallow leases available but recent discoveries have been insignificant.
Clik here to view.
GoM leases are held open initially for 5, 8 or 10 years. If they are not then retained by production or exploration activity they expire; they may also be relinquished early or extended if an operators request is accepted by BOEM/BSEE. Most by far are ceded without seeing any production. All water depths have seen a declining proportion of operated leases even as the numbers purchased have been declining at each sale. The lines in the chart below show a five-year average of the proportion reaching production out of all the non-open leases (i.e. closed or held b activity); the indicated recent drop in ultra-deep water is an artifact of low sample numbers (i.e. there are some small producing fields from direct tie-ins to exploration wells and a few more that have been relinquished, but most are still open) and will disappear as the sample size increase. For all water depths 98 to 99% were ceded in the 2010s and the trend is slowly upwards. Therefore of the yet to be sold leases only 30 to 100 would go on to produce anything, with (a complete guess) an additional 50 to 100 from those presently open (a higher proportion because these have already been winnowed to some extent).
Clik here to view.
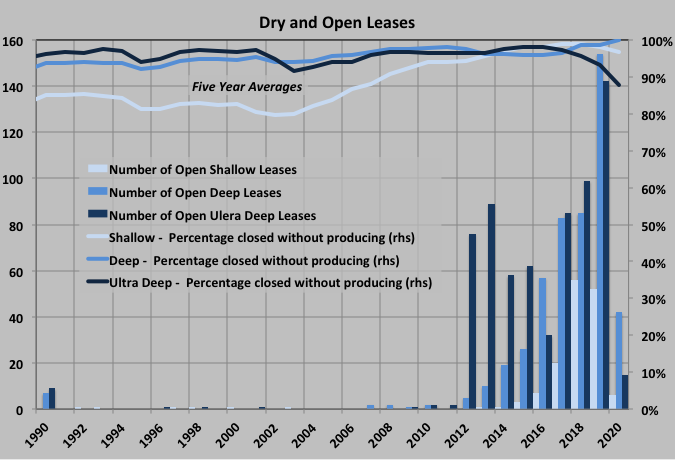
Of the open deep-water leases only fourteen (seven in each of deep and ultra-deep water) have had wells drilled in them, and six of those are under development already.
This is not the full picture because there may be new exploration wells and new field discoveries in leases that have already been developed (or for some shallow lease have been relinquished after depletion of the original discoveries) but these would tend to be smaller producers that were either missed the first time round with older technology or had unattractive economics (e.g. not worth designing facilities for but alright for a tie-in once capacity is available).
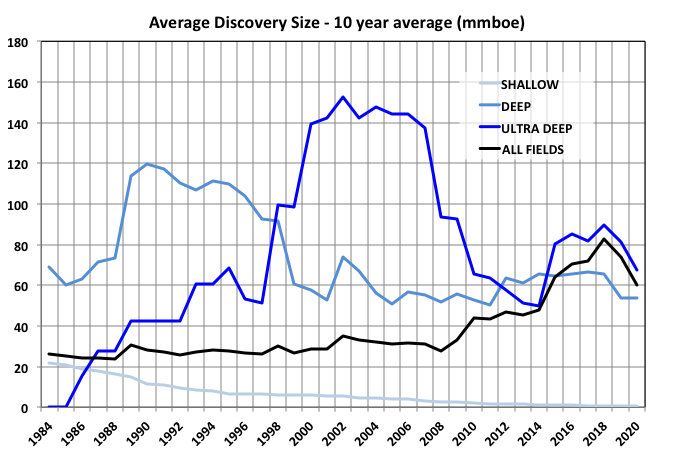
A ten-year running average of recent discoveries, including estimates for fields under development and putative discoveries, is shown below. Current average for deep and ultra-deep is 60mmbbls and falling, but this includes gas and NGLs; for C&C only it would be 45 to 50. Allowing for continued decline, which seems unlikely to be reversed in the medium term given recent history of successes, 30 to 40 might be a better range. It is unsurprising that the uptake and success rate of leasing has been falling as there is close contact between the industry and the regulators and the best land tends to be offered first plus many of the tracts have been offered before and been left unsold or subsequently ceded.
Multiplying the range for the expected number of producing leases by the range for discovery size gives expected future reserve discoveries of 2.4 to 8Gb, but with a likely median closer to the low end. Again a value around 32Gb looks reasonable.
Clik here to view.
As part of the 2016 initiative for the final leasing program BOEM released estimates for recoverable reserves in the tracts to be offered (half of which have already been auctioned). For C&C these were 2.1Gb for $40 oil, 3.5 for $100 and 5.6 for $160. I think trying for accuracy like this is a bit ridiculous when there are so many future unknowns – e.g. in the present environment operators are asking for and getting up to 40% CAPEX cuts and deep-water rig day rates have collapsed – but it is what the models churn out and it does indicate the complexity and/or reliance on existing infrastructure of the putative developments.
Project Schedules
Clik here to view.
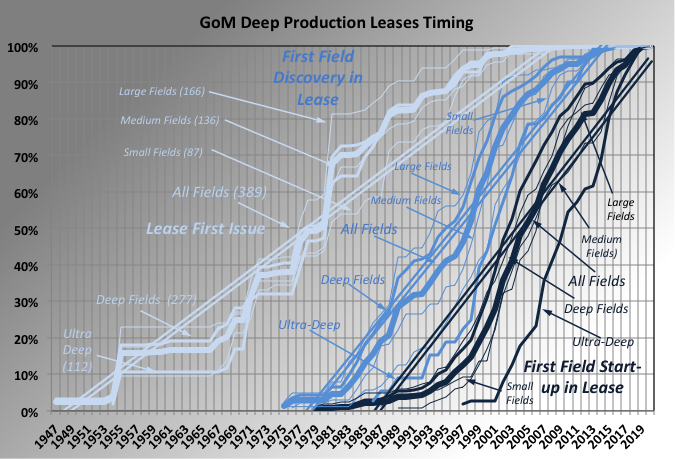
The chart above shows the cumulative number of lease sales, first discovery in each lease and first production against the year for the main field against which the lease is listed by BOEM, for deep-water start-ups. The curves are categorized according to depth of water and field size (small fields are less than 20mmboe, medium fields are 20 to 100mmboe and large those above 100mmboe). The numbers are normalized so they are directly comparable. The time to discoveries has been narrowing, probably as technology has improved, down to about eight years. The time from discovery to first production, which for the main field would require development of a platform hub, has been pretty steady at nine years. Deep and ultra-deep fields take about the same time; small fields are done in five to six years, medium fields in nine to ten, and larger fields in just over ten. Appraisal and development time is dependent on human factors: engineering and construction man-hours, planning and regulatory processes, procurement cycles, installation windows etc., and are unlikely to shorten but could slow as supply chains shrink and skilled labour is lost.
COVID19 and Tropical Cyclone Shut-ins
The effects of oil and gas prices, and possibly manpower shortage, after the Covid19 lockdowns had a dramatic effect on the number of inactive wells (i.e. shut-ins) and production in May. Mostly it affected shallow wells with 293 extra wells inactive compared to 53 in deep water. In June the additional inactive count had reduced to 239 for shallow and 7 for deep. It’s possible that some shut-ins allowed planned maintenance work to be bought forward and so avoid net deferment.
Clik here to view.
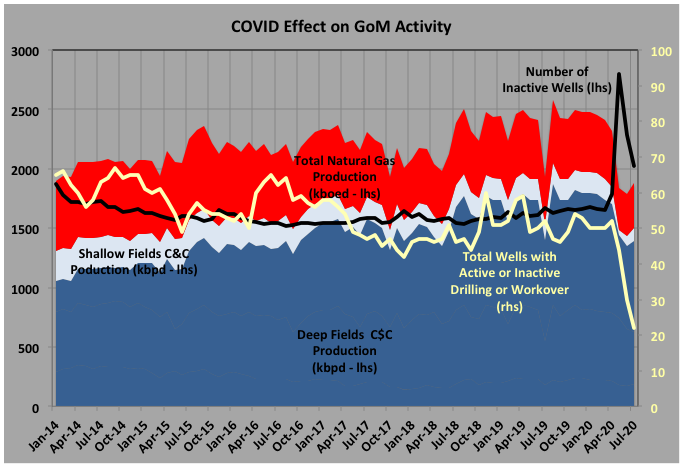
Hurricanes show only minor ripples on the inactive numbers but bigger impacts on production, probably because they only last a few days but tend to affect larger normally-attended deep-water platforms. According to BSEE figures Cristobal knocked off a monthly average of 141kbpd of oil and 34kboed gas in June, Laura/Marco 415kbpd (78 for gas) in August, Laura/Sally 152kbpd (33 gas) in September and in October Delta/Zeta deferred 593kbpd (103 gas) . There were significant pauses in drilling too, for both platform rigs and MODUs, with a total of 303 drilling days lost.
At the time of writing in early November Zeta has just exited (contributing 56kbpd C&C and 8 gas off-line for the month) and TS Eta is threatening some further disruption. This year has been particularly active because of continuing high and rising ocean and Gulf water temperatures, a mild La Nina to reduce Atlantic wind shear and possible effects from lower aerosol levels. Hurricane season peaks in the firs weeks of September and continues through November, but is tending to start earlier and remain active longer as climate change accelerates.
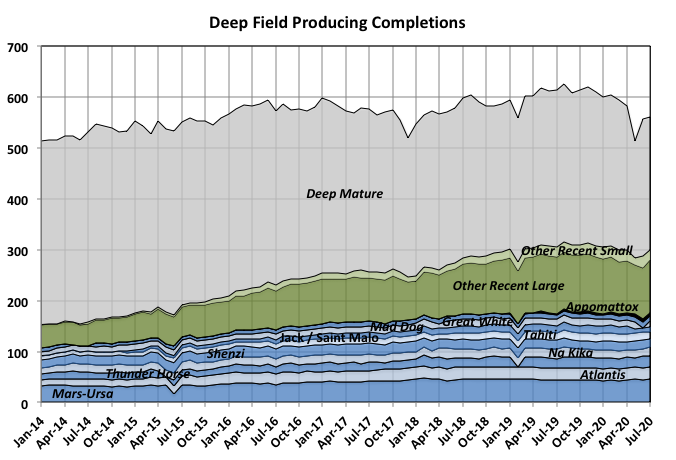
Bottom Up Projection Estimates
Even without the pandemic and weather interruptions it is unlikely that 2020 production would have exceeded or even matched 2018 or 2019, Production had a local peak in August 2019 and has been trending down since. Several of the large, recent start-ups reached plateau in or before 2019 and the brownfield work switched from increasing producing production to maintaining it (e.g. Atlantis Phase II, Thunder Horse South Phase II, St. Malo Water Injection). Additions of producing completions have declined while older wells continue to be exhausted, so the overall number of producing completions has been declining since late 2019, with a large Covid related drop in May.
Clik here to view.
Many of the medium to large fields are showing increasing water breakthrough to the extent that it is probably limiting processing capacities as well as well flow rates (Atlantis, Shenzi, Mars-Ursa fairly steady at 3 to 4% increase per year; Gunflint, Marmalard, Dantzler, Cardamon faster at 15 to 25%; Lucius and Heidelberg with continuous issues; several small tie-backs showing immediate and rapid breakthrough; Jack/St. Malo just beginning; other large fields starting to rise as production increases plateau).
Two fields are continuing ramp up: Big Foot has two of eight producers on-line and bring another one on every seven to eight months at about 13kboed, but it also needs three water injectors; and Appomattox has 6 of 15, and with two rigs operating adds one every 4 to 5 months at 10 to 33kboed so far. All the new wells appear to start declining soon after start-up at around 15% per year but there is limited data so far. Some tie backs are planned and likely to proceed eventually, the largest are: PowerNap to Olympus (35kboed), Leon to Lucius and (with questionable timing as it is for the bankrupt Fieldwood) Katmai to Tarantula.
From 2021 onwards some larger fields will begin to ramp-up: Argos (Mad Dog II) with 140kboed capacity, Vito at 80kboed, Kings Quay at 80kboed (but only 50 utilised without more tie-ins) and Anchor at 80 to 100kboed. The GoM doesn’t utilize much pre drilling even for sub sea completions, and the current oil price and slow down militates further against so these will take at least a year to ramp up. There are many fewer near field tie-ins and in-fill drilling developments than 2017 through mid 2019 so it is hard to see production not taking a considerable dip, at least through 2022, given the decline rates of the fields.
For the latter half of the 2020s there are some large developments in the (now delayed) queue for FID: Whale, probably at 80kboed; Ballymore at 100; and North Platte at 75kboed; plus a number of significant discoveries in appraisal: Dover, Shenandoah, fields associated with the proposed Tiber hub, Blacktip; and some possible extensions: Atlantis Phase III, Julia II, Mad Dog III, various fields around Appomattox. However, given that average project development time is around five years and the FIDs will probably need to wait for a price recovery, then any additional production is some way off.
Recently Hess presented at an energy conference and stated that it would not pursue near field prospects – these days often referred to as infrastructure led exploration or ILX – until WTI price reaches $50. Also presented was a list of breakeven prices developed by RH Energy Consultancy. These were developed in January 2018 and so probably are a bit high for current conditions given about a 5% fall in the IHS upstream capital cost index, a collapse in rig rates and, likely, a bit for process “right sizing”. Some prices given were, for projects in operation: Heidelberg – $53, Appomatox – $60, Stampede – $62, Big Foot – $71; those in development: Vito – $44, Anchor – $62; and those in appraisal: North Platte – $ 59 and Shenandoah – $65. These are just breakeven floor prices without allowing for company profits, contingency etc. and would probably need to be exceeded for around six months before FIDs were to be reconsidered. Therefore, overall, there seems to be a low probability for much short or long cycle development in the near future even given a miracle vaccine and rapid economic recovery.
In the longer term the trends for wildcat exploration and discoveries show: a diminishing inventory of prospects; a slow decline in the number of wells drilled over the past few years before the sudden dive this year; a fall in number and (probably) the size of discoveries; and a move to ultra-deep water, frequently high-pressure-high-temperature fields and often requiring innovative 20ksi completions, and hence relatively more expensive and complex. For future wildcat discoveries first oil is at least five and up to fifteen years after discovery (i.e. maybe seven to twenty five years from now). A more likely source for undiscovered oil is near field exploration around the hubs currently under development or appraisal, but these can only be tied in once the originally developed fields start to decline and processing capacity becomes available – hence still about seven years ahead at minimum. Additional issues will come from labour resource availability. The industry was suffering from a greying workforce and being an unattractive environment for new graduates. Now most E&Ps are laying off large numbers, many of whom will be voluntary retirements of senior personnel. The service industries are cutting back, the EPIC contractors are pulling out of competitive bidding and the deep-sea drillers are all facing bankruptcy.
Low Case
The low case is based on current BOEM reserve estimates for producing fields except for a few that are obviously underestimated given the present decline rates (e.g. Big Bend should be exhausted by now based on the production since 2018 but is still going strong). All are assumed to start declining immediately except for a few from BP and Murphy, which have parts of future production profiles available from recent company presentations and where the estimated declines would be significantly lower than the observed well declines, in which cases I increased plateau periods and/or design throughputs. The fields in development and planned have reserves based on available data, e.g. company press releases, Rystad etc., or approximated from announced production rates or tie-in details (number of wells, flow line sizes, spare surface capacity) but at the low end of possible ranges especially for those still at concept appraisal. Future discoveries are guessed as a reasonable looking Verhulst curve that fitted the top down curve estimated from reserves (above) allowing for expected discovery and development schedules.
Clik here to view.
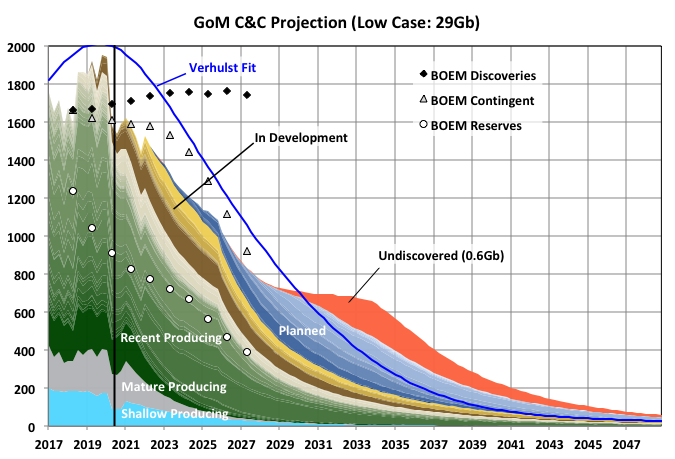
The lines indicated by isolated annual markers show the forecast from BOEM in 2016. I don’t know exactly what BOEM meant by ‘contingent’ – presumably on price in some way – but the stacked reserve plus contingent numbers closely represent all fields currently on production or in development. It matches well the middle case but is above the other cases. I don’t think there is any chance of new discoveries, including those awaiting an FID to be so declared, keeping production as high as indicated.
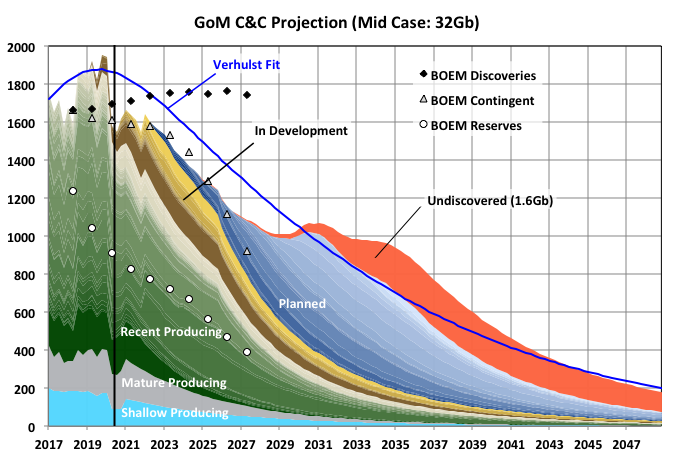
Mid Case
The middle/median case is similar to the low case except reserve growth is allowed on mature shallow and deep fields, and some of the large newer fields better to match recent decline rates, and the planned fields use median range estimates.
Clik here to view.
High Case
The high case uses higher reserves on several fields through lower decline rates on those that have apparently excessive declines based on the BOEM reserves, and using extended plateaus and lower declines for both the larger recent start-ups and those in development or planned. I haven’t changed te start-up timing between the cases but if conditions encouraged high production it is likely some of the putative planned projects would be advanced. The opposite will also happen – if the development environment remains negative then projects will be delayed and some assets may become stranded as aging nearby infrastructure, on which development depends, becomes uneconomic to maintain.
Clik here to view.
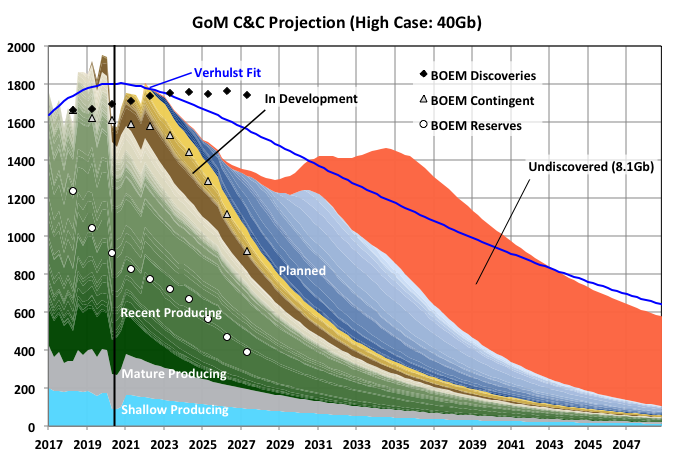
Even with this case it is difficult to see how a significant drop in production over the next five or so years can be avoided, unless the E&Ps have knowledge of some large projects still ramping up or a number of highly prospective near field opportunities that they have not shared. On the other hand there is any number of possible geopolitical events that could further reduce production even on the lower cases (e.g. leasing/drilling bans, continuing economic recession, skilled labour shortages, infrastructure ageing, new pandemic issues, disruption to material and equipment supplies, worsening climate disruptions).
Off Topic Finish: Arctic Ice Retreat
2020 will show the second lowest minimum volume and area of Arctic Sea ice after 2012. It continues a general trend in decline with first place 2012 a bit of an outlier but likely to lose its record in the next few years even without the sort of exceptional weather as seen in 2012 and 2007 (another unusually low year).
The trend can be more dramatically shown by looking at the amount of time the volume in the Arctic Sea’s various regions drops below some threshold. Since 2000 some regions have started going ice free in summer, and now have rising numbers of ice-free days each year. Others are just approaching ice free conditions but the trend of increasing days below a certain level is still clear.
Ice free conditions represent a positive feedback and possible tipping point as, once present, all the sun’s heat goes into raising water temperature (sensible heat) rather than melting ice at constant temperature (latent heat). Volume is closely related to area and as it reduces so too does the albedo allowing more radiation to be absorbed, maybe especially relevant in the peripheral seas that get more direct sunlight radiation flux for longer than the central basin.
Clik here to view.
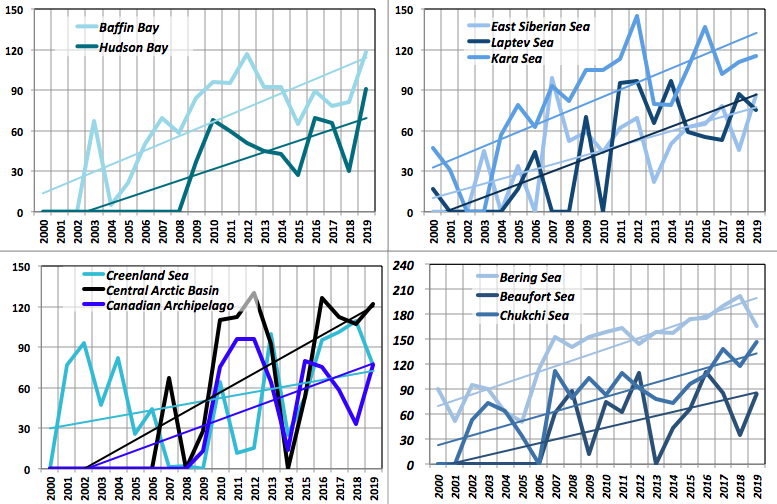
The y-axis shows days per year at or below a threshold volume (by PIOMAS). The Bering Sea and Hudson Bay thresh holds are set as ice free; the other peripheral seas have thresh holds at 10-20% of the average volume from 2000 to 2019. The Central Arctic Basin is set at 50% and the Canadian Archipelago at 25%. The trend gradients for all are close, though this may just be a result of the thresholds I’ve chosen. The Greenland Sea is slower but I think there are two opposing effects: increased melting, which is now dominant, and transport from the thinner and looser CAB ice, which is now diminishing as the overall summer volume falls.
This year is likely to extend or accelerate the trends for all except the Beaufort and Greenland Seas. If they continue at the same rates it seems likely that some of the peripheral seas will be ice free all year round before the CAB goes ice free in September.