All data below is from various sources. All US data is from the EIA. Unless otherwise noted is in thousand barrels per day.
Image may be NSFW.
Clik here to view.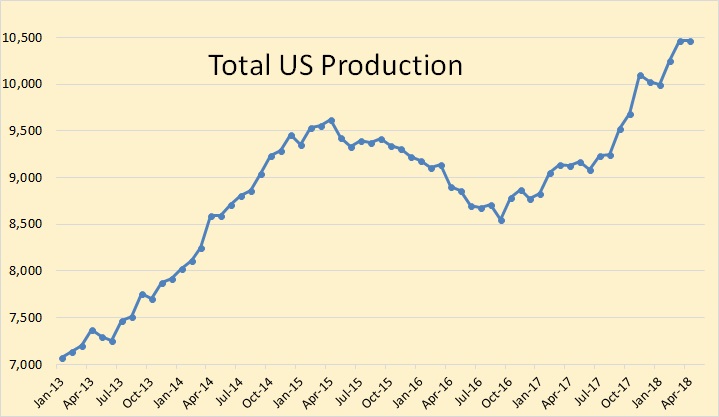
USA data is through April. C+C production was almost flat in April, down 2,000 bpd.
Image may be NSFW.
Clik here to view.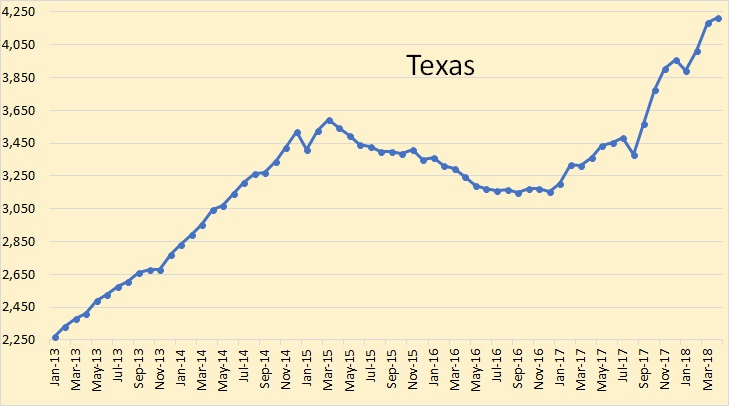
Texas through April. Texas production was up 30,000 bpd in April.
Image may be NSFW.
Clik here to view.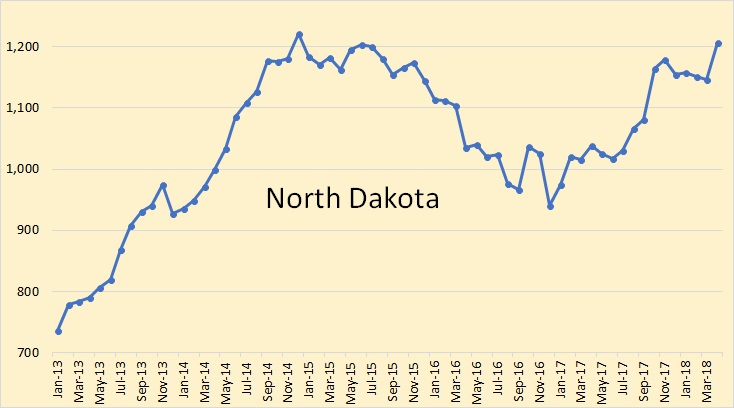
North Dakota through April. North Dakota production was up 61,000 bpd in April.
Image may be NSFW.
Clik here to view.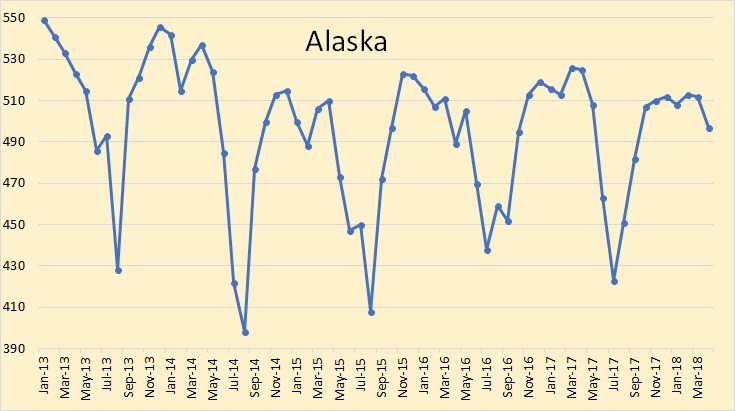
Alaska through April. Alaska production was down 15,000 bpd in April.
Image may be NSFW.
Clik here to view.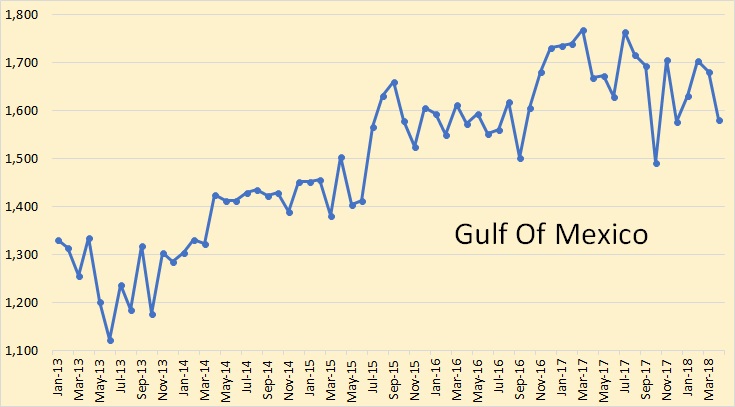
The Gulf of Mexico through April. The GOM was down 98,000 bpd in April.
Image may be NSFW.
Clik here to view.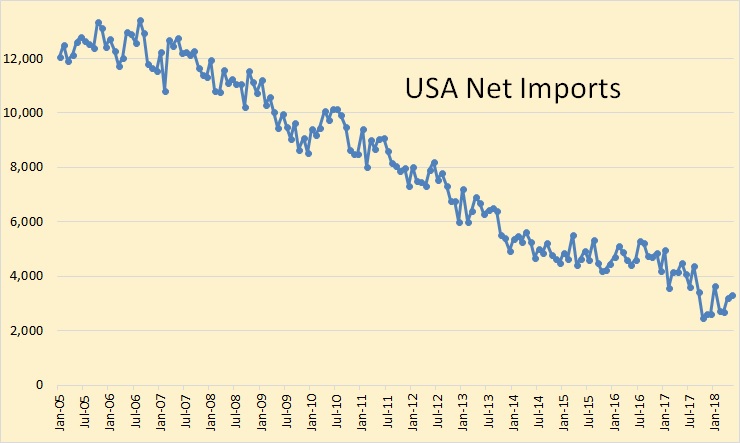
USA net imports averaged over 12,500 kbpd in 2005 and 2006. They are now down to around 3,400 kbpd.
Image may be NSFW.
Clik here to view.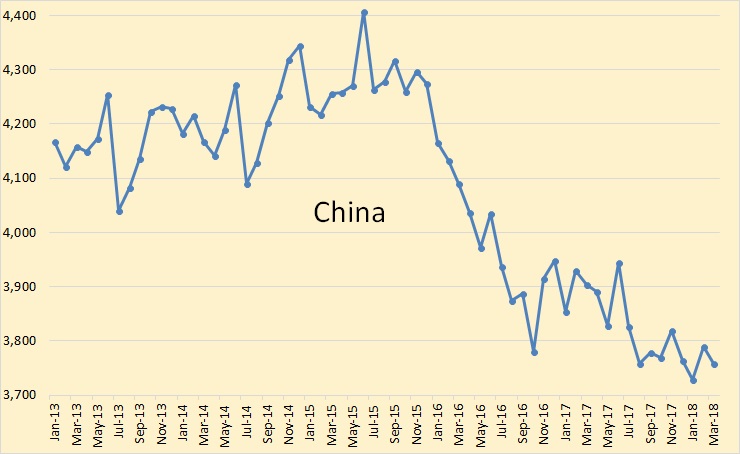
China data through March from the EIA.
Image may be NSFW.
Clik here to view.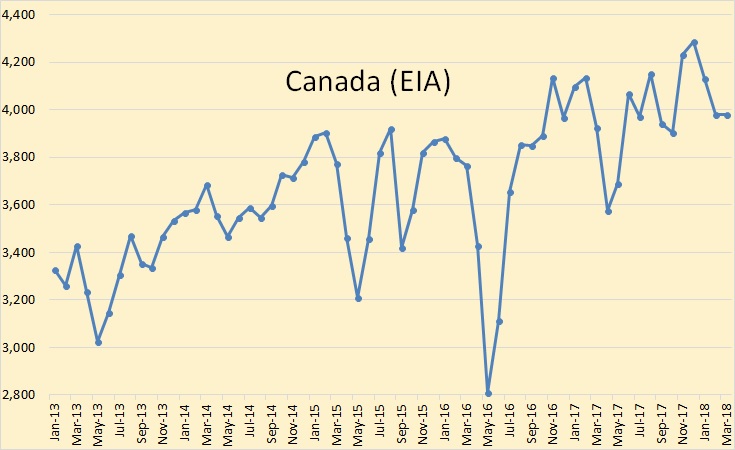
Canada through March, EIA.
Image may be NSFW.
Clik here to view.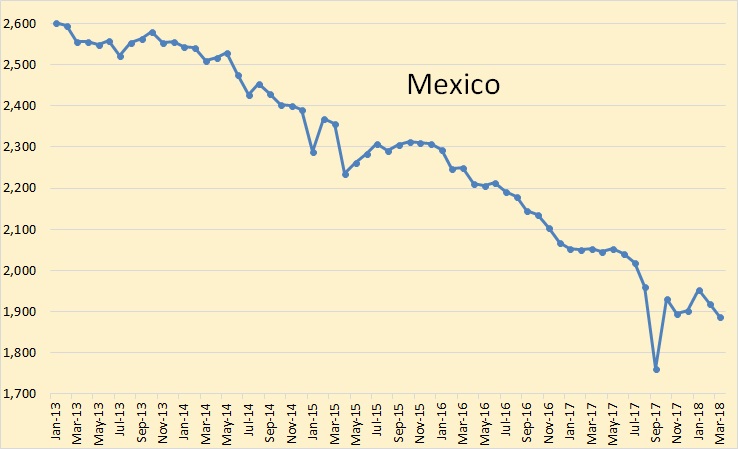
Mexico through March, EIA.
Image may be NSFW.
Clik here to view.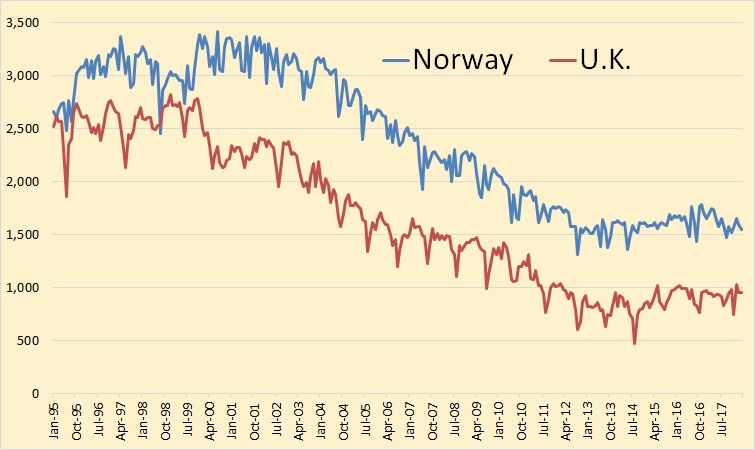
Norway and the U.K. through March. I have included historical data here in order to show the total decline from their peaks around the turn of the century. There has been a recent uptick in production from both countries.
Image may be NSFW.
Clik here to view.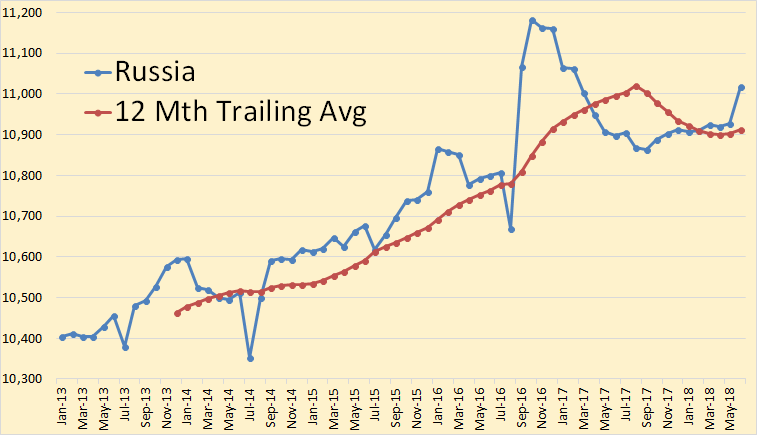
Data for this chart is from the Russian Minister of Energy and is through June. Russian production was up 89,000 bpd in June.
Image may be NSFW.
Clik here to view.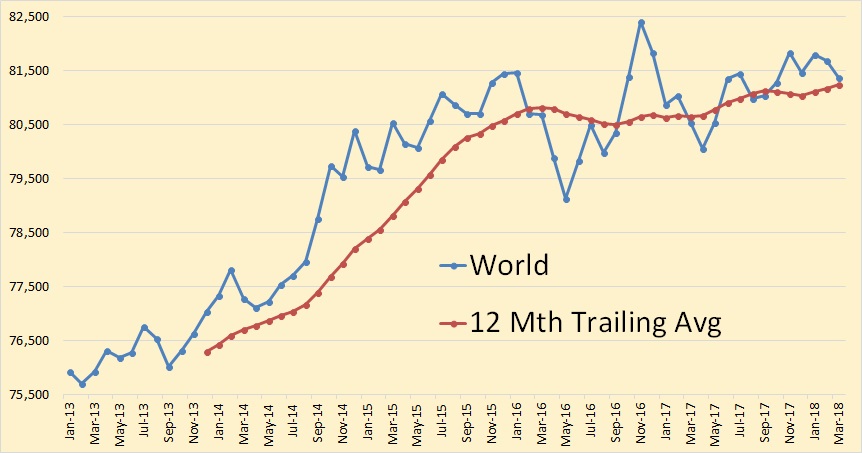
World production through March. World C+C production was down 305,000 bpd in March.
Image may be NSFW.
Clik here to view.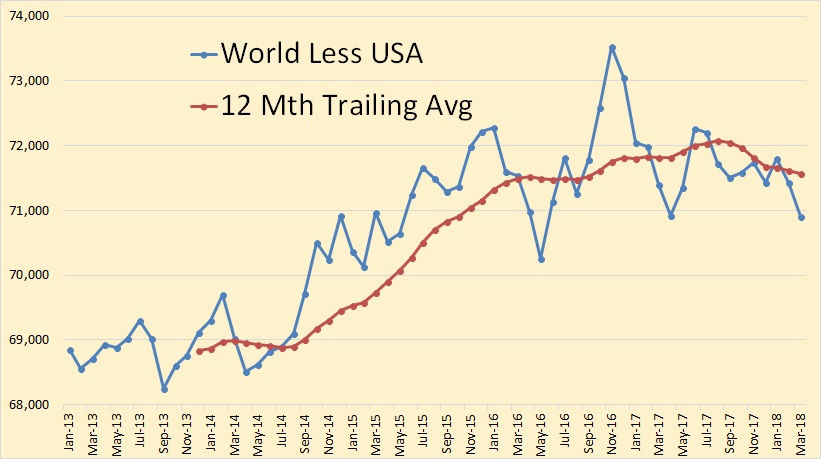
World less USA through March. Without the US input, World C+C would have been down 520,000 bpd in March if the EIA’s figures are correct.
Image may be NSFW.
Clik here to view.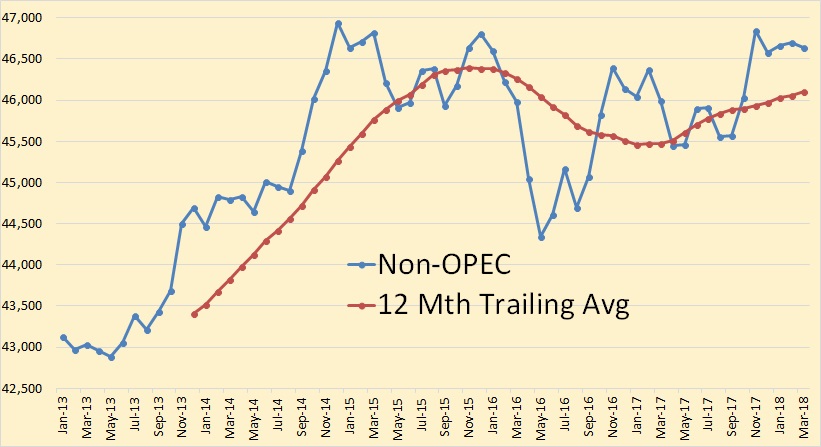
Non-OPEC production was down 63,000 bpd in March.
Image may be NSFW.
Clik here to view.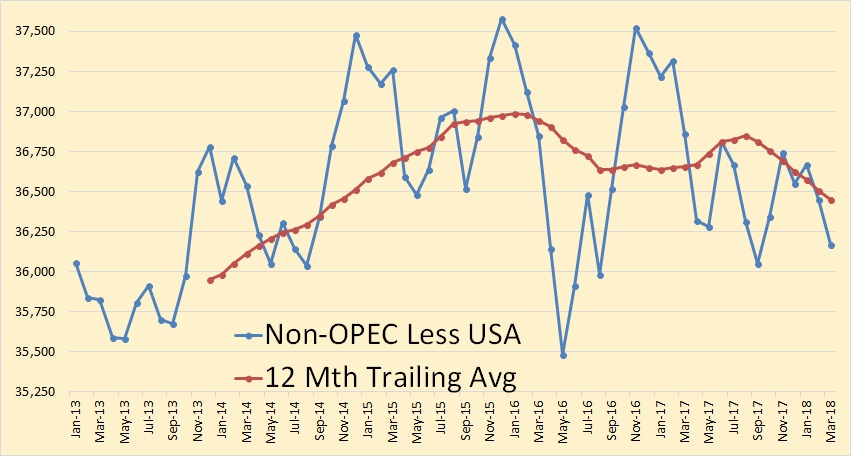
Without US production Non-OPEC would have been down 278,000 bpd in March.
Thanks to Dr. Minqi Li, Professor, Department of Economics, University of Utah for that fantastic post: World Energy 2018-2050: World Energy Annual Report (Part 1)
I don’t do natural gas or coal but I do have a few comments on his oil numbers. In the table below I have converted metric tons to barrels using 7.33 barrels per ton. All data is in billion barrels. I have calculated cumulative production by subtracting RRR from URR. Even though their estimate of URR may be highly inflated, and I believe it is, this makes no difference because they calculated RRR by simply subtracting cumulative production from their estimate of URR. I simply reversed that process.
All data is crude plus natural gas liquids. Of course, that includes condensate.
Image may be NSFW.
Clik here to view.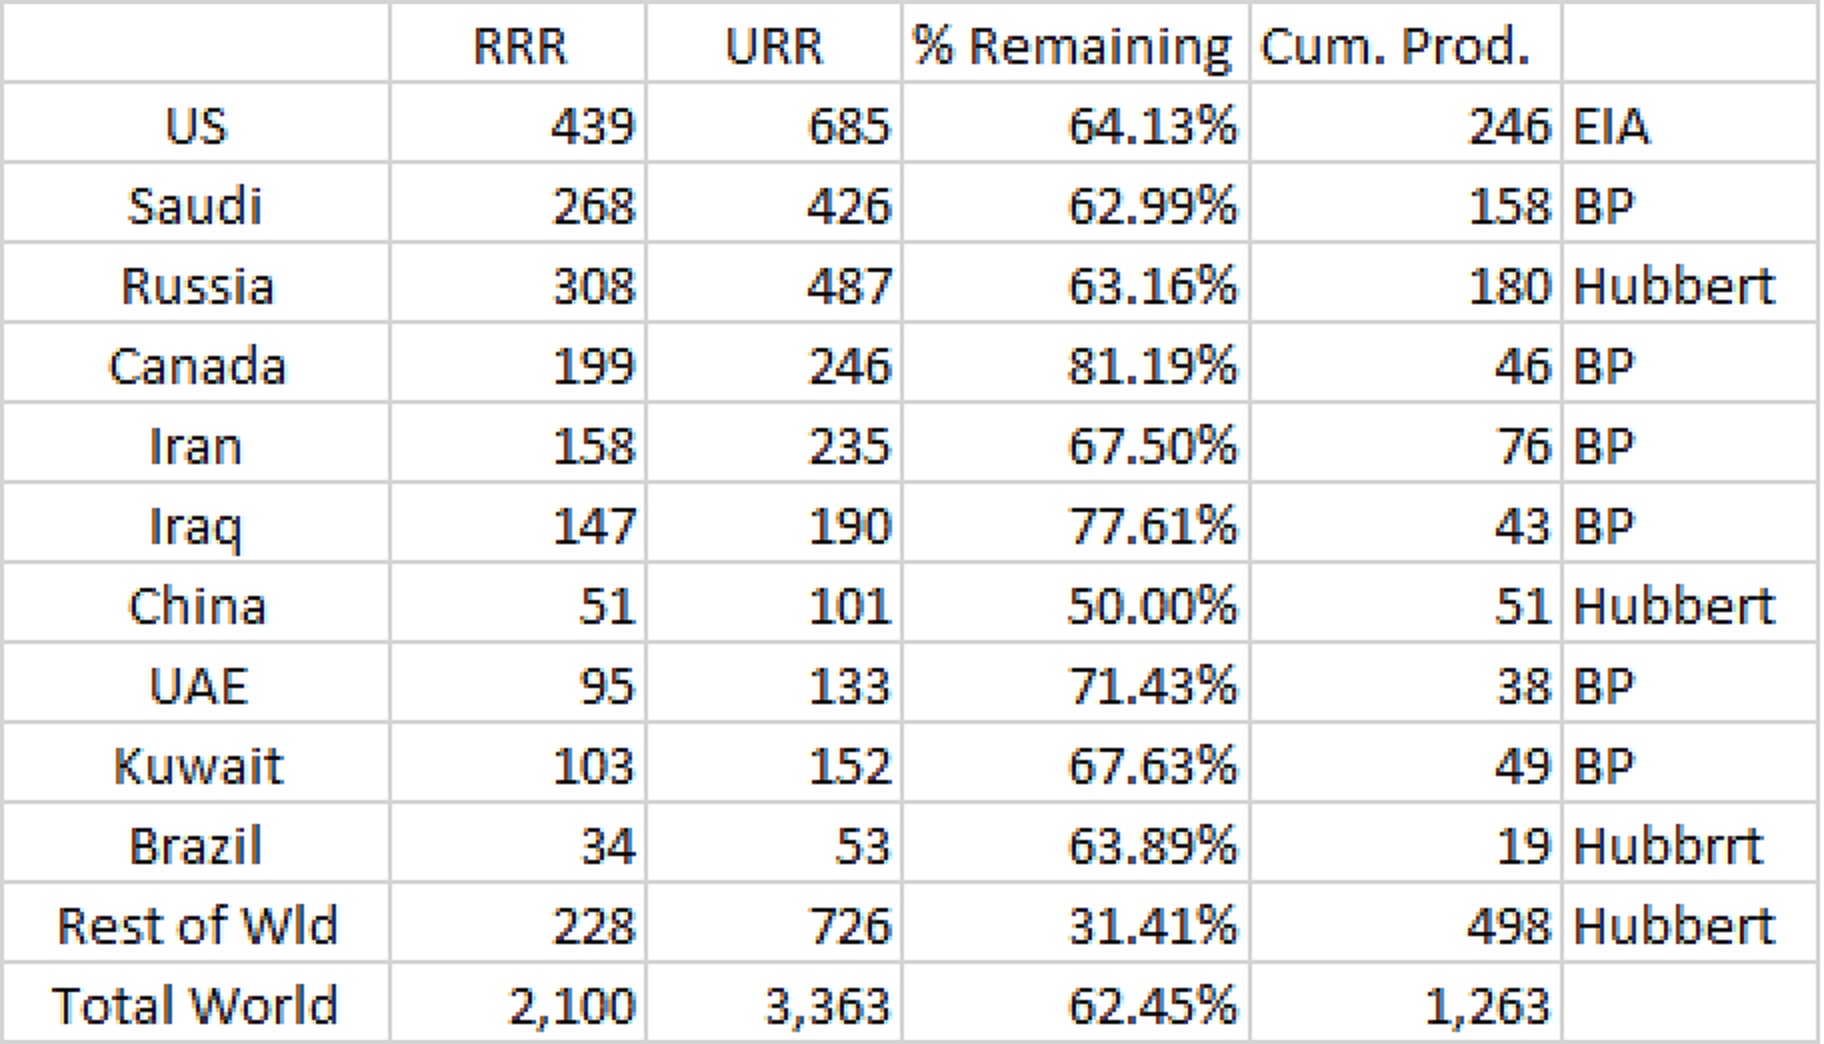
I think the EIA data for the US is highly inflated. They are grossly overestimating the input from shale oil here. The BP data for OPEC, obviously what BP has done here is just to take each OPEC nation’s word for their reserves. I have no comment on their Canadian numbers.
The Hubbert Linearity method was fairly accurate before the age of creaming. As long as conventional wells were used, the Hubbert method gave you a pretty good estimate of URR. And you could also calculate the probable decline rate with the Hubbert method. But no more. A field is creamed by massive infill drilling with horizontal wells that skim the very top of the reservoir. The decline rate is then drastically reduced while the depletion rate is drastically increased. Things will go just great until the water hits those horizontal wells at the top of the reservoir. Then production will drop like a rock.
Daqing was creamed. A UPI article from December 2014, China’s largest inland oil field depleting, had this comment.
The field has produced more than 15 billion barrels since operations began in 1960. Last year’s annual production was around 290 million barrels, though that should fall to around 234 million barrels by 2020, the employee at PetroChina said in an interview published Sunday.
In 2015 Daqing produced about 800,000 barrels per day. If it were to produce 234 million barrels in 2020 then that would be about 640,000 barrels per day or a decline of about 160,000 bpd. Looking at the chart below I think those figures are extremely optimistic.
Image may be NSFW.
Clik here to view.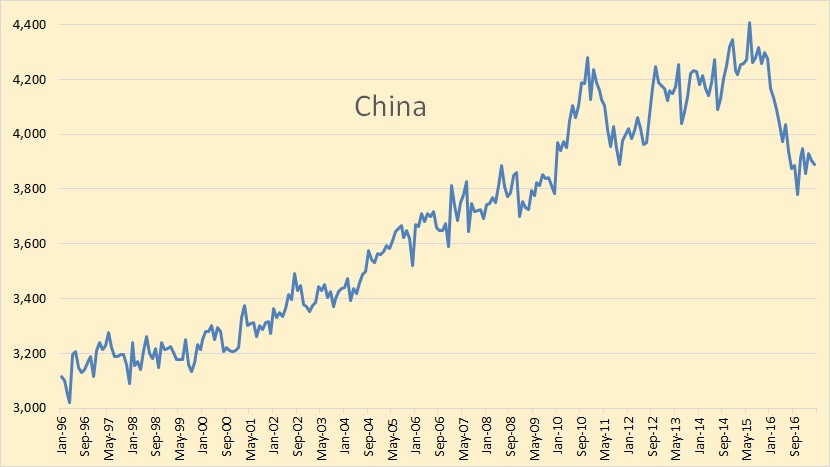
China’s production has dropped by over 400,000 barrels per day in the last three years. And the lions share of that decline has to be Daqing.
In the table below I have converted the data Dr. Minqi Li presented in metric tons per year to million barrels per day. Again, this is C+C plus natural gas liquids.
Image may be NSFW.
Clik here to view.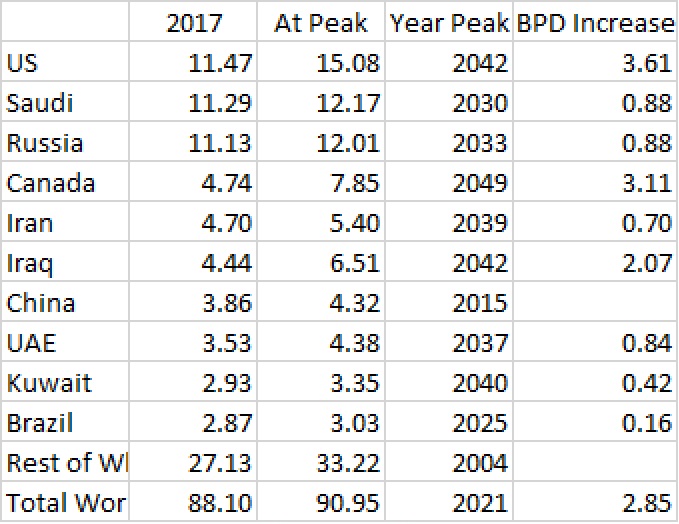
The source for this chart is the same as the table above. I believe due to OPEC massively inflating their URR, and the inaccuracy of the Hubbert method due to the creaming of all giant fields, the expected peak dates here are highly inaccurate. Well, all except three. The rest of the world did peak in 2004, China did peak in 2015, and the world will peak by 2021 or before. Congratulations to Dr. Minqi Li, the most accurate future peak there is the one that he calculated.