Here are the latest oil production numbers from the EIA. All data is in thousand barrels per day unless otherwise noted.
Image may be NSFW.
Clik here to view.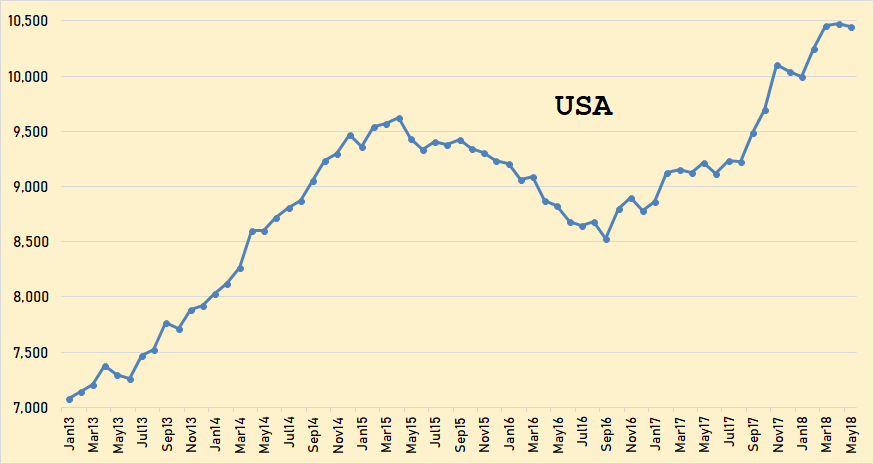
The USA through May 2018. The upward surge has stalled for the last two months. US production was down 30,000 bpd in May.
Image may be NSFW.
Clik here to view.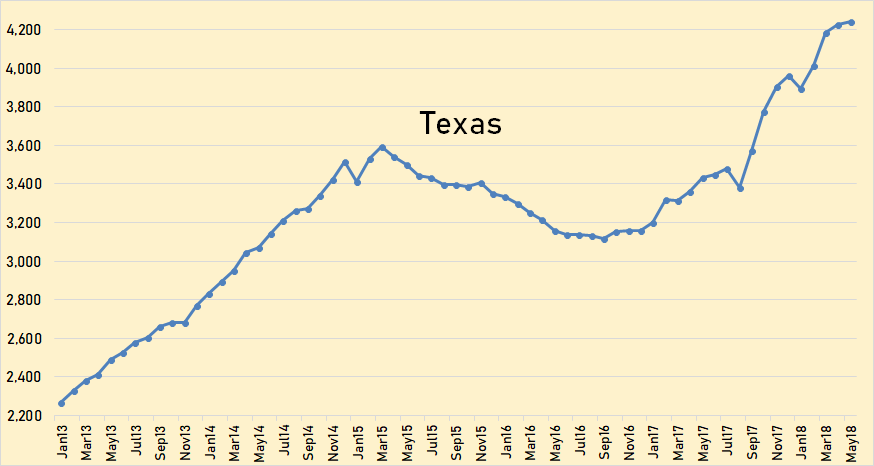
It is a little astonishing how close the Texas chart resembles the USA chart. Texas is, by far, the USA’s largest producer. As Texas goes, so goes the USA. Texas production was up 20,000 bpd in May.
Image may be NSFW.
Clik here to view.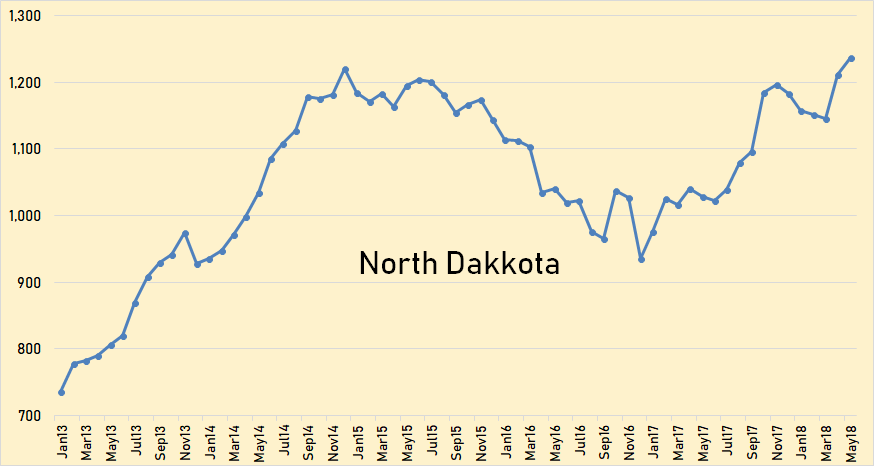
North Dakota production has increased significantly in the last two months. They were up 67,000 bpd in April and up another 25,000 bpd in May.
Image may be NSFW.
Clik here to view.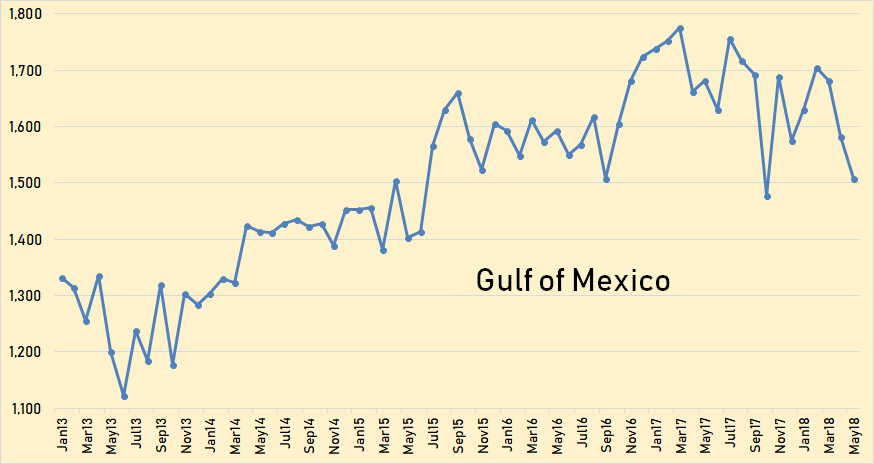
Gulf of Mexico production was down 99,000 bpd in April and down another 75,000 bpd in May.
Image may be NSFW.
Clik here to view.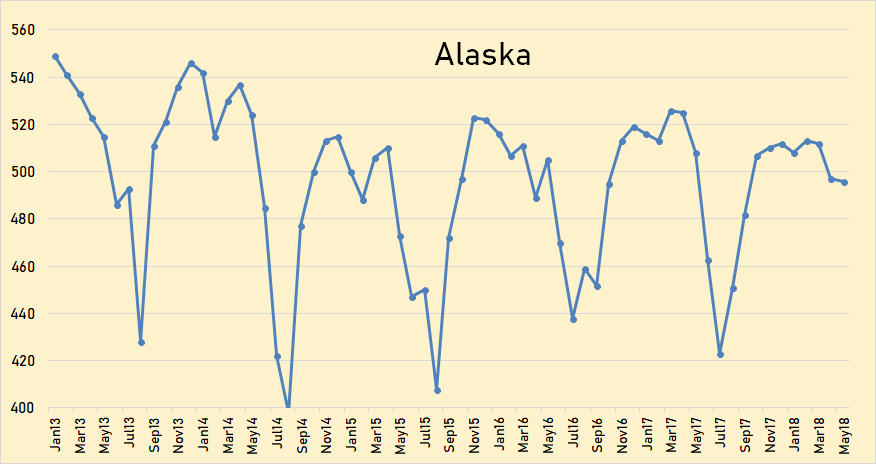
Alaska was down only 1,000 bpd in may but that was 12,000 bpd lower than last may. They are now entering the maintenance season. Expect huge drops in June and July.
Image may be NSFW.
Clik here to view.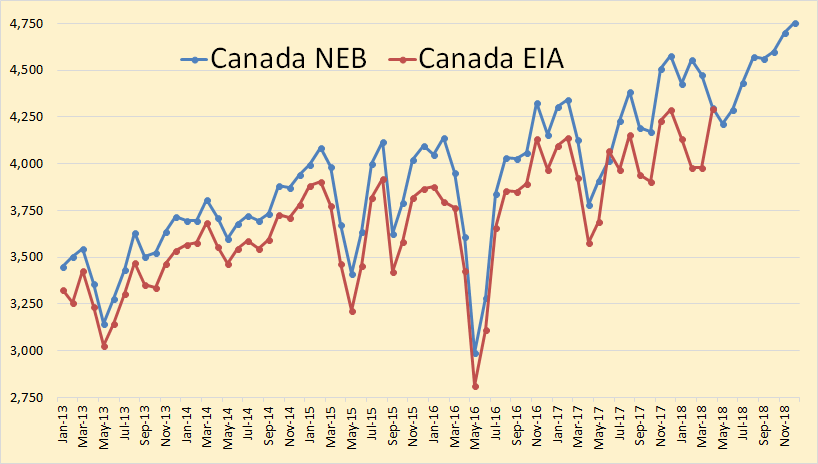
The EIA data in this chart is through April and the National Energy Board data is <b>estimated</b> through December 2018. The EIA data is usually lower than the NEB data but they both agree on April production.
Image may be NSFW.
Clik here to view.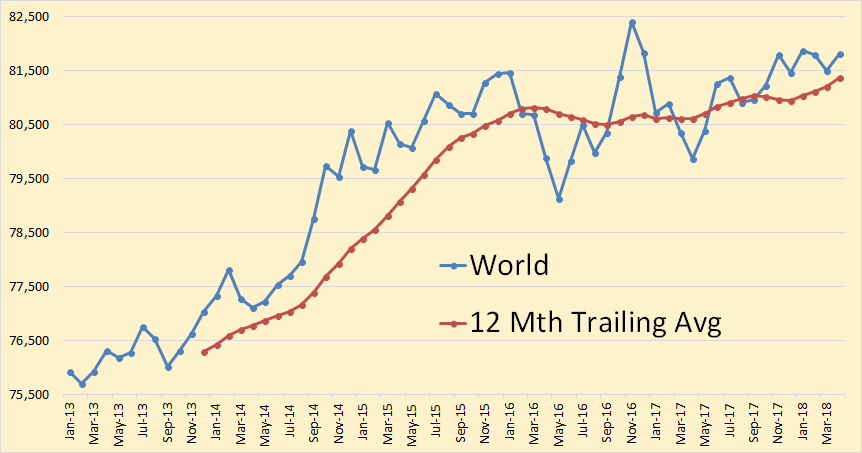
World crude oil production was up 326,000 bpd in <b>April.</b>
Image may be NSFW.
Clik here to view.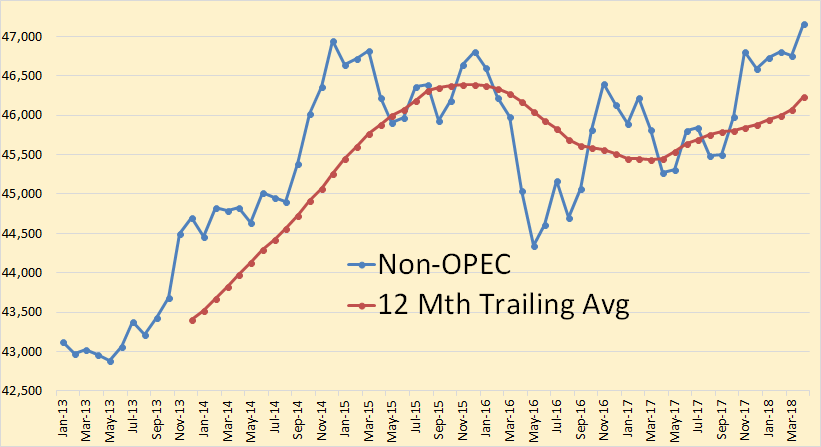
Non-OPEC production reached a new peak in April, up 405,000 bpd to 47,159,000 bpd. Most of that increase was Canada, up 317,000 and the U.K., up 111,000 bpd.
Here I am adding a few charts and comments from ExxonMobil’s 2018 Outlook for Energy: A View to 2040. Their text is in italics. Any bold in their text is mine.
Image may be NSFW.
Clik here to view.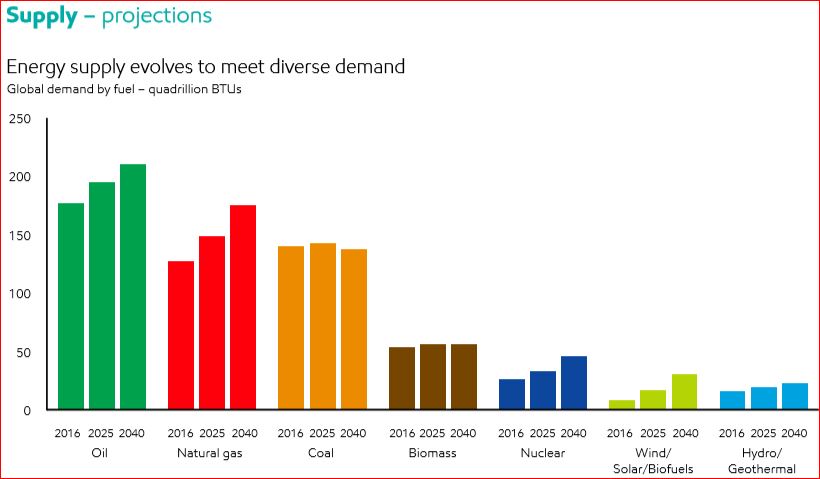
• Technology improvements lead to wind, solar and biofuels increasing, with a combined growth of about 5 percent per year
• Non-fossil fuels reach about 22 percent of total energy mix by 2040
• Oil continues to provide the largest share of the energy mix; essential for transportation and chemicals
• Natural gas demand rises the most, largely to help meet increasing needs for electricity and support increasing industrial demand
• Oil and natural gas continue to supply about 55 percent of the world’s energy needs through 2040
• Coal’s share falls as OECD countries and China turn to lower-emission fuels
• Nuclear demand grows 70 percent between 2016 and 2040, led by China
• Wind, solar and biofuels reach about 5 percent of global energy demand
They assume that supply will always evolve to meet demand.
Image may be NSFW.
Clik here to view.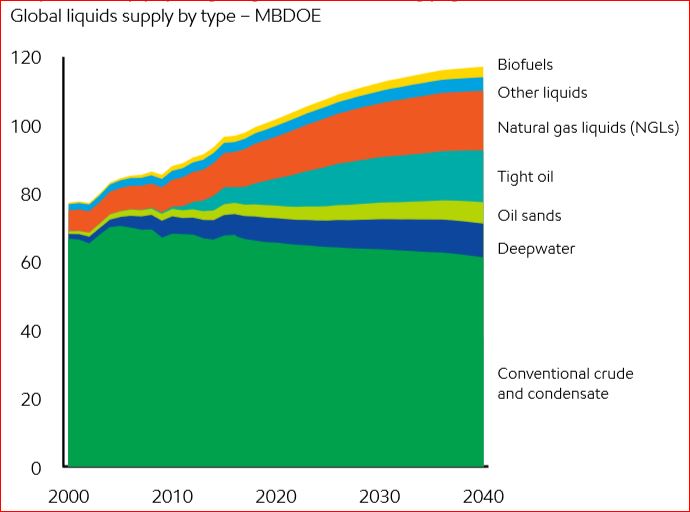
This is what they say we will need in 2040 and will therefore be delivered by technology.
Image may be NSFW.
Clik here to view.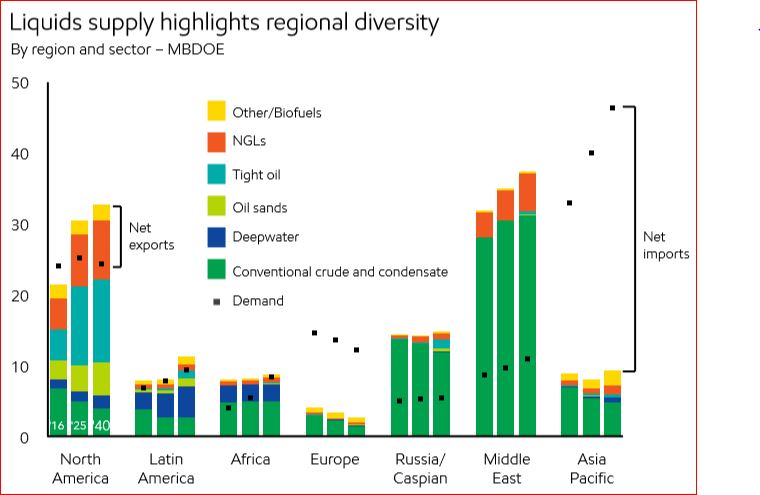
And here is where all that oil will come from. North America is the US and Canada. They count Mexico as part of Latin America. In 2040 they have total North American conventional production down to about 3.5 million barrels per day. They have at about 12 million bpd and oil sands at about 4.5 million bpd as best as I can eyeball the chart.
They have almost all conventional oil coming from the Middle East and Russia/Caspian. Caspian is mostly Azerbaijan.
• Global liquids production rises by 20 percent to meet demand growth
• Technology innovations lead to growth in natural gas liquids, tight oil, deepwater, oil sands and biofuels
• Technology enables efficient production from conventional sources, which still account for more than 50 percent of production in 2040
• Most growth over the Outlook period is seen in tight oil and natural gas liquids, which reach nearly 30 percent of global liquids supply by 2040
• Continued investment is needed to mitigate decline and meet growing demand
• Liquids trade balances shift as supply and demand evolve
• North America swings to a net exporter as shale growth continues
• Latin America exports increase from deepwater, oil sands and tight oil supplies
• The Middle East and Russia/Caspian remain major oil exporters to 2040, and Africa shifts to an importer
• Europe remains a net oil importer, as demand and production both decline
• Asia Pacific imports increase to 80 percent of oil demand in 2040
Image may be NSFW.
Clik here to view.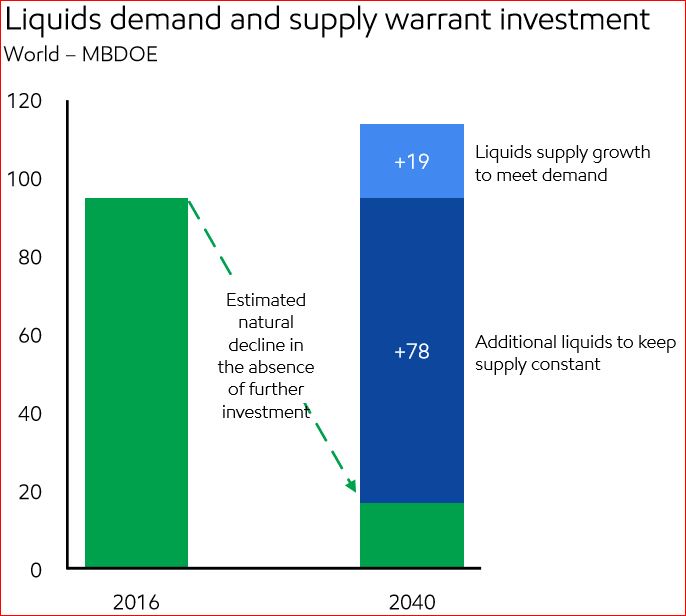
This chart is a little shocking. They have total liquids declining to about 18 million bpd by 2040 without investment. That means if everyone stopped drilling today, or in 2016, that would be the natural decline of what is online today. But to meet demand we will need 97 million barrels per day of new oil.
Image may be NSFW.
Clik here to view.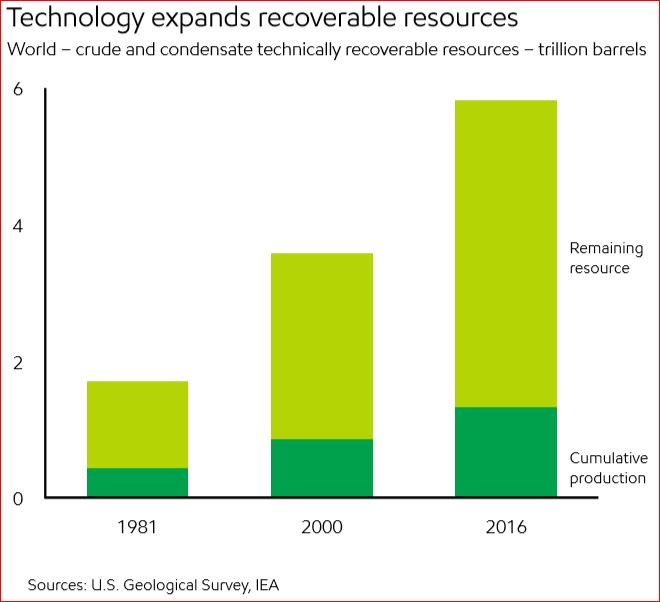
And this is what they say we have left, about 4.5 trillion barrels of remaining recoverable resources.
• Without further investment, liquids supply would decline steeply
• More than 80 percent of new liquids supply needed to offset natural decline
• Per the International Energy Agency, about $400 billion a year of upstream oil investment is needed from 2017 to 2040
• Global oil resources are abundant
• Oil resource estimates keep rising as technology improves
• Technology has added tight oil, deepwater and oil sands resources
• Less than one-quarter of global oil resources have been produced
• Remaining oil resources can provide about 150 years of supply at current demand
So not to worry. Peak oil will not be reached in your lifetime, or in the lifetime of your children, grandchildren or greatgrandchildren. Well, that is if these estimates are correct.
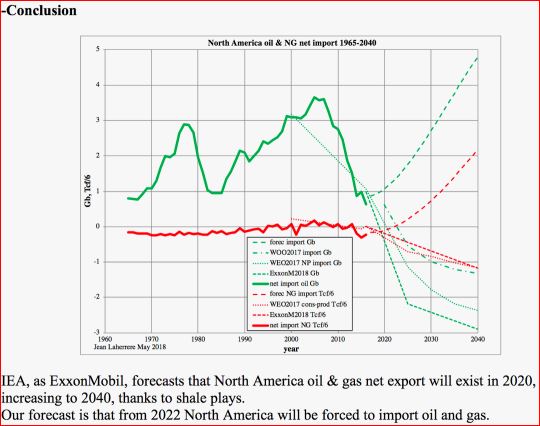
Jean Laherrere has a different outlook. He just posted me the below comments and chart. I could not get the chart to post in the comments section so I put it up here.
dear Ron
In your last good post on U.S. & World Oil Production and ExxonMobil OutlookYou mention the optimistic forecast by ExxonMobil on North America exportI sent you my last papers, which are on the site of ASPO France:
-Laherrere J.H. 2018 “Graphs on North America oil & gas net imports” ASPO France meeting 5 June 2018 https://aspofrance.files.wordpress.com/2018/06/namnetimportforecasts.pdf
-Laherrere J.H. 2018 “US, Canada & Mexico oil & gas production, consumption & net import” May https://aspofrance.files.wordpress.com/2018/05/uscame2018.pdf
-Laherrere J.H. 2018 “Forecasts for Canada oil and gas production” May https://aspofrance.files.wordpress.com/2018/05/canada2018.pdf
-Laherrere J.H. 2018 “Forecasts for US oil and gas production” March https://aspofrance.files.wordpress.com/2018/03/lahall19march.pdf
My conclusion is simple: for North America in 2040 the forecasts of EIA or ExxonMobil should change the sign of exports for oil and natural gas: instead of export it would be import.
Image may be NSFW.
Clik here to view.